PRESS RELEASE
Elastic Delivers a New Uptime Solution for Real-Time Monitoring and Availability of Systems and Services
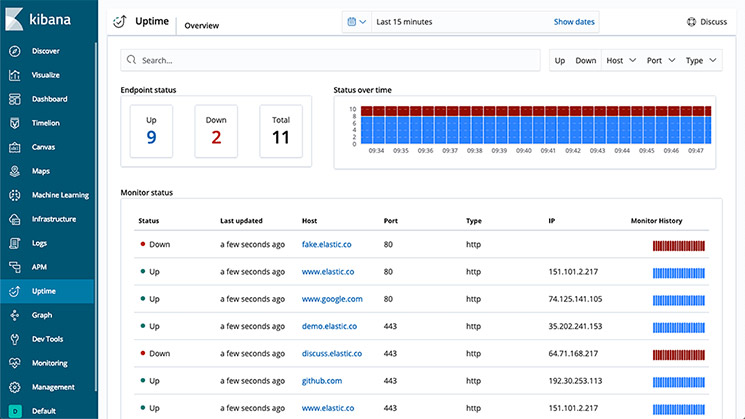
Elastic N.V. (NYSE: ESTC), the company behind Elasticsearch and the Elastic Stack, announced the general availability of the Uptime solution, a new way to monitor system and service uptime and response time. Part of the Elastic Stack 6.7 release, the Elastic Uptime solution enables users to detect when application services are down or responding slowly and proactively notifies users about problems, even before those services are called by the application. The Elastic Uptime solution is immediately available and can be accessed by either downloading the Elastic Stack or within Elasticsearch Service on Elastic Cloud.
"Today’s organizations must be able to react to issues within their applications and systems before they affect end users and disrupt downstream systems,” said Shay Banon, founder and CEO of Elastic. "For organizations already sending logs, metrics, and APM data to Elasticsearch, the Elastic Uptime solution is another facet of observability, making it even simpler to connect the dots, correlate activity, and solve problems quickly.”
Elastic’s Uptime solution monitors systems, services, and APIs by focusing on and verifying that these services are available and returning the correct response codes and content. Based on Heartbeat, a lightweight data shipper for uptime monitoring, Elastic Uptime is transparent, flexible, and developer-friendly and it can be deployed both inside and outside an organization’s network. By continuously asking the inevitable question “Is X down?,” the Uptime solution supports host availability, service monitoring, website monitoring, and API monitoring, giving IT and operations teams more control of the things that they need to monitor. This enables them to detect issues before they occur and troubleshoot problems faster.
The Uptime solution is part of Elastic’s expanded efforts to provide more observability features to help organizations and their users better manage their logs, metrics, and APM data. Uptime is open source and can be used with Elastic’s proprietary features like alerting to provide proactive notifications and machine learning for anomaly detection.
Elastic Stack 6.7 also marks the general availability of two applications in Kibana that make working with log and metrics data more effective for operational analysts. The Logs application is an advanced log viewer with live tail, even on filtered data. The Infrastructure application provides a 10,000-foot view of physical, virtual, or container-based infrastructure, and allows users to drill into the details of any host, pod, or container.
Functionbeat, another feature that fits into the observability effort, is also generally available in version 6.7, further improving support for collection of logs and events from serverless applications. Functionbeat monitors cloud-based serverless infrastructure like AWS Lambda by collecting data from sources such as CloudWatch Logs, Kinesis, and Simple Queue Service (SQS).
Learn More
- Uptime solution blog
- For full release details see the Elastic Stack 6.7 blog
- Start a free trial with Elasticsearch Service
- Read about Elastic’s customers
About Elastic
Elastic is a search company. As the creators of the Elastic Stack (Elasticsearch, Kibana, Beats, and Logstash), Elastic builds self-managed and SaaS offerings that make data usable in real time and at scale for search, logging, security, and analytics use cases.
Elastic and associated marks are trademarks or registered trademarks of Elastic N.V. and its subsidiaries. All other company and product names may be trademarks of their respective owners.