Elastic Observability 8.1: Visibility into AWS Lambda, CI/CD pipelines, and more


 Share on Twitter
Share on Twitter

 Share on LinkedIn
Share on LinkedIn

 Share on Facebook
Share on Facebook

 Share by Email
Share by Email

 Print this page
Print
Technologies such as serverless computing frameworks and CI/CD automation tools help accelerate software development lifecycles (SDLC) to give development teams a competitive edge in the marketplace. Armed with these technologies, teams can deploy and innovate faster and more frequently by automating repetitive tasks and eliminating the need to manage or provision servers.
With Elastic Observability 8.1, DevOps and SRE teams can now leverage even better support for these technologies with the ability to capture application traces from AWS Lambda, ingest OpenTelemetry logs, and collect detailed Jenkins build logs using the OpenTelemetry Collector.
These new features allow customers to:
- Accelerate release cycles with observability for AWS Lambda functions and CI/CD build pipelines
- Standardize open standards based data collection by ingesting OpenTelemetry logs along with metrics and traces
- Unify these data streams with other relevant observability data and easily navigate investigative workflows without losing context
Elastic Observability 8.1 is available now on Elastic Cloud — the only hosted Elasticsearch offering to include all of the new features in this latest release. You can also download the Elastic Stack and our cloud orchestration products, Elastic Cloud Enterprise and Elastic Cloud for Kubernetes, for a self-managed experience.
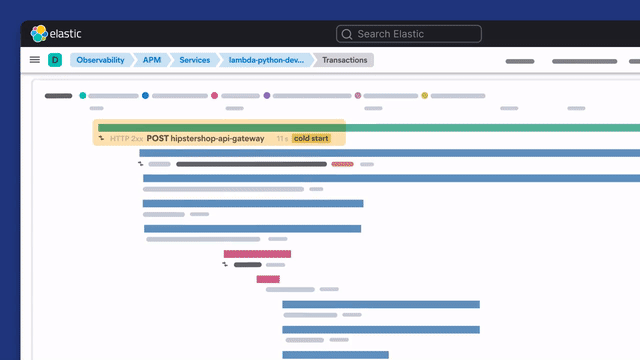
Get enhanced visibility into AWS Lambda (Beta)
Get end-to-end application performance monitoring (APM) visibility and correlate AWS Lambda traces with other Elastic Observability data for faster and more comprehensive root cause analysis.
Lambda is a popular high-availability compute service provided by Amazon that lets developers run event-driven functions on a pay-per-use basis without having to provision or manage servers — increasing development efficiency and controlling costs.
With Elastic Observability 8.1, development teams can now collect serverless application traces from Lambda functions written in Node.js, Python and Java. Elastic additionally supports native cloud monitoring with open standards with the ability to collect Lambda traces via OpenTelemetry (Java and Python only).
Augment CI/CD observability with Jenkins logs
Developers around the world rely on Jenkins automation to reliably build, test, and deploy their software. Elastic empowers developers with visibility into their CI/CD pipelines with high level health indicator dashboards and drill-downs, along with intuitive visualizations of critical build activities.
Now, in Technical Preview with Elastic Observability 8.1, teams can improve traceability of their software supply chain process by additionally collecting detailed Jenkins logs, including errors and build execution details, such as test outputs, using the OpenTelemetry Collector.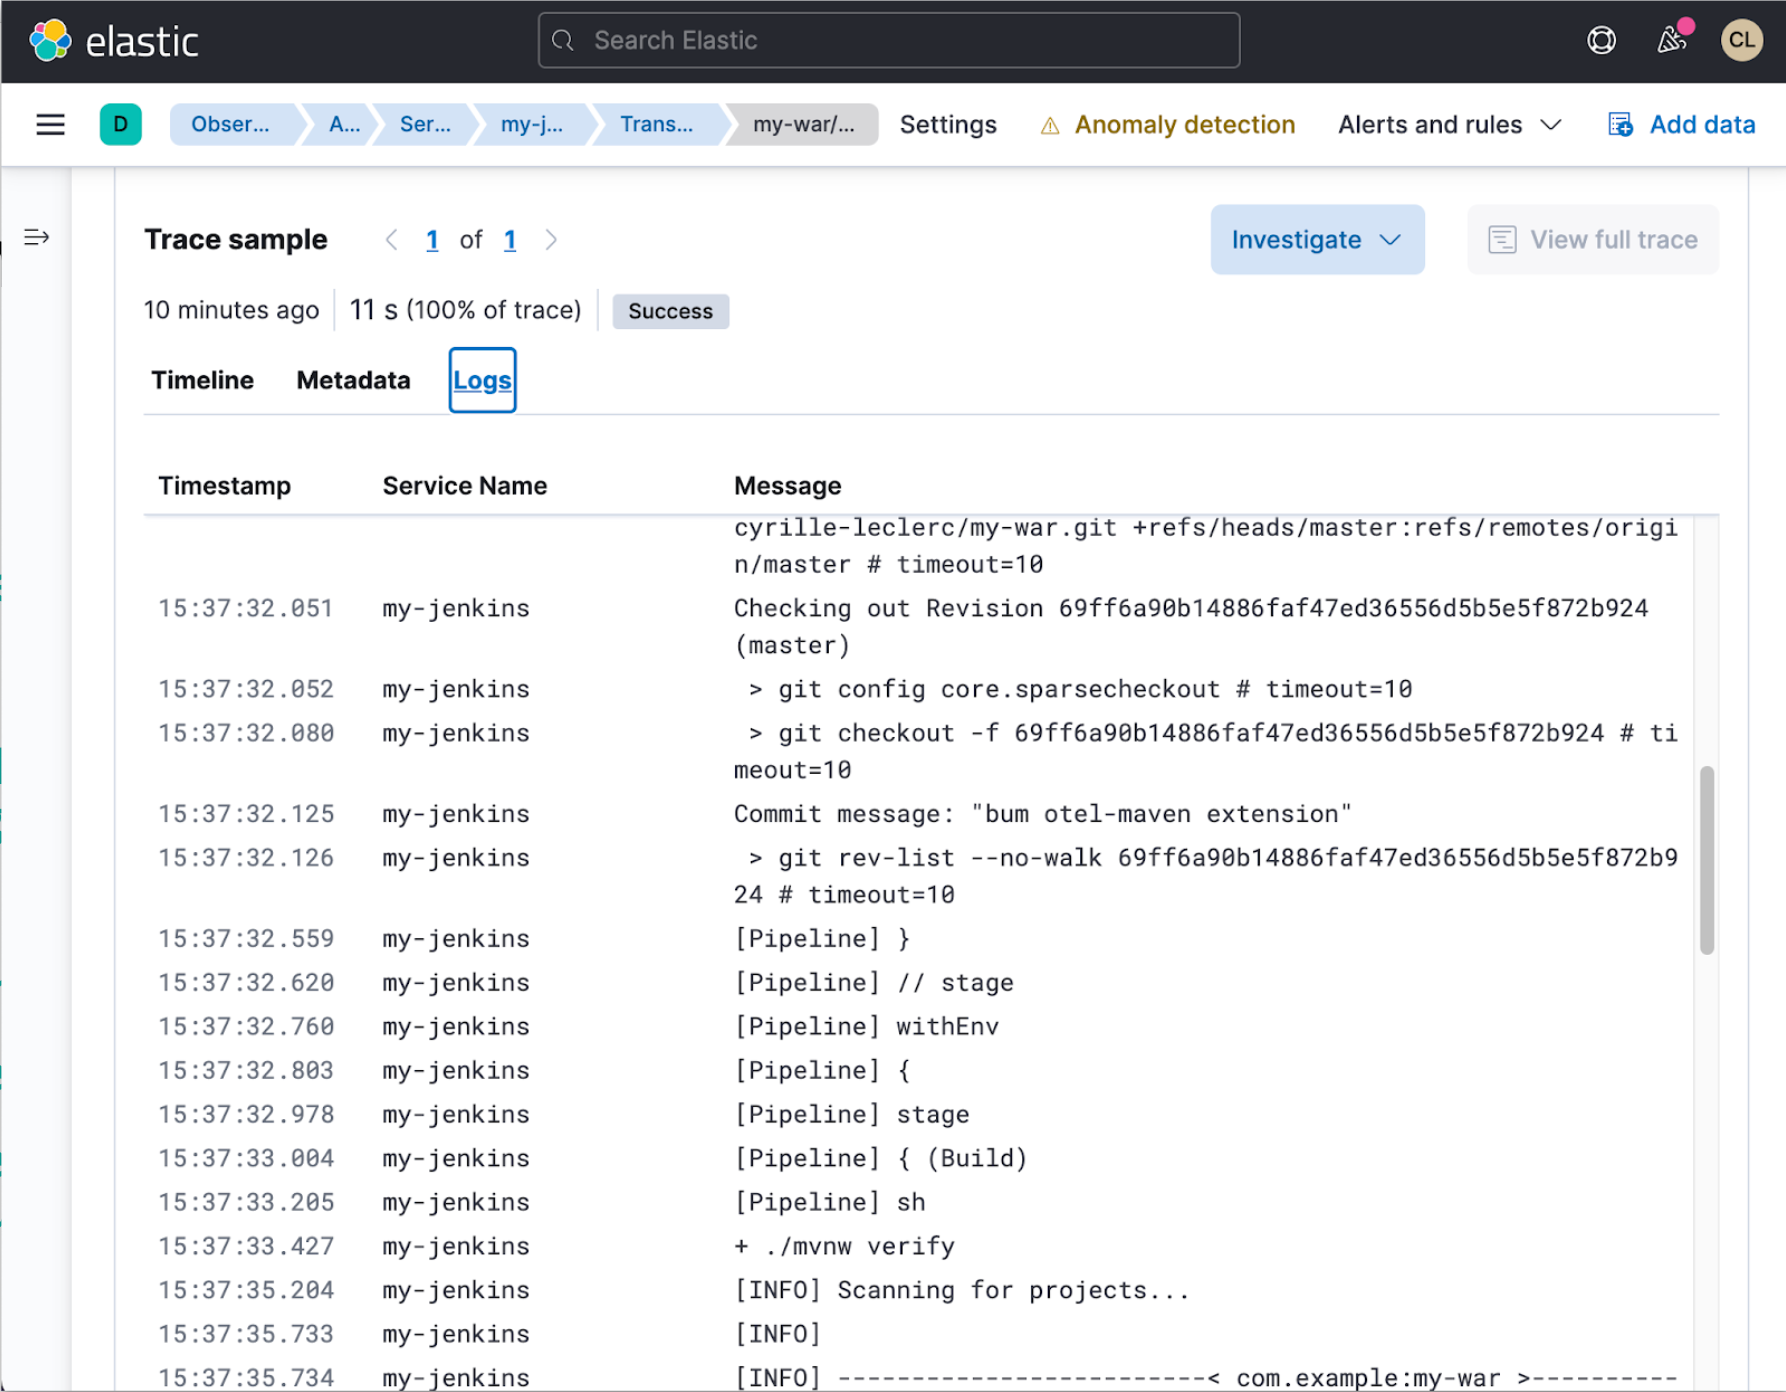
Standardize data collection with OpenTelemetry
Elastic Observability users can now also ingest OpenTelemetry logs, in addition to existing support for ingesting OpenTelemetry metrics and traces. With the ability to ingest OpenTelemetry observability data into Elastic, DevOps teams can now maintain an open standards-based, vendor-neutral observability architecture while streamlining investigative workflows with contextual navigation across signal types and layers.
.png)
Accelerate troubleshooting with unified observability
Elastic Observability 8.1 extends visibility to additional platforms and data sources, including AWS Lambda traces, OpenTelemetry logs, and Jenkins build details.
With all the data in one place, within one common schema, teams that use Elastic can streamline investigative workflows and easily correlate across and navigate to other relevant observability data for contextual troubleshooting. In addition, leveraging Elastic’s frozen tier for cost effective and secure long-term storage enables better root cause analysis and audit trails based on historical data. These advantages, unique to Elastic, are now extended to storing and analyzing OpenTelemetry logs, and troubleshooting CI/CD pipeline anomalies and serverless applications.
Try it out
Existing Elastic Cloud customers can access many of these features directly from the Elastic Cloud console. If you’re new to Elastic Cloud, take a look at our Quick Start guides (bite-sized training videos to get you started quickly) or our free fundamentals training courses. You can always get started for free with a free 14-day trial of Elastic Cloud. Or download the self-managed version of the Elastic Stack for free.
Read about these capabilities and more in the Elastic Observability 8.1 release notes, and other Elastic Stack highlights in the Elastic 8.1 announcement post.
The release and timing of any features or functionality described in this post remain at Elastic's sole discretion. Any features or functionality not currently available may not be delivered on time or at all.
Share
- Share on Twitter
Share on Twitter
- Share on LinkedIn
Share on LinkedIn
- Share on Facebook
Share on Facebook
- Share by Email
Share by Email
- Print this page
Print