Tracing AWS Lambdas with OpenTelemetry and Elastic Observability
Why OpenTelemetry?
Open Telemetry represents an effort to combine distributed tracing, metrics and logging into a single set of system components and language-specific libraries. Recently, OpenTelemetry became a CNCF incubating project, but it already enjoys quite a significant community and vendor support. OpenTelemetry defines itself as “an observability framework for cloud-native software”, although it should be able to cover more than what we know as “cloud-native software”. Quoting its mission statement, “OpenTelemetry is a collection of tools, APIs, and SDKs” that are used “to instrument, generate, collect, and export telemetry data (metrics, logs, and traces) for analysis to understand the software's performance and behaviour”.
We at Elastic find the mission statement of OpenTelemetry about unifying the observability data collection to be highly complementary to how we built our stack for unified observability. Elastic Observability can be used with OpenTelemetry instrumentation to do distributed tracing of your applications that utilise AWS Lambdas and other technologies.
Benefits of using OpenTelemetry for the users
OpenTelemetry defines the standard protocol for sending the observability data to the backend for analysis. While the protocol is in the various stages of readiness for traces, metrics and logs data, once ready, it will allow the users to rely on OpenTelemetry agents and collectors to instrument their applications and infrastructure without having to choose the best tool for the job on day one. Standardisation allows users to create a collection of tools and switch between different tools without changing the application instrumentation. OpenTelemetry also allows adding additional instrumentation where the current implementation falls short.
OpenTelemetry levels the playing field for the newcomers, helping break the vendor lock-in and allowing more competition between existing vendors forcing them to focus on providing the best possible user experience for their customers base.
Why Elastic for OpenTelemetry?
One of the core design principles behind Elastic observability was providing a single seamless end-to-end solution for all observability data. Examples of such features in Elastic stack include:
- Elastic Common Schema provides a unified way of storing and representing logs, metrics and traces.
- Ability to correlate between metrics, logs and traces within the same UI.
- New Elastic Agent and Fleet that unifies and simplifies the data collection.
- Ability to seamlessly handle high cardinality telemetry data that is problematic for other tools used for telemetry data collection.
- Long term data retention with cold and frozen storage tiers built on searchable snapshots.
- Machine learning-powered anomaly detection to simplify alert threshold setting.
Elastic Stack for Observability
Because we will cover terms specific to the Elastic stack, let’s review the main components used for observability:
- Elasticsearch - this is the heart of the stack, the NoSQL datastore slash search engine slash time-series database. It stores the data, calculates and aggregates the data, scales up and out to accommodate the data, no matter how large it is.
- Kibana - AKA the user interface into the Elastic stack, but it is much more than a pretty face. It is the home for dashboards, APM/Logs/Metrics UIs, and much more.
- APM agents - traces and metrics collection agents that can be deployed alongside or as part of the application. In this post, we will be using OpenTelemetry agents, but I wanted to make sure the readers are aware of the equivalent Elastic APM agents.
- APM server is the server-side component that APM agents send their collected telemetry data to. It also supports OpenTelemetry intake and translates the OpenTelemetry protocol into Elastic Common Schema. From this point on, the collected OpenTelemetry data becomes normalised in the same way as any other data source and the Elastic stack can use it to power various parts of Kibana: APM, Metrics and Logs UIs, Service landing pages, etc.
- Beats - lightweight data shippers for logs, metrics and other data. You may know them by their names: Filebeat, Metricbeat, Heartbeat, etc.
- Elastic Agent - the next generation of telemetry collection agents that replaces the beats family with just a single agent that can be used in all the roles the beats agents are currently acting. It comes with the server-side component called a Fleet server that helps to manage the fleet of agents out there.
Tracing lambdas - the setup
AWS popularised lambdas as a way of running small pieces of code (functions) without worrying about the underlying infrastructure. AWS will spawn the lambda just in time for its use and will take care of concurrency when the volume of requests increases, however, while being extremely convenient, lambdas introduce several limitations. What we can deploy alongside the lambda code, how big can the resulting package be, or lack of control over the life-cycle of lambdas are the key limitations.
It is often not desirable to instrument lambdas directly with APM agents, mainly because of the code size limitations and not being able to shut down the agent, draining all the collected traces properly collected by the agent but not yet sent to the backend. To solve this, we will use what AWS built and released as AWS Distro for OpenTelemetry (ADOT) for lambdas. ADOT is packaged as a lambda layer and for those of you new to the layers concept, it is akin to a dynamic library made available to the lambda code at runtime through configuration rather than including it as a development time.
ADOT layer includes the required OpenTelemetry libraries for the chosen runtime alongside a specially built version of OpenTelemetry Collector that receives the data from the OpenTelemetry agent and sends it to the pre-configured backend. At the time of writing, AWS Distro for Open Telemetry supports several runtimes and we will instrument 2 connected Node.js lambdas and invoke them using a locally running Node.js client instrumented with Elastic APM agent. The setup illustrates how Elastic APM can trace AWS lambdas, support both OpenTelemetry and Elastic APM agents, and allows distributed tracing through multiple components leveraging both technologies for tracing.
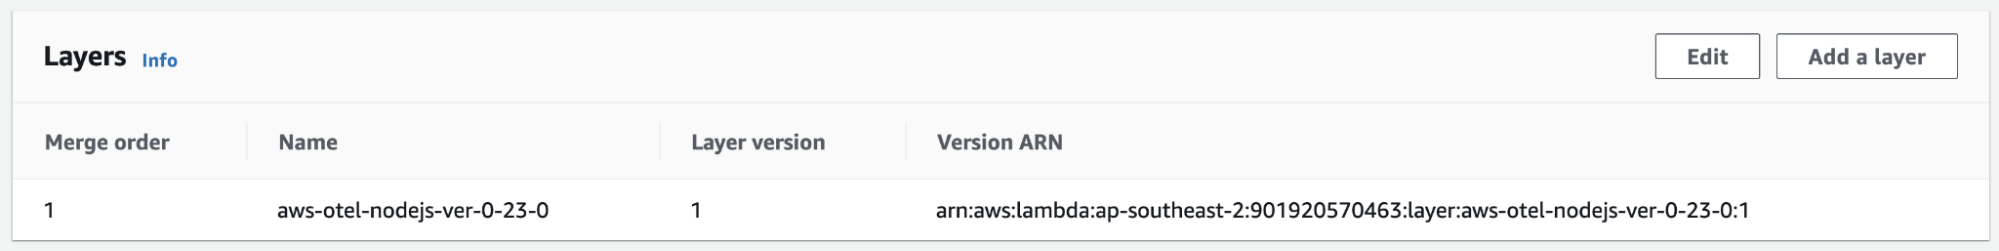
Adding AWS Distro for Open Telemetry layer to lambda
First, we will need to add the ADOT layer to our lambda definition by selecting the ARN that considers the region where lambda is going to be deployed. For Node.js, we define it as follows, where the region is of the format ap-southeast-2:
arn:aws:lambda:<region>:901920570463:layer:aws-otel-nodejs-ver-0-23-0:1
Under the Code section of lambda definition in AWS Console it should show:
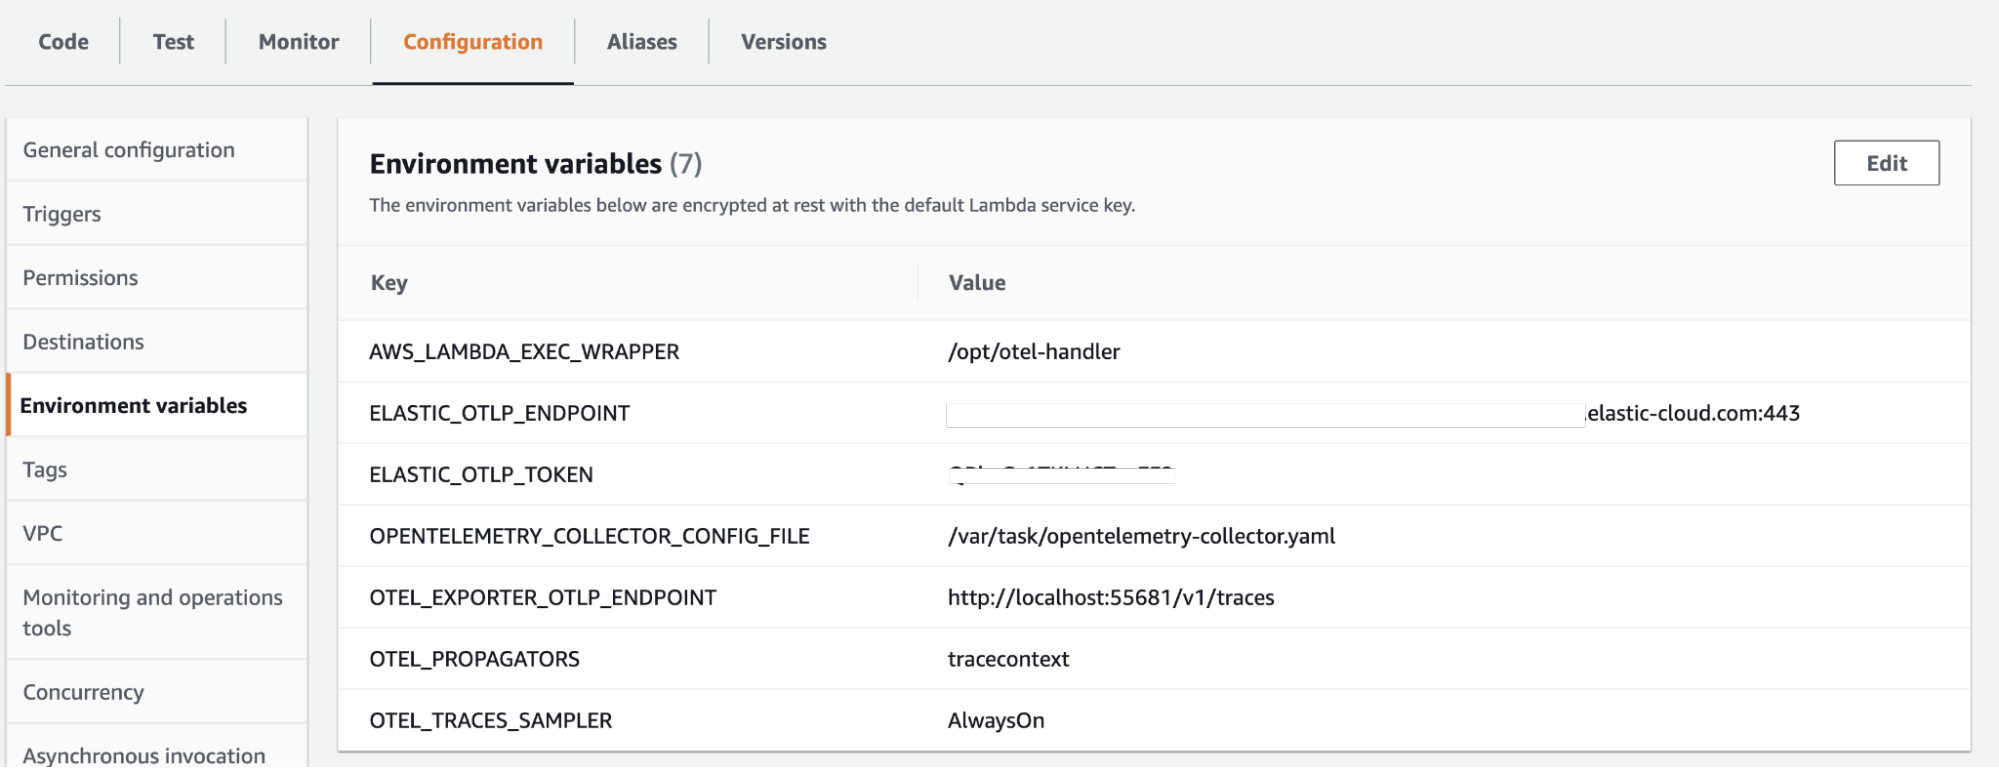
Configure environment variables
Next, we need to configure the environment variables. There are more variables available to configure AWS lambdas and OpenTelemetry, but these are the relevant ones for our use case:
#Default Node.js lambda wrapper for ADOT
AWS_LAMBDA_EXEC_WRAPPER: /opt/otel-handler
# Pointer to our Collector config
OPENTELEMETRY_COLLECTOR_CONFIG_FILE: /var/task/collector.yaml
# Elastic APM server connection details
APM_SERVER_URL: <Elastic APM Server endpoint URL>
APM_SERVER_TOKEN: <APM secret token>
# Define W3C trace context propagation
OTEL_PROPAGATORS: tracecontext
# Required setting until this https://github.com/open-telemetry/opentelemetry-js/pull/2331 is merged and released.
OTEL_EXPORTER_OTLP_ENDPOINT: "http://localhost:55681/v1/traces"
# Turn on sampling, if not sent from the caller. This can potentially create a very large amount of data.
OTEL_TRACES_SAMPLER: Always_On
Here is how it looks in the Configuration section for environment variables in AWS Console:
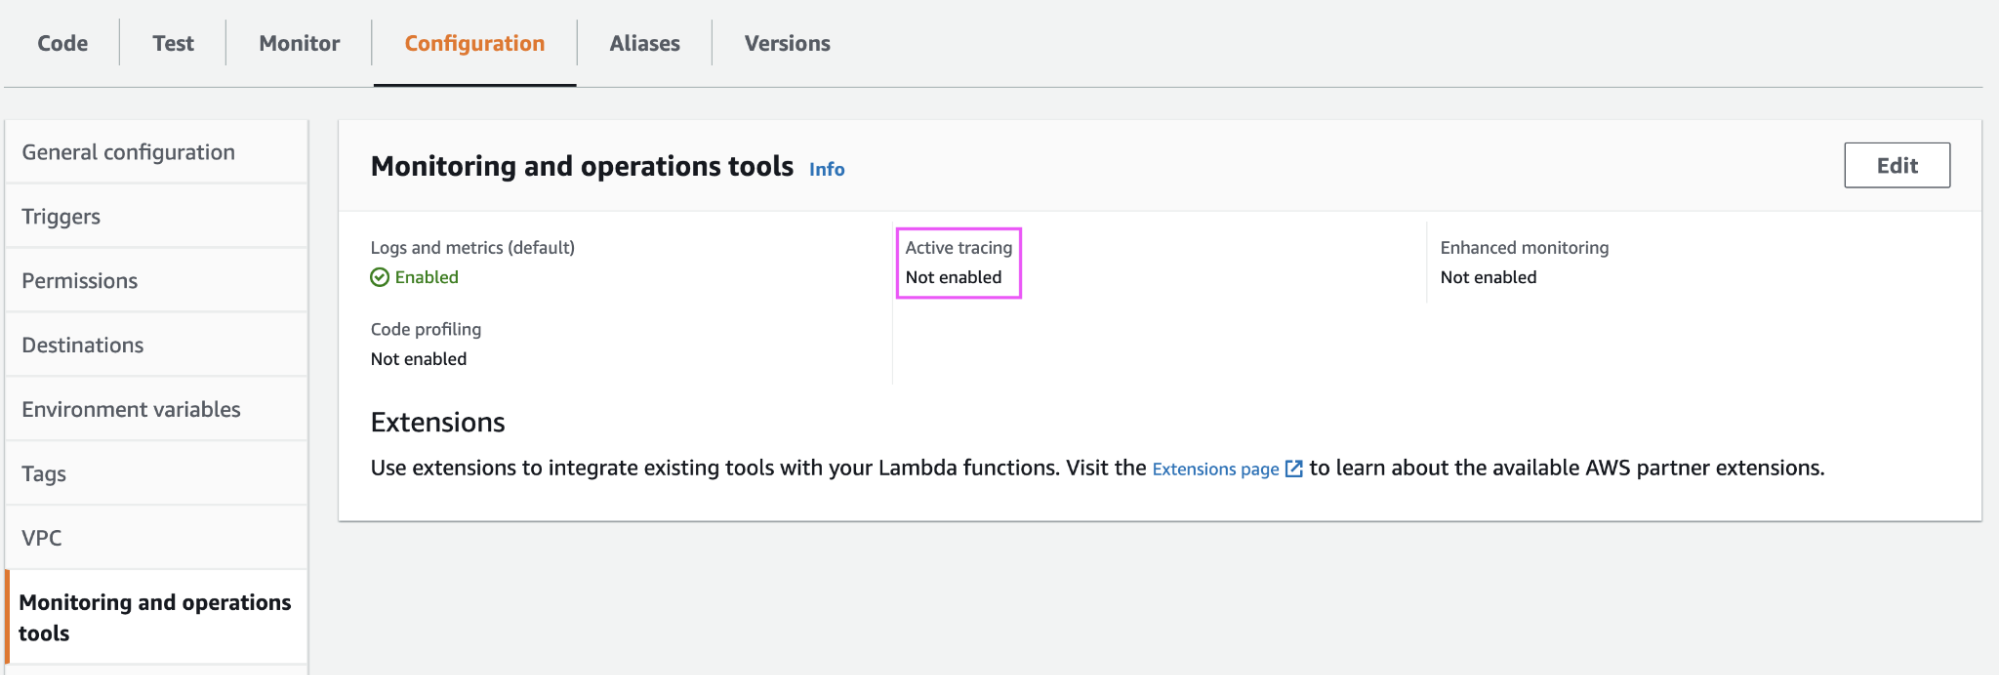
Turning off Active Tracing
If we turn the Active tracing on, the OpenTelemetry libraries packaged with the ADOT layer will use another way of trace context propagation proprietary to AWS X-Ray. With our example, we want to leverage the technology-agnostic trace context standard defined by W3C. This is set by the environment variable OTEL_PROPAGATORS: tracecontext that we configured earlier. To switch off the default X-Ray tracing, turn off Active Tracing as well in the Monitoring Section:
Sample Serverless project
To illustrate how to trace lambdas with AWS Distro for OpenTelemetry can be done in your application, here is a sample project that utilises the Serverless framework and includes the following key components:
serverless.yml- Serverless framework deployment descriptor,handler.js- Javascript code for 2 lambda functions, producer and consumer,client.js- a Node.js client instrumented with Elastic APM Javascript agent,collector.yaml- ADOT Collector configuration
Prerequisites
As a prerequisite, to run this project you will need to install the Serverless framework alongside npm and nodejs.
Step 1 - Get the code and install dependencies
Before running the example, clone the repo, install the required nodejs modules.
git clone https://github.com/michaelhyatt/serverless-aws-node-api-worker-otel
cd serverless-aws-node-api-worker-otel
npm install --save-dev
Step 2 - Create an AWS access key with the following permissions
Follow the Access key setup instructions. The key needs to have the following policies attached. Since this is a test environment, the policies are excessive, so narrow it down by experimenting with a more contained set:
- AmazonS3FullAccess
- CloudWatchLogsFullAccess
- AmazonAPIGatewayAdministrator
- AWSCloudFormationFullAccess
- AWSLambda_FullAccess
Step 3 - Create env.json file
env.json file contains the connection details for Elastic APM server (Elastic Cloud is a great option to get started quickly. Here is the link to create a trial cluster) and AWS region where the lambdas need to be deployed. Copy it from the provided template and update it with correct details.
cp env.json.template env.json
# Edit `env.json` to update the correct values
Step 4 - Deployment
Deploy the lambdas and note the full URL of the provide API (consumer lambda) to be used to invoke it.
serverless deploy
Step 5 - Invoke the client
Invoke the deployed lambdas using the provided client.js using the URL from the previous step:
> NODE_DEBUG=request node client.js https://xxxxxxxxxx.execute-api.ap-southeast-2.amazonaws.com/dev/produce
REQUEST {
  url: 'https://xxxxxxxxxx.execute-api.ap-southeast-2.amazonaws.com/dev/produce',
  headers: {
    traceparent: '00-9a6c8a973e20d2e902a4ab877538cda2-0a338cb257d3e1d7-01',
    'Content-Type': 'application/json'
  },
  body: '{"name":"John"}',
  callback: [Function (anonymous)],
  method: 'POST'
}
REQUEST make request https://xxxxxxxxxx.execute-api.ap-southeast-2.amazonaws.com/dev/produce
REQUEST onRequestResponse https://xxxxxxxxxx.execute-api.ap-southeast-2.amazonaws.com/dev/produce 200 {
  'content-type': 'application/json',
  'content-length': '141',
  connection: 'close',
  date: 'Sun, 11 Jul 2021 03:25:52 GMT',
}
REQUEST reading response's body
REQUEST finish init function https://xxxxxxxxxx.execute-api.ap-southeast-2.amazonaws.com/dev/produce
REQUEST response end https://xxxxxxxxxx.execute-api.ap-southeast-2.amazonaws.com/dev/produce 200 {
  'content-type': 'application/json',
  'content-length': '141',
  connection: 'close',
  date: 'Sun, 11 Jul 2021 03:25:52 GMT',
}
REQUEST end event https://xxxxxxxxxx.execute-api.ap-southeast-2.amazonaws.com/dev/produce
REQUEST has body https://xxxxxxxxxx.execute-api.ap-southeast-2.amazonaws.com/dev/produce 141
REQUEST emitting complete https://xxxxxxxxxx.execute-api.ap-southeast-2.amazonaws.com/dev/produce
Status: 200
{"message":"The response from the producer is {\"message\":\"Hello, the current time is 03:25:52 GMT+0000 (Coordinated Universal Time).\"}."}
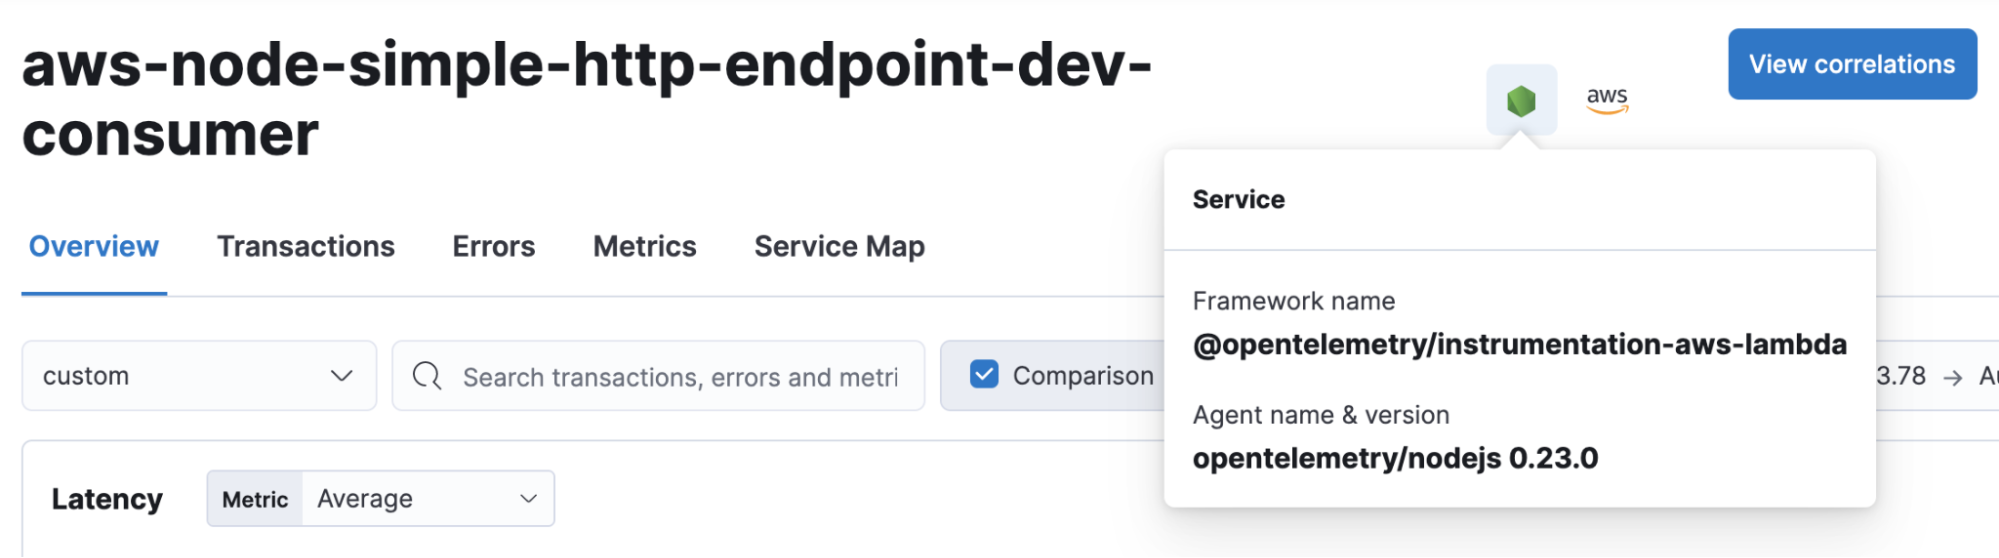
The end result
If the configuration is correct, your Kibana APM UI should show APM traces originated from the client.js script running in your command line and involving the two lambdas deployed in AWS. In mine, it looked something like this:
Service map:
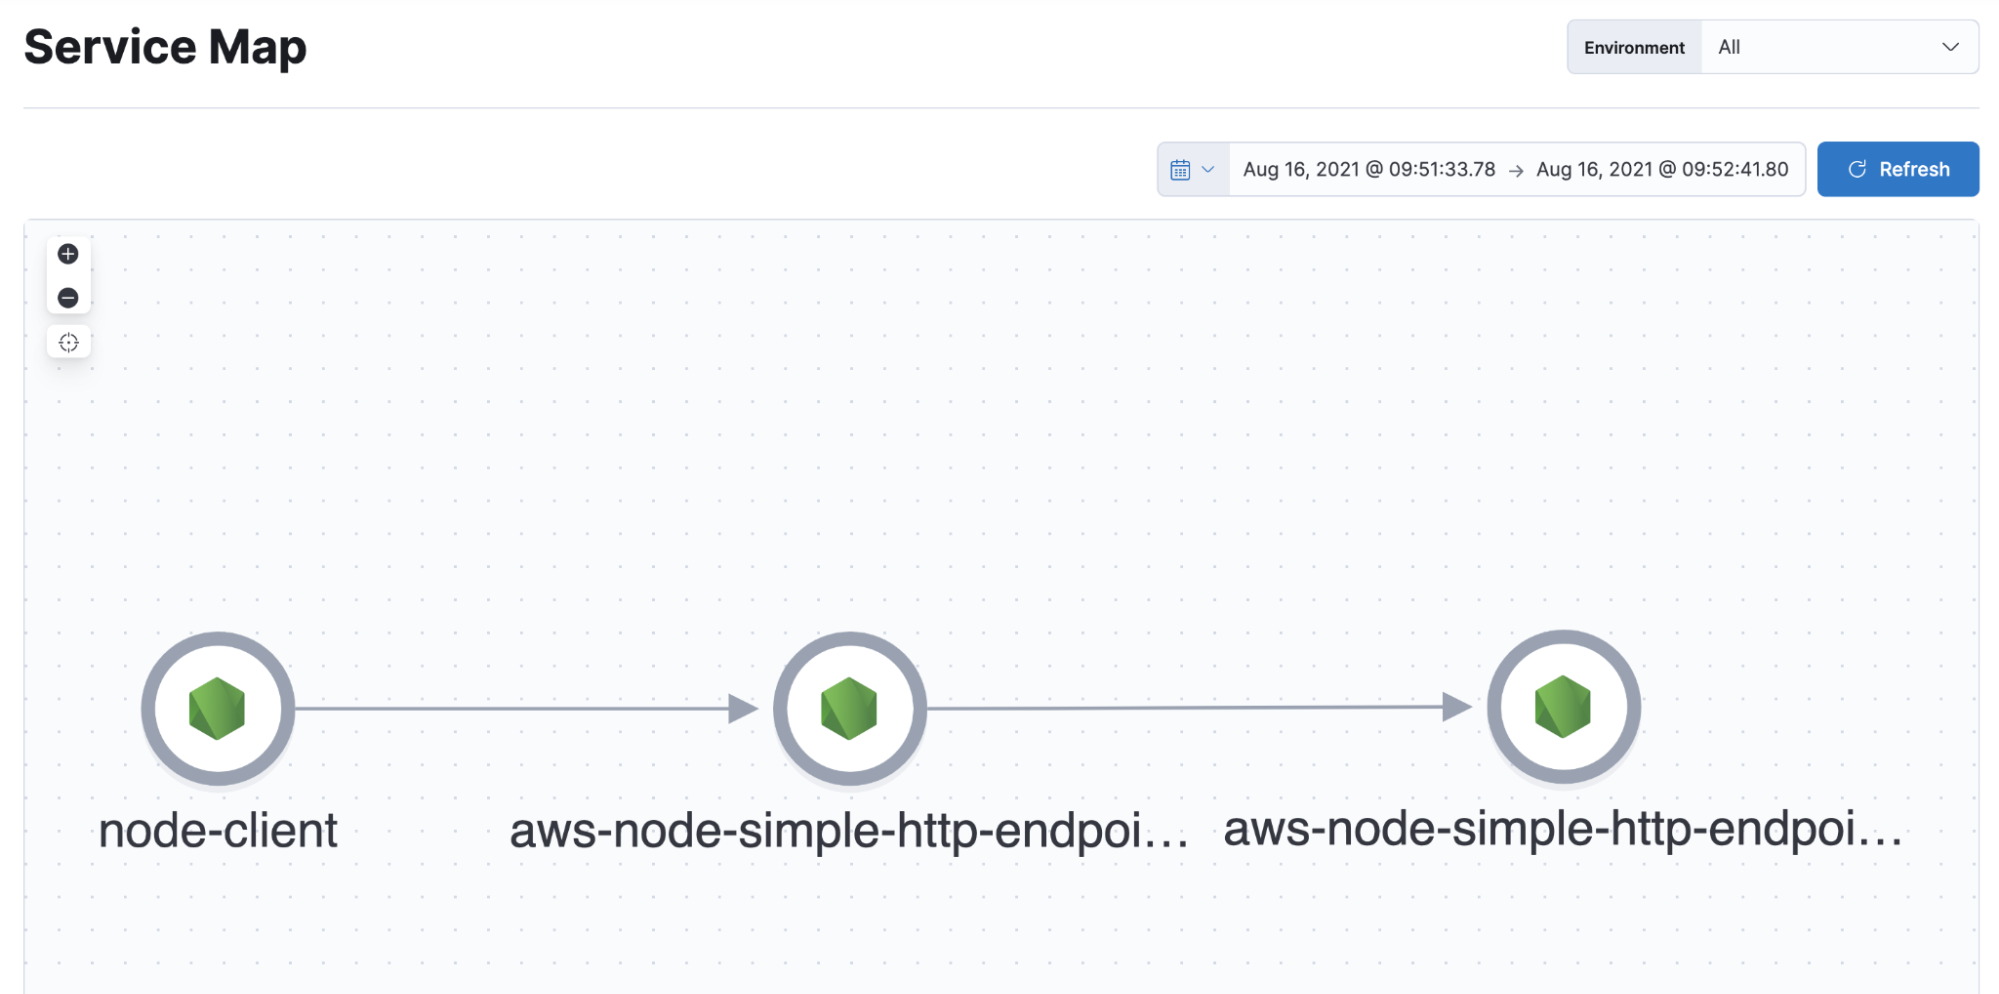
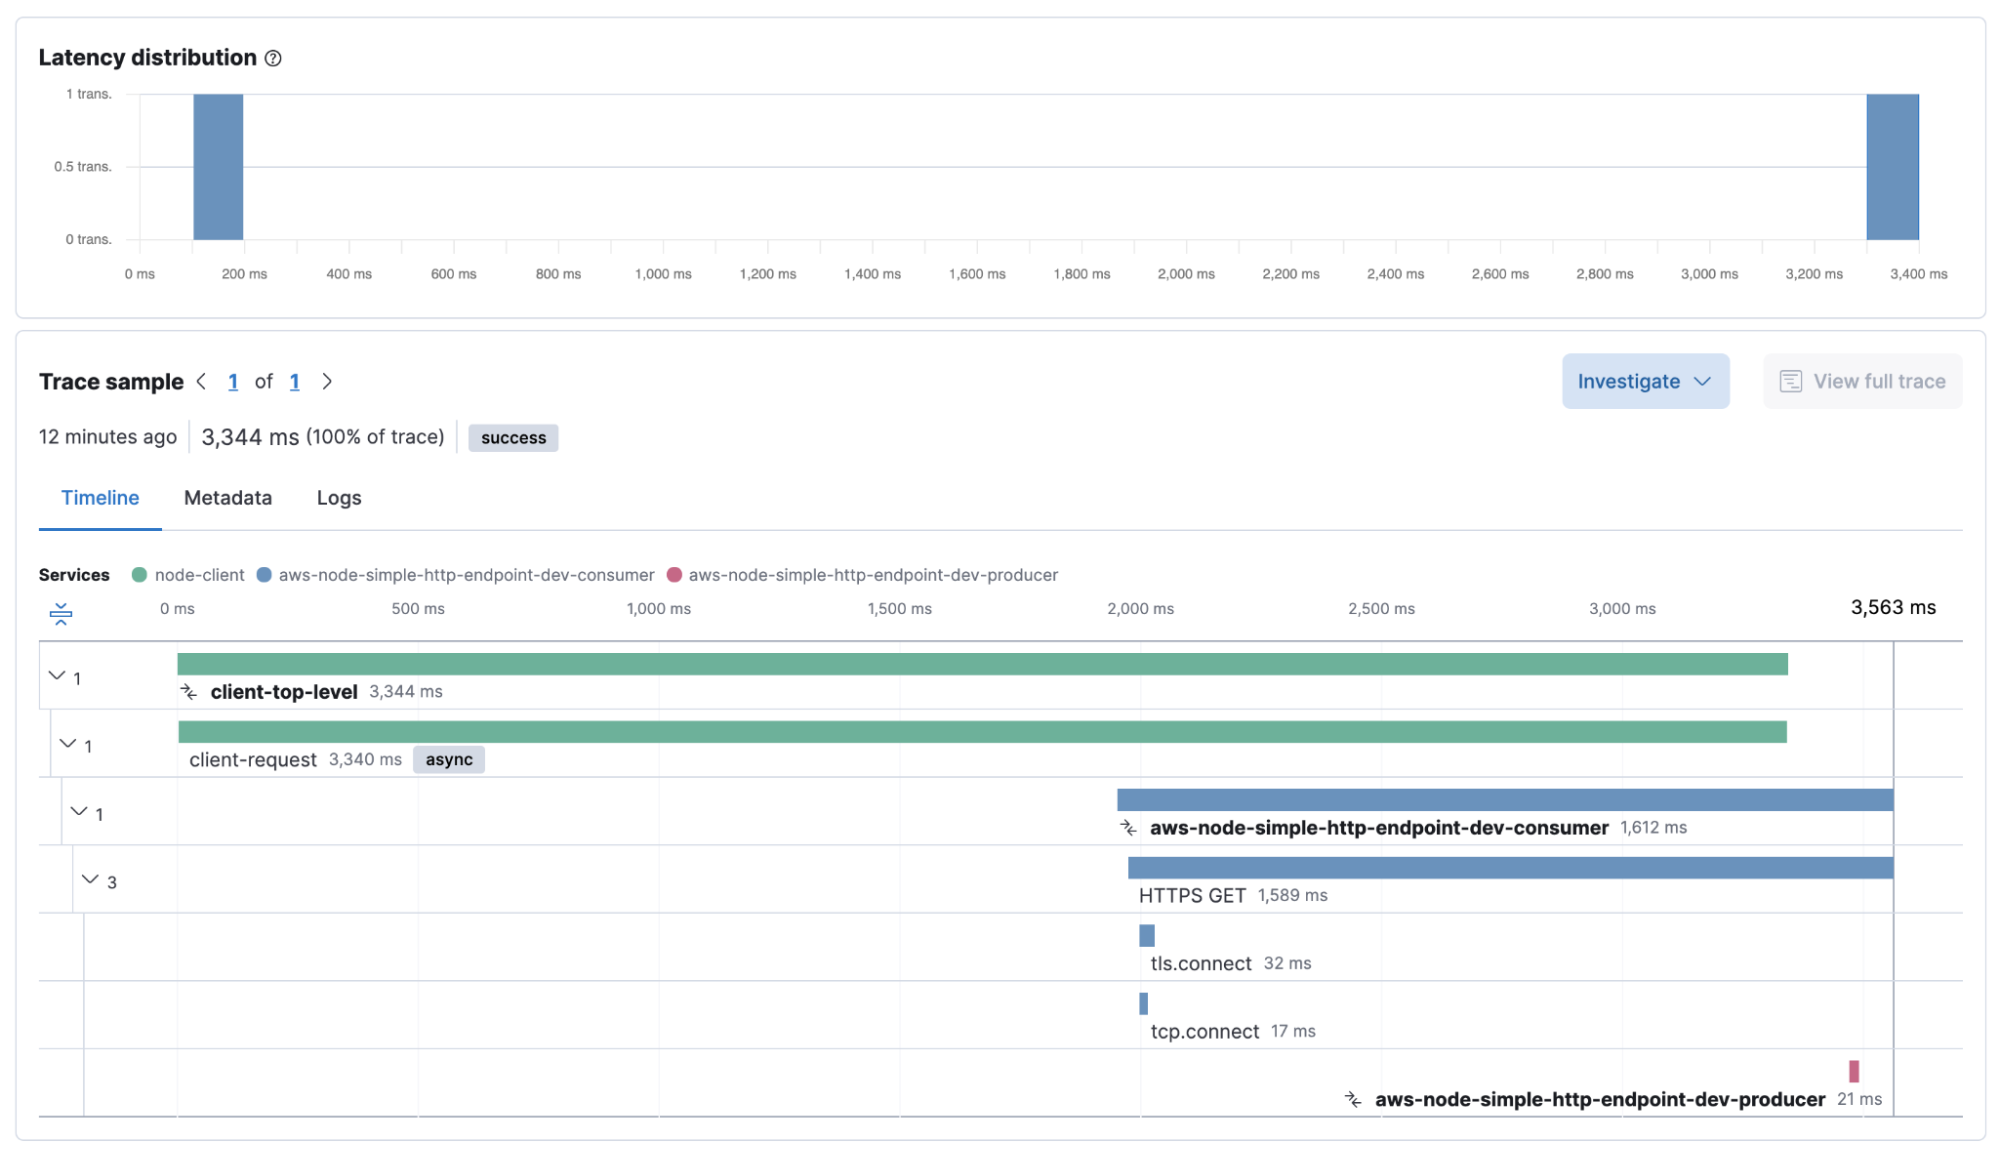
Traces:Note how the time difference between the lambdas and my local client is causing the top-level transaction to appear to finish before the underlying lambda transactions :
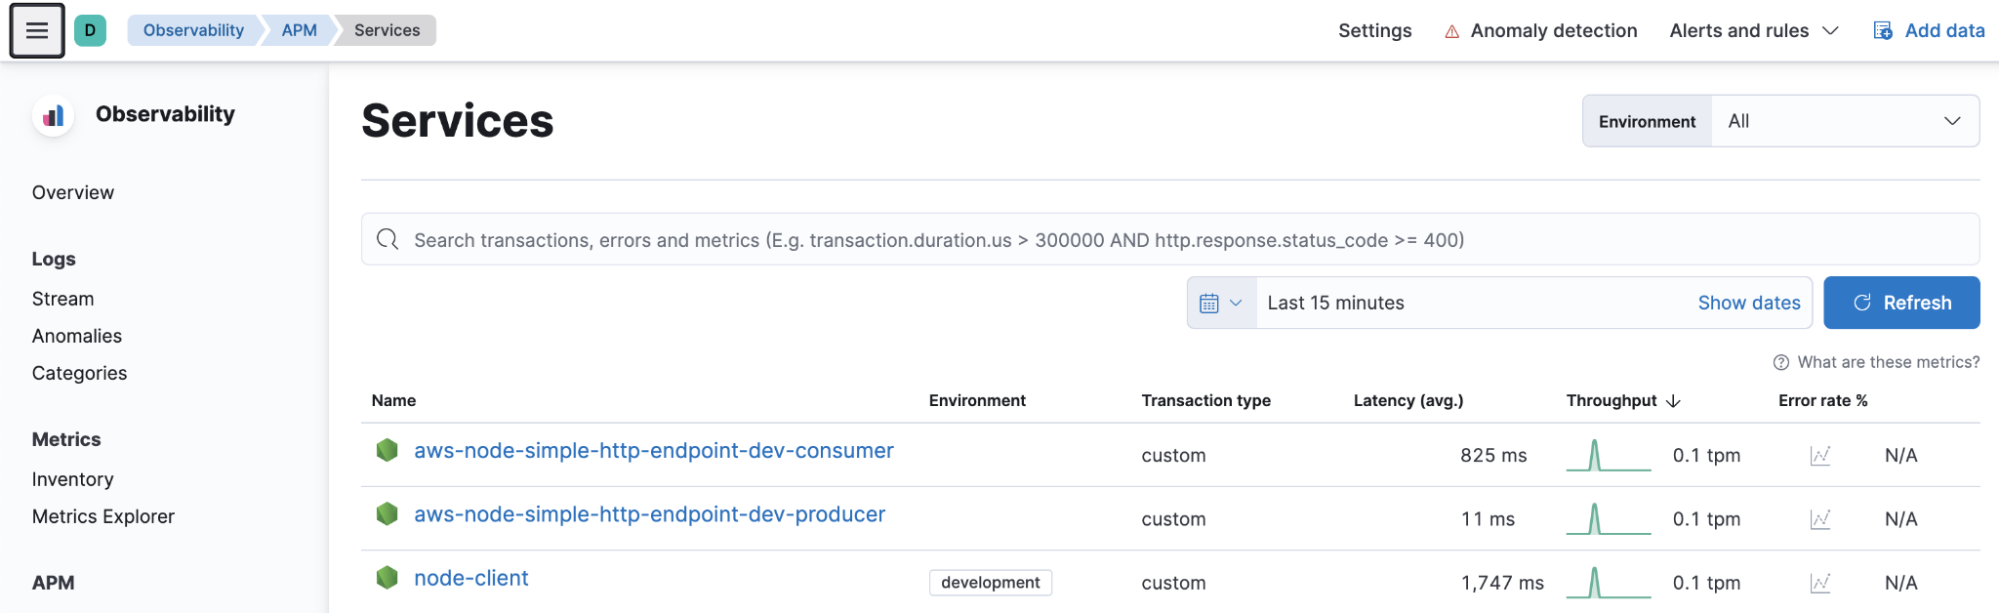
Services view:
Beyond lambdas tracing
Collecting Lambda logs using CloudWatch and Functionbeat
Tracing lambdas is just one thing that we looked at today. Another valuable piece of observability data is logs. AWS lambdas send their logs to CloudWatch and Elastic Functionbeat can capture the CloudWatch logs and send them into Elastic stack. And if the lambda code logs the trace.id in the message's body, the correlation between traces and logs in Kibana APM will allow linking the traces with the log messages that trace execution has emitted. This is powerful -- imagine being able to look at the trace exhibiting an excess latency and immediately being able to switch to the log messages that this trace emitted.
Collecting metrics and traces from more AWS services with AWS Distro for Open Telemetry
ADOT charter outlines several other AWS services it supports. More so, it seems like AWS will add more and more services to the list of its services that can be monitored using AWS Distro for Open Telemetry. This article should provide you with some ideas on how to configure the OpenTelemetry Collector to send the collected observability data to Elastic stack enabling you to expand Elastic observability into more AWS services and give you a more complete picture of your application and infrastructure in one stack.
There are additional ways to collect telemetry data from AWS services using Elastic stack components, such as deploying Metricbeat for Prometheus metrics, Functionbeat for CloudWatch or Kinesis, etc. It is always good to have multiple tools at your disposal.
Wrap-up
OpenTelemetry is a new and exciting initiative that already enjoys broad support from the user community and vendors in the observability and cloud space. As the collection components’ maturity increases, it will give users greater flexibility in setting up their observability in how it suits their requirements and use cases. AWS Distro for OpenTelemetry will be the key initiative to add AWS services monitoring and tracing to the mix of technologies supported by OpenTelemetry and will provide a unified way to collect the observability data without users being locked in proprietary agents, be it observability vendors or AWS own observability toolset.
OpenTelemetry simplifies the observability data collection and validates the approach we at Elastic are following to build our stack. The two together are a superb choice. After all, Elastic stack is and has always been about unified management of all the observability data in one scalable and performing data store, Elasticsearch.