


Easy onboarding and ingestion, and a unified and actionable experience: How Elastic Observability has advanced


Twitter


リンクトイン


Facebook


メール


印刷
Observability continues to grow and become top of mind for IT professionals and developers around the world. As you modernize your application stack for the cloud, you should align your DevOps processes and tools to support your on-premises and cloud environment. Elastic Observability has been hard at work improving and introducing exciting innovation in our observability solution to meet your evolving requirements.
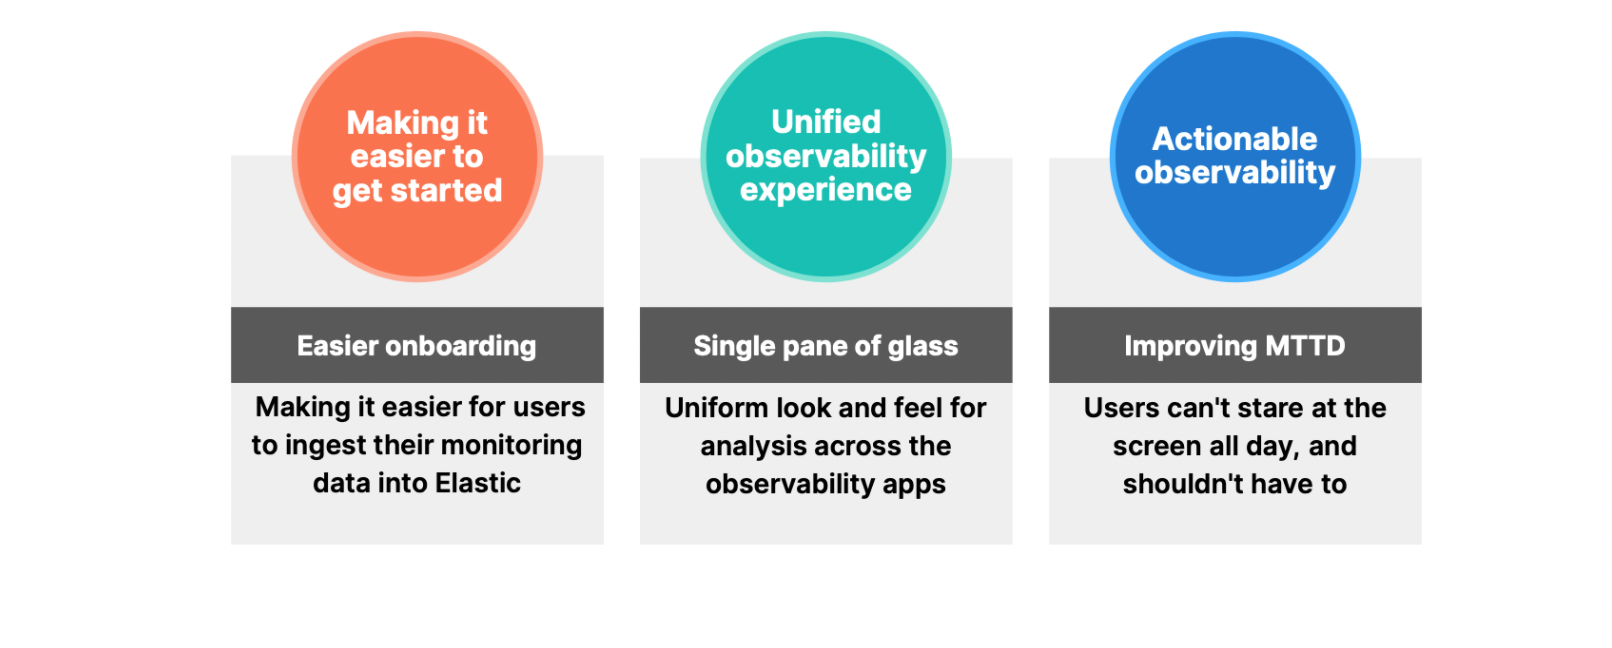
With increased complexity and need to deliver end to end observability, we focused on delivering along the following themes - easy onboarding and data ingestion, a unified observability experience, and finally, actionable observability supported by machine-learning powered anomaly detection and ad hoc analytics. Here’s a look back at the year and some of what we delivered!
Easier onboarding and data ingestion for Elastic Observability
Observability is all about ingesting and processing data to get insights. In the past year, we continued the transition to the Elastic agent with the ability to centrally manage agents at scale. In addition, we continued to broaden our coverage with native integrations for cloud service providers (Microsoft Azure, Google Cloud, AWS).
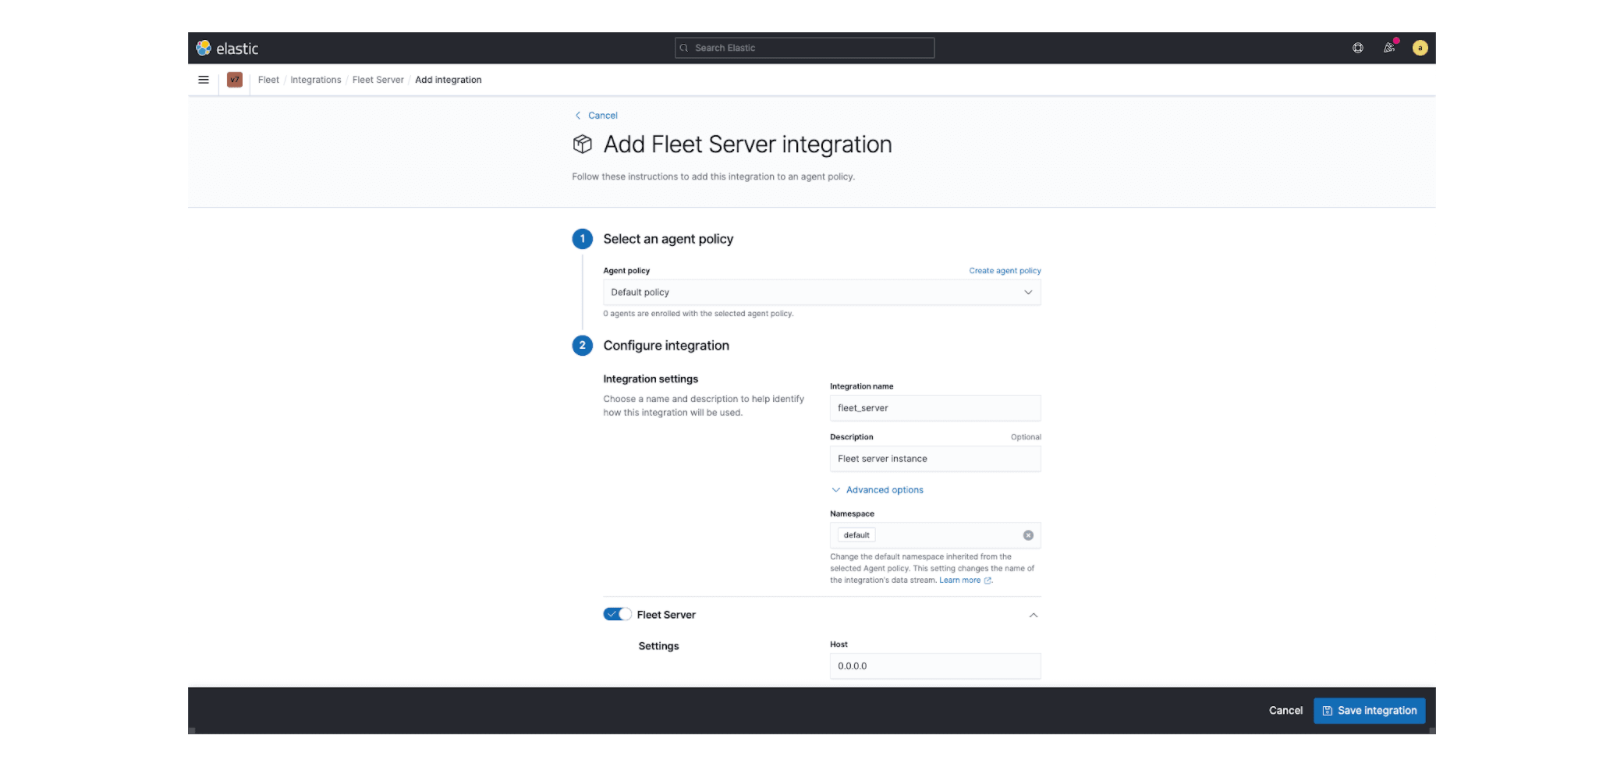
Our new Elastic Agent with centralized management (through Fleet) allows you to unify telemetry across logs, metrics, and traces with just one thing to install, configure, secure, and scale. Onboarding observability and security data has never been faster or easier, reducing administrative load and saving you time and effort. During the year, we also delivered support for observing ARM architectures, popular in much of the mobile and IoT world. This newly added support now allows you to deliver observability for IoT environments. Additional improvements to the Elastic agent provided support for ensuring it’s secure and a new OSquery mechanism, allowing you to uncover real time status and metrics for agents, something quite unique to Elastic.
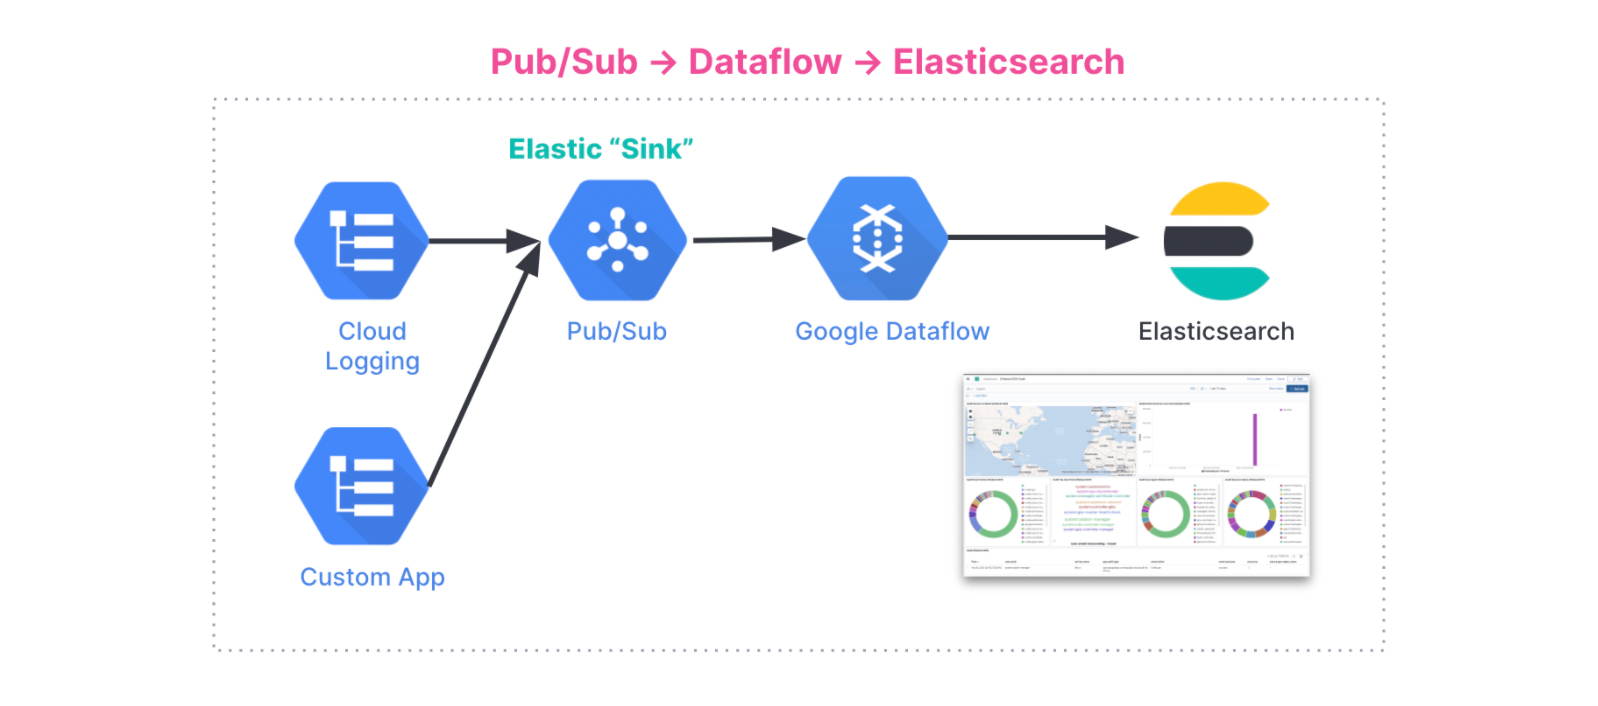
On the cloud provider side of the world, native integration with the Azure console allows you to deploy Elastic Observability with just a few clicks. Our new GCP Dataflow integration allows for frictionless ingestion of logs from Google Cloud and a native integration with AWS FireLens ingests container logs in seconds for Elastic Observability. We also introduced support for native integration with OpenTelemetry which will continue to be a big part of the future for observability.
We joined forces with Optimyze to add frictionless whole-system continuous profiling to Elastic Observability. Built on Extended Berkeley Packet Filter (eBPF) technology, this capability will bring visibility into systems, applications, and services with little to no overhead and no code changes. A true game-changer for observability, moving forward.
Continuing to deliver on unified observability
Beyond the easier data ingestion and onboarding, our next goal was to improve visibility and understanding of all that application and system performance data you’ve collected!
Elastic Observability added new service health indicators on the APM overview page in the Elastic APM app. These machine-learning powered indicators provide an intuitive and visual representation of how your apps are performing in one place and makes it easier for developers and SREs to answer these “why” questions.
- How did a new deployment impact performance?
- What are the top impacted transactions?
- Is regression introduced by downstream services or backends?
- How does performance correlate with underlying infrastructure? Which instances (containers, VMs) are the performance issues occurring on?
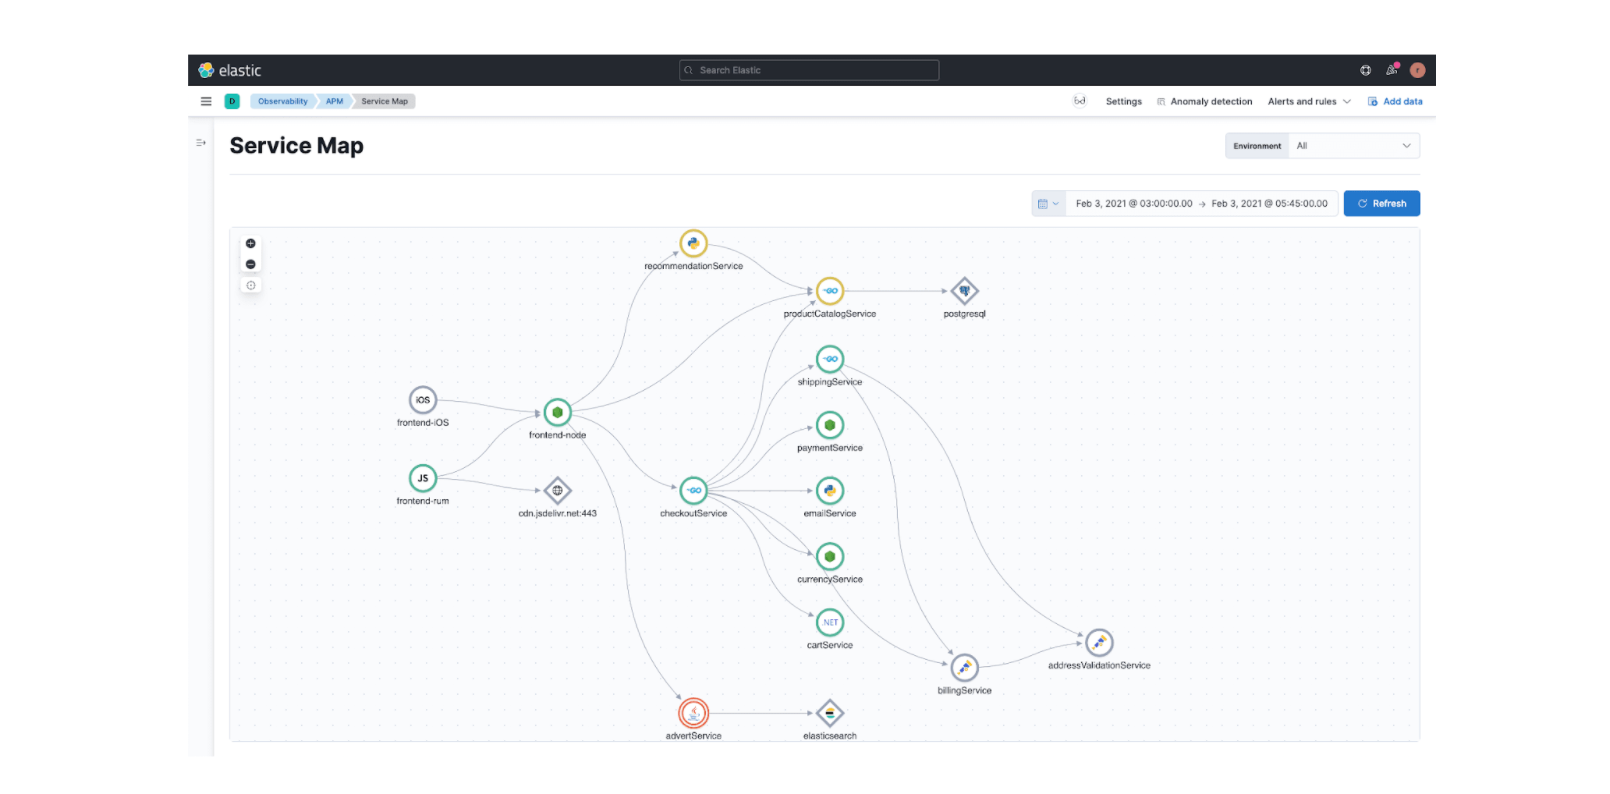
In conjunction with the new hosts infrastructure view and deepened visibility into third party and backend services (caches, databases, and data stores), diagnosing issues has never been easier.
Another key improvement to improve the analytics of your observability data was adding "schema on read" capabilities via runtime fields. While by default, Elastic Observability is schema on write, runtime fields allow you to also apply schema on read for maximum flexibility. Some advantages of schema on read would be when adding new data or new use cases. By having full control of your observability data with schema on read and/or write, you will have the ability to perform analyses, however they are needed.
We also expanded our OpenTelemetry integrations by adding Ansible and Maven plugins which add visibility into your CI/CD pipeline to help you observe automated build and deployment activities, an important aspect to ensure that your software development process is optimized. Not only can you manage performance issues in production, you now have visibility into the processes that get your code into production. The Elastic Observability team was excited to contribute these CI/CD integrations to the Ansible, Jenkins, and OpenTelemetry communities in the spirit of our free and open mantra.
Actionable observability to accelerate root cause analysis
Consolidating and visualizing your observability data is a great first step, but now it’s time to make it actionable! We introduced APM correlations allowing you to surface issues and anomalies along with related information for diagnostics. Over the course of the year we improved these capabilities, adding automated root cause analysis, powered by machine learning. This feature allows you to proactively surface application performance issues and identify potential causes with contextual details on infrastructure components, versions, locations, and custom metadata for faster troubleshooting. And with the latest release (7.16), you can perform ad hoc analysis to find the “unknown unknowns” in our RUM, Synthetics, and Mobile APM data.
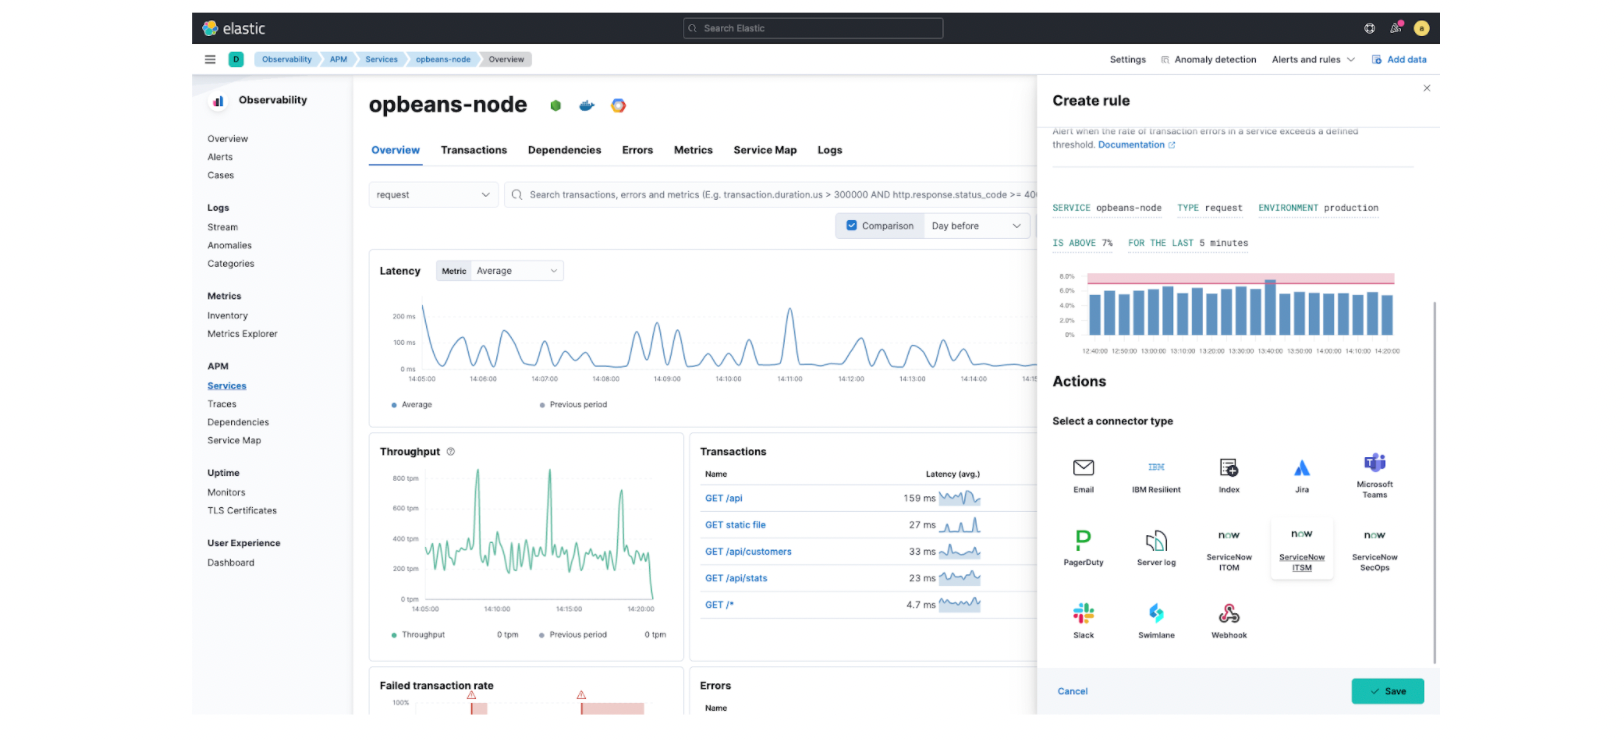
Expanding on our alerting capabilities, the recent integration with ServiceNow offers certified applications in the ServiceNow app store for ITSM and SecOps. These applications connect with Elastic alerting and case management workflows. By integrating Elastic Observability with ServiceNow (ITSM and ITOM), organizations can standardize and streamline incident management workflows and facilitate collaboration.
Phew, that was a LOT, wasn’t it? And that was just the tip of the iceberg of what you can leverage from the features we added last year. The reality is that observability solutions and platforms are always in constant growth and evolution to keep up with changing application environments, ecosystems, and tools. But we are committed to meeting the evolving needs of development, SRE, DevOps and IT teams everywhere. At the core we believe that building a full-stack observability solution on the proven and robust search platform of Elastic Stack is the future. And we are working on that future, right now.
What’s to come for Elastic Observability in 2022
What’s to come next in 2022? We can’t reveal all the surprises we have in our pipeline but we’ll be diving deeper into our real user monitoring and synthetic monitoring capabilities. And of course, bringing more machine learning capabilities to our Observability solution. We’ll have a lot more to announce shortly as Elastic Observability revs up for the 8.x release series!
シェアする
Twitter
リンクトイン
Facebook
メール
印刷

