Elastic 7.9 released, with free distribution tier of features of Workplace Search and endpoint security
We are pleased to announce the general availability of Elastic 7.9. This release brings a broad set of new capabilities to our Elastic Enterprise Search, Observability, and Security solutions, which are built on the Elastic Stack — Elasticsearch, Kibana, Logstash, and Beats. 7.9 delivers significant new capabilities to market, transforming the ways in which our customers and users onboard data into Elastic with the new Elastic Agent, launching a free distribution tier of features of Elastic Workplace Search, part of Elastic Enterprise Search, and, in Elastic Security, introducing the beta of a free distribution tier of endpoint security, featuring malware prevention directly integrated into the Elastic Stack, the first major milestone in delivering comprehensive, integrated endpoint security.
We are also continuing to improve the capabilities of Elastic Cloud, the best place to deploy the Elastic Stack and our solutions. In the last few months, we have launched support for AWS PrivateLink connectivity, achieved FedRAMP Moderate authorization, simplified buying options, and launched support for three new regions. And, of course, Elastic 7.9 is available right now on Elastic Cloud — the only managed Elasticsearch offering to include all of the new features in 7.9. Or you can download the Elastic Stack and our cloud orchestration products, Elastic Cloud Enterprise and Elastic Cloud for Kubernetes, for a self-managed experience.
This is a packed release, and we are excited to share some of the key release highlights below. To get the full feature rundown, dive into the individual solution and product blog posts, but for now, let’s dig in.
Introducing a new free way to get started with Workplace Search, part of Elastic Enterprise Search
Welcoming features of Workplace Search to our free distribution tier
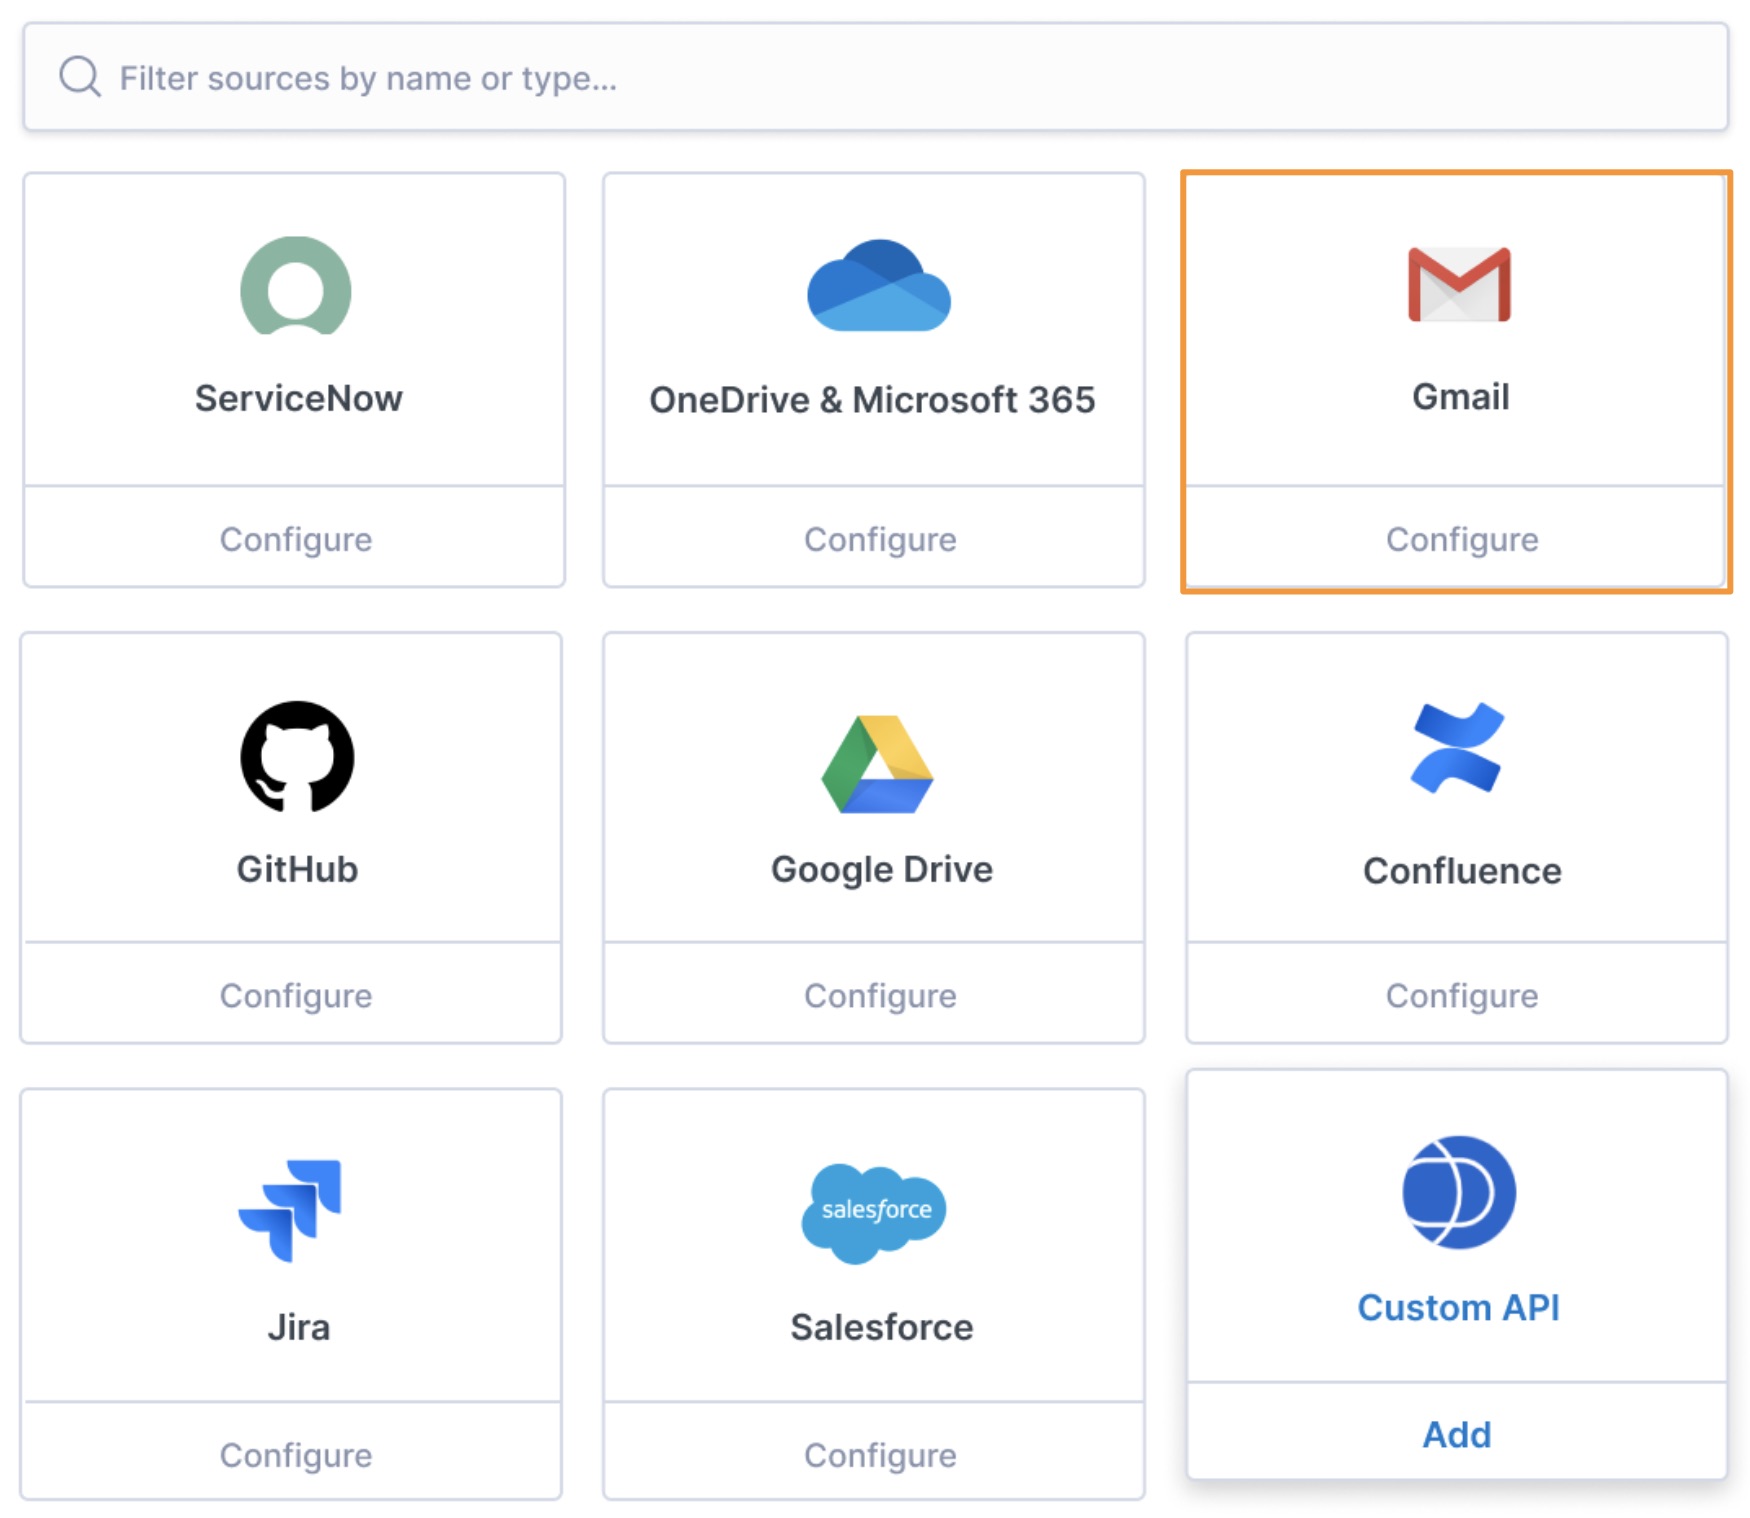
Following the general availability of Workplace Search in 7.7 and its subsequent availability in Elastic Cloud, features of Workplace Search are now available as part of the Basic free distribution tier. Get started on boosting your team’s productivity by unifying all your content platforms like Google Drive, Gmail, Salesforce, SharePoint, Jira, and more into a personalized search experience for your organization. This free tier includes connectors for all supported content sources, access to the custom API for creating your own connectors, group and user management features, and tools for building modern search user experiences.
Workplace Search is available for free, with additional features available with Platinum or Enterprise subscriptions. Workplace Search can be used on Elastic Cloud or can be deployed as a self-managed option on your own infrastructure with the Elastic Stack.
Viewing Elastic Enterprise Search through Kibana
As the window into the Elastic Stack, Kibana allows users to take data from any source, in any format, and search, analyze, and visualize that data in real time. Elastic Enterprise Search is now available in Kibana to provide users with easy navigation to App Search and Workplace Search from a familiar starting point. With this release, Kibana admins can customize spaces to show or hide Elastic Enterprise Search in the main navigation menu. In this release, App Search users can access all their engines and meta engines from Kibana, while Workplace Search users can access user management and content source synchronization tooling.
Supercharging email searching capabilities with Gmail support in Workplace Search
Email is the central hub of business communication, and a huge proportion of our daily insights gets siloed into email archives over time. With 7.9, Workplace Search supports Gmail as a connector. Each individual Gmail user can easily use the clean, intuitive Workplace Search user interface to search within their own email and see results right alongside all their other content sources.
Giving more control and automation over scaling your deployments, plus new insight from source activity logs
Because Elastic Enterprise Search is built on the Elastic Stack, powerful features can be pulled into App Search and Workplace Search based on user needs. In 7.9, App Search and Workplace Search inherit index lifecycle management (ILM) policies from the Elastic Stack. Users can configure ILM policies to automatically manage indexes (engines) according to user requirements. Examples include: creating a new index once it reaches a predefined size; creating or archiving an index each day, week, or month; and deleting indices based on data retention rules. Create and manage ILM policies directly inside App Search.
Get a scoop on all of the new Elastic Enterprise Search features in the Elastic Enterprise Search 7.9 blog.
Delivering a single unified agent with one-click data ingestion
Ingesting data for observability gets a lot simpler with Elastic Agent and Ingest Manager
Onboarding data is a critical — and often time-consuming and tedious — step in observability workflows. How quickly can we go from deciding to monitor a system to actually monitoring the system? How easy is it to instrument the system? Is the collected data parsed and structured to be usable? How quickly can we visualize and glean key insights from the data? Now multiply this by the thousands of components in your technology stack — servers, VMs, containers, applications, databases, middleware, etc. — and the operational aspects become critical.
We are excited to introduce a dramatically simplified data onboarding and ingest management workflow with the launch of several new ingest capabilities in 7.9. Our goal with this initiative is to streamline the entire ingest process so that operators can spend more time acting on insights and less time setting and managing their ingest process. The Elastic Agent, in beta in 7.9, is a single, unified way to collect all kinds of data from a host, including logs, metrics, and endpoint security data, with plans to expand to APM and other data types in the future. Having a single agent to install, configure, update, and maintain is a huge efficiency boost for operators. Ingest Manager, which is also in beta in 7.9, controls all aspects of your ingest universe from a central place. Add and manage integrations for popular services and platforms: we plan to port all 100+ Beats modules over the next few releases. Finally, you can centrally manage all your agents with Fleet — the control tower for all deployed agents. A typical enterprise will usually have agents deployed on tens of thousands of hosts, and Fleet makes it easy for operators to manage this spread from a single place.
Enhancing analyst experience with a unified observability overview page
Unification of the three data pillars of observability — logs, metrics, and traces — at the data layer is one of the features that sets Elastic Observability apart. Having all the data in a single datastore is essential to supporting investigative workflows that seamlessly move between data streams to speed mean time to resolution.
Building on this unified data foundation, we are excited to extend unification to the visualization layer with the launch of a new observability overview page in Kibana. The overview page bubbles up key information across all your observability data — logs, metrics, APM, uptime — and presents a curated at-a-glance view of the health of your entire ecosystem. This out-of-the-box view helps you get to insights faster — especially for new users or new deployments. The overview page includes a newsfeed that keeps you informed of product updates and news.
Embracing open standards with OpenTelemetry integration in Elastic APM
From open code to open community, Elastic is built on openness and transparency. That mindset extends to our support for open standards in the observability space, such as OpenTracing, Jaeger, and W3C Trace-Context. We are happy to add the recently formed OpenTelemetry standard to that list. OpenTelemetry is a Cloud Native Computing Foundation (CNCF) sandbox project, currently in beta, that provides vendor-neutral, language-specific agents, SDKs, and APIs to collect distributed traces, metrics, and log data from monitored applications. We have added the Elastic APM exporter (and contributed it to the OpenTelemetry collector contrib repo), which takes the trace data collected using the OpenTelemetry collector, translates it to Elastic-compatible protocol, and sends it to Elastic APM. This means that you can start exploring your OpenTelemetry using Elastic APM without any changes to your instrumentation. Just add the Elastic exporter, currently in beta, into your OpenTelemetry setup and start exploring your data in minutes.
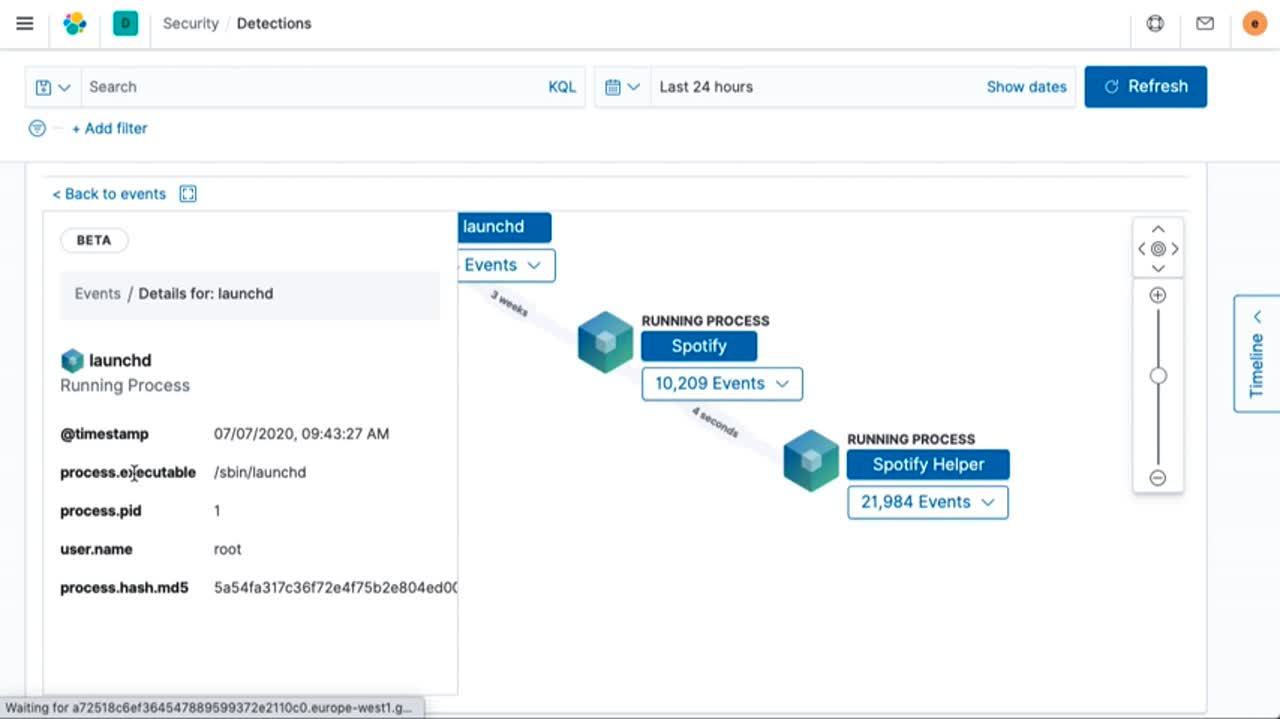
Strengthening ties between DevOps and SecOps with 50+ turnkey detection rules
While you observe, why not protect? Logs, metrics, and traces from applications and infrastructure collected by observability teams are a rich source of information for security teams. The benefit of having Elastic Security and Elastic Observability sit on top of the same Elasticsearch data is that you can ask different questions of the same data without duplicating it across tools. Elastic caters to the needs of both SecOps and DevOps teams, fostering collaboration. Our unified resource-based pricing means that adding different lenses to the same data doesn’t come at an additional cost.
In 7.9, we are strengthening the bond between Elastic Security and Elastic Observability even more with the beta launch of over 50 turnkey detection rules that allow both DevOps teams and security analysts to benefit from insights for hundreds of services and systems in minutes — with no extra work or cost. And of course, with the flexible detection engine you are welcome to create additional rules to fit your environment.
Dive deeper in all the new features in the Elastic Observability 7.9 blog.
Introducing a free distribution tier of one-click endpoint security, built into Elastic Security
Stopping attacks on your endpoints with integrated malware prevention
We are excited to introduce the first major milestone in delivering comprehensive, integrated endpoint security — free anti-malware capabilities (beta), built directly into Elastic Security, furthering our mission to help secure organizations around the world. Elastic blocks malware from Windows and macOS hosts with signatureless methods recently validated by AV-Comparatives, and detects threats with MITRE ATT&CK®-aligned rules for Windows, macOS, and Linux hosts.
Enhancing your cloud security posture
Our security research team has added prebuilt protections for monitoring cloud infrastructure and identity and access management technologies. These prebuilt machine learning jobs (GA) and threat detection rules (beta) enable customers to detect attacks against cloud infrastructure and applications and are aligned with the ATT&CK Matrix.
Unifying prevention, detection, and response with community-driven workflow enhancements
Elastic Security 7.9 delivers several workflow enhancements that equip analysts to efficiently triage, hunt, investigate, and respond to attacks. New built-in investigation guides help analysts understand which questions to ask when opening a specific type of alert, and customizable timeline templates optimize data presentation to enable faster insights.
An efficient workflow for adding exceptions to detection and endpoint rules helps eliminate overhead associated with minimizing false positives. And a new integration with IBM Resilient streamlines incident response workflows, within the security team and beyond.
Simplifying data ingestion with expanded data integrations
Version 7.9 introduces support for many new host and cloud data sources, including Microsoft Defender ATP, Windows PowerShell, and Google G Suite. These integrations support security operations, DevSecOps, and other common use cases. We are also introducing support for more than 20 common network and application security technologies.
Get all the details in the Elastic Security 7.9 blog.
Introducing instant page loads in Kibana
Delivering instant page loads in Kibana for faster navigation and more natural workflows
For more than 18 months, we've been overhauling the engine at the heart of Kibana. In 7.9, we've completed that work and migrated all of Kibana’s underlying architecture. The immediate benefit is a dramatically faster experience when navigating Kibana. Flipping from APM to Dashboard to Maps to SIEM is now an instantaneous experience that helps keep you in the flow — whether you are supporting mission-critical systems, protecting against security threats, or building data analyses. Beyond this improved user experience, the new architecture also means big improvements for the Kibana development community with the ability to produce features faster, with greater efficiency resulting in higher-quality code.
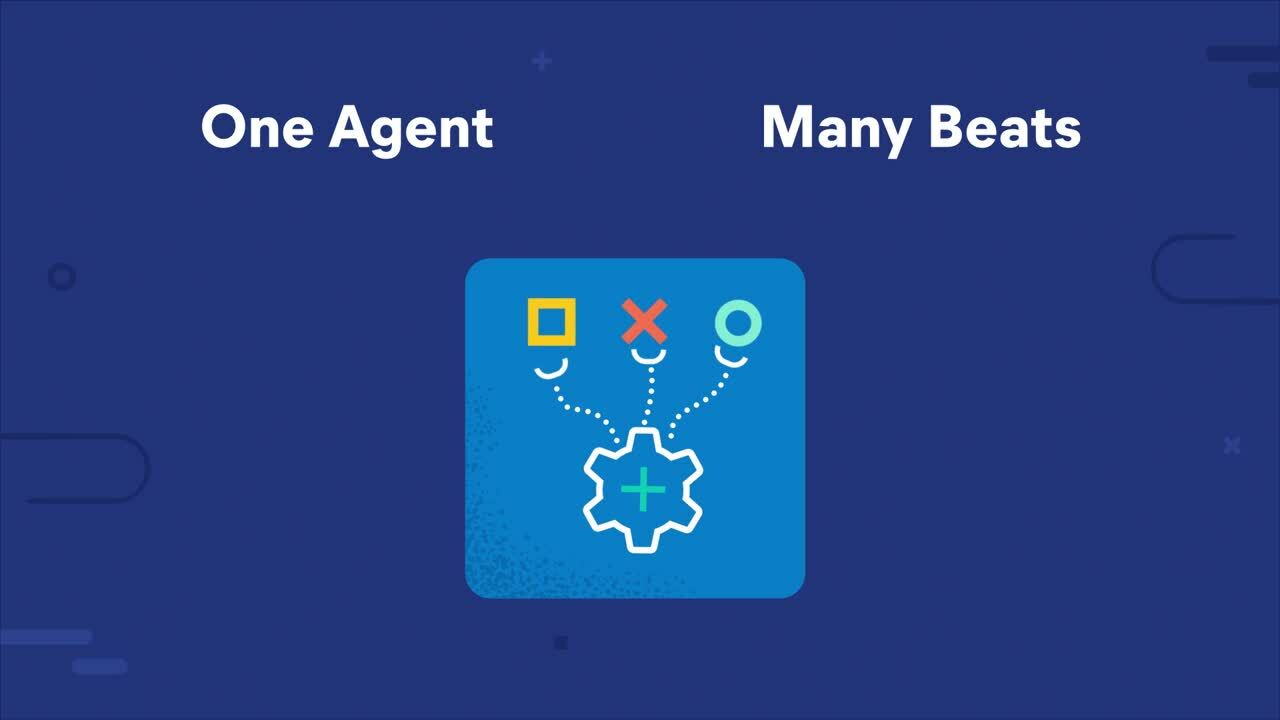
Simplifying data ingestion with Elastic Agent
Building on the foundation of Beats, lightweight data shippers that help get data into Elasticsearch, we are introducing “one Beat to rule them all,” the new Elastic Agent, which is in beta in 7.9. Instead of installing multiple Beats on a host, users can now install a single Elastic Agent, which brings together the necessary components for metric collection, logging, malware prevention, and more. Better yet, users can centrally manage thousands of agents with a new feature called Fleet. These enhanced capabilities are housed in the new Ingest Manager in Kibana. Whether monitoring cloud infrastructure or configuring thousands of endpoints, we expect these new features to make setup faster and steady state operations easier — and this is only the beginning of our journey.
Enhancing search with a new wildcard data type
Sometimes you only know half of what you’re searching for. Especially in use cases across observability and security, the wildcard operator delivers more powerful searches. Logs often contain lengthy strings without spaces, and consist of standard repeating sections and changing information (e.g., names, duration, IP addresses, etc.). Enter the wildcard data type. To be able to search such strings efficiently, with high performance and low index size, we split them into three letter tokens and apply the same technique to the query. This method allows us to introduce wildcard and regex support in our searches without compromising performance. Designed to dramatically reduce the time it takes to find what you’re searching for when using the wildcard operator, the wildcard data type will be especially useful for security analysts using our Elastic Security solution as they hunt for threats.
Offering a preview of Event Query Language (EQL) in Elasticsearch
At Elastic, we've had requests for many years to introduce a correlation query language to support threat hunting and detection security use cases. When we joined forces with Endgame late last year, we inherited the Event Query Language (EQL), a powerful, battle-tested language designed for this purpose. It has been running efficiently on endpoints blocking threats in Endgame solutions for years. In 7.9, we're excited to release our first public preview of EQL, a first-class query language in Elasticsearch, as an experimental feature. We're releasing it today as an API in Elasticsearch, and we have plans to incorporate a robust UI for EQL in Elastic Security and Kibana in the future. We'd love your feedback and your creativity — EQL was designed for security, but we expect it will open many new ways to use Elasticsearch.
Read about these features and more in the Kibana 7.9 blog and the Elasticsearch 7.9 blog.
Enhancing security on Elastic Cloud with support for AWS PrivateLink
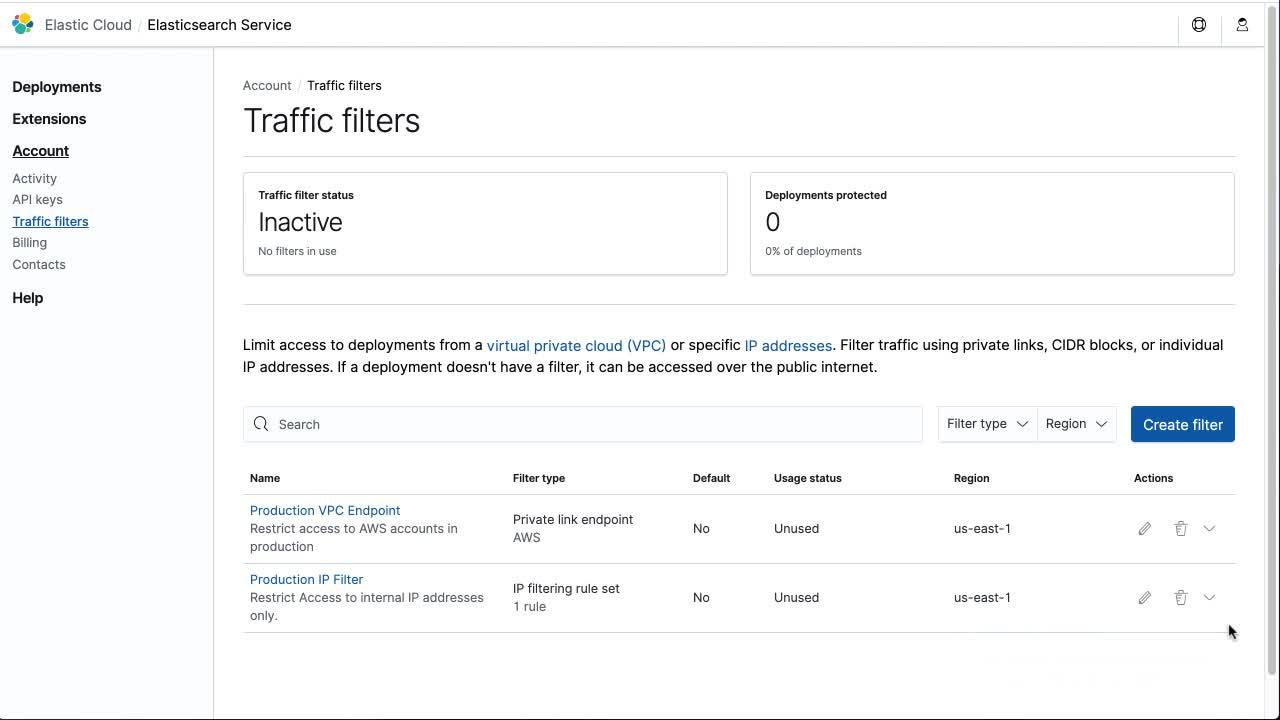
Enhancing security and compliance with AWS PrivateLink support, IP filtering, support for Google credentials, and FedRAMP authorization
We have also launched support for AWS PrivateLink, which provides private network connectivity between your AWS virtual private clouds (VPCs) and Elastic Cloud. We have also launched support for IP filtering across public cloud providers, enabling you to specify network access to your Elastic Cloud deployment based on IP addresses, address blocks, or ranges. We have also added support for Google Accounts, so that you can sign up for Elastic Cloud using your existing Google Account credentials. With a couple of clicks, you can use your Google identity to access your Elastic Cloud account instead of maintaining separate credentials.
In addition, the Elastic Cloud AWS GovCloud US East region is designated authorized for FedRAMP Moderate. Federal, state, and local government users, as well as higher education institutions and users with government data, can start a free trial today!
Supporting more flexible buying options with self-service monthly premium subscriptions and new regions
You can now purchase Gold and Platinum monthly subscriptions directly within the Elastic Cloud console. With just a few clicks, you’ll get access to support SLAs and the exclusive capabilities of the Elastic Stack, including our solutions for enterprise search, observability, and security. We’ve also added more regions across multiple cloud service providers, so you can access Elastic Cloud in more locations, including Canada Central, Paris, and Seoul. Our AWS GovCloud region is also now generally available.
Improving service performance with in-place configuration changes and new AWS instance types
In-place configuration changes allow for faster and more reliable configuration updates. Their speed and reliability come from applying changes to the cluster (like settings, upgrades, and resizing) in place, which is followed by a rolling restart of nodes — avoiding potentially long-running data migration operations. We have also launched support for Amazon EC2 M5d general purpose and R5d memory-optimized instances in all supported AWS regions on Elastic Cloud. M5d instances provide a balance of compute, memory, and networking resources, while R5d instances are designed to deliver fast performance when processing large data sets in memory.
Supporting new self-managed capabilities with Elastic Cloud Enterprise 2.6 and Elastic Cloud on Kubernetes 1.2
We are pleased to announce the general availability of Elastic Cloud Enterprise 2.6. Elastic Cloud Enterprise lets customers centrally orchestrate a fleet of Elasticsearch clusters using the same capabilities that Elastic uses to run Elastic Cloud. With the 2.6 release, Elastic Cloud Enterprise adds support for the Elastic Cloud Control (ecctl) CLI, management of the new unified Elastic Enterprise Search including support for our new Workplace Search capabilities, and in-place configuration changes.
We are also pleased to announce the general availability of Elastic Cloud on Kubernetes 1.2. Elastic Cloud on Kubernetes simplifies setup, upgrades, snapshots, scaling, high availability, security, and more for running Elasticsearch and Kibana in Kubernetes. The new 1.2 version lets you easily deploy and orchestrate Elastic Enterprise Search, allowing you to launch an instance of App Search or Workplace Search and connect it to an Elasticsearch cluster with just a few lines of YAML configuration. The new 1.2 version also lets you take advantage of the new Beats Custom Resource Definition (CRD) to deploy and manage data shippers such as Filebeat, Metricbeat, Auditbeat, and others using ECK.
To get caught up on all of the Elastic Cloud news, check out the What’s New In Elastic Cloud blog.
There’s always more...
So much more. Check out the individual solution and product blog posts for the details on everything we added in 7.9:
Elastic Solutions
- What's New in Elastic Enterprise Search 7.9.0
- What's New in Elastic Observability 7.9.0
- What's New in Elastic Security 7.9.0