How Universal Profiling unwinds stacks without frame pointers and symbols

 Share on Twitter
Share on Twitter

 Share on LinkedIn
Share on LinkedIn

 Share on Facebook
Share on Facebook

 Share by Email
Share by Email

 Print this page
Print
Elastic Universal ProfilingTM , a continuous profiling product, is based on technology that came into Elastic as part of the acquisition of optimyze.cloud — a startup that had developed Prodfiler.com, the world’s first frictionless fleet-wide in-production multi-runtime profiler that was launched in August 2021.
In order to bring the vision of frictionless deployability, low performance overhead, “just run it everywhere” magic to the broader market, a number of technical innovations were necessary. In this blog post, we will discuss one of the more important ones: how to unwind stacks without frame pointers and symbols.
[Related article: Elastic Universal Profiling™ helps you deliver fast, affordable, and efficient services]
How a sampling profiler works
A sampling profiler instructs the operating system to be run “periodically,” usually N times per second (in our case, 20 times per second per core). Each time the profiler gets control, it performs a “stack walk”: Starting from the location where the CPU core is currently executing, it analyzes the call stack in order to identify the code path that was taken to get to the currently executing instruction.
The profiler thus tries to answer the questions of “Where are we currently spending our time?” and “How did we get here?”
In ancient prehistory, performing such a stack walk was easy (see next section) — but then, a combination of compiler optimizations and idiosyncrasies of the x86 architecture made it very difficult.
A simple textbook stack walk
In ancient prehistory, compilers for x86 architectures would emit a “standard function prologue,” consisting of the following assembly instructions:
push ebp
mov ebp, esp
sub esp, sizeof(local variables)
For people not fluent in 32-bit x86 assembly, the effect of this is illustrated in the following diagram:
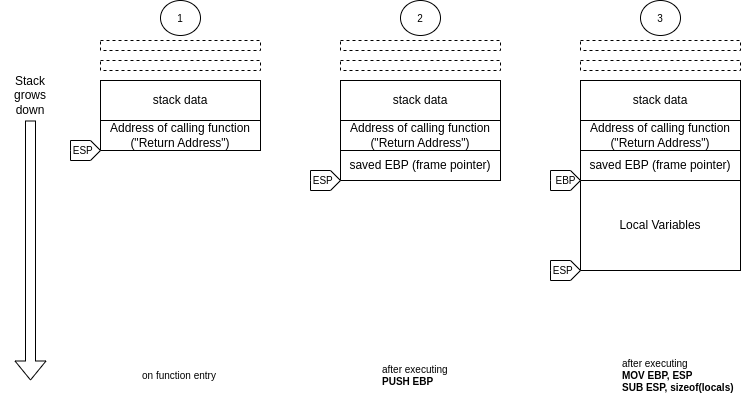
On function entry, the CPU’s stack pointer register (ESP) points to the address at which the CPU has stored the “return address” which is an address inside the calling function (think the precise location in the code where the call to the current function is made).
The CPU has a second register, called the “frame pointer” or “base pointer” (EBP). When the first instruction is executed (PUSH EBP), the CPU places the contents of this register on the stack, adjusting ESP accordingly.
Subtracting the size of the local variables from ESP then “allocates room for the function’s local variables” — it reserves space where the function can store and manipulate data. Releasing this memory is as simple as restoring the pre-subtraction value again (MOV ESP, EBP).
In this scenario, the code inside a function can access the local variables by using negative offsets from EBP, and EBP can be thought of as “the pointer to the local variables.”
More importantly for our discussion, though, is the fact that EBP can be used to retrieve both the stored EBP (“saved EBP” in the diagram) and the address (“return address” in the diagram) of the calling function.
In a scenario where you have one function that calls a different function that calls yet another function, the standard function prologue (the three discussed assembly instructions) make sure that there is a singly linked list of all the local variables of each function, and by following the pointers starting at EBP, one can recover…
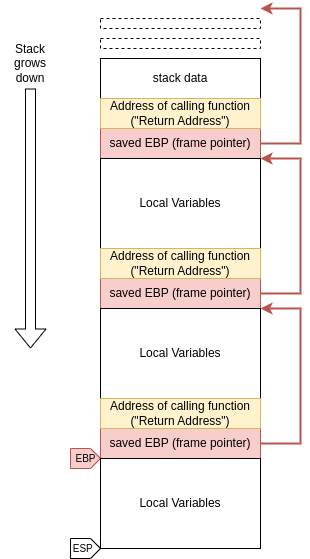
… the sequence of return addresses all the way to the start of the program (highlighted in yellow).
This is what is commonly known as “unwinding or walking the stack,” and it is what the eBPF helper functions in the Linux Kernel provide for you. Most profilers that use eBPF use these helper functions. We do not (for userspace code), and the reason for this is described in the next section.
[Related article: A look under the hood at eBPF: A new way to monitor and secure your platforms]
The problem of omitted frame pointers
The 32-bit x86 architecture was often ridiculed by developers on more RISC-y designs for its extremely small “register set.” CPU registers are tiny areas of memory that usually hold only one value that can be accessed extremely rapidly — think of it as “the place that is faster than even level-1-cache.”
The 32-bit x86 architecture had only eight general-purpose registers (called EAX, EBX, ECX, EDX, ESI, EDI, EBP, ESP). This was very tight because once you use ESP for the stack and EBP for the frame, you are left with only six registers to perform calculations in. Compare this to the Motorola 68k (the CPU that the original Apple Macintosh and the popular Amiga used, both released in 1984 or 1985), which had more than twice that number.
Compiler engineers soon realized that — as compilers got more powerful and smarter — using EBP as a frame pointer was not always necessary. Smarter compilers could keep track of the location of ESP throughout the code, and instead of referring to local variables as “EBP - 0xXX,” they could use “ESP + 0xYY.”
Obtaining an extra register equated to 16% more registers (going from six to seven), with a performance boost that was almost commensurate (10% for many workloads). Which compiler wouldn’t want to do it?
This is how “frame pointer omission” became a standard compiler optimization and enabled in all C/C++ toolchains by default over the years.
The general assumption was that trading off the ability to walk the stack without debug symbols in return for 10%–16% more performance was well worth it. For people who needed to debug their production binaries, the assumption was that they would have access to debug symbols — special files (or section of files) with additional data that would help keep track of the precise position of ESP relative to the function entry, thus permitting stack unwinding and local variable inspection.
“It’s OK to trade off stack unwinding for speed — why would anyone want to unwind the stack without debug symbols anyhow?” was the dominant logic.
The downside, of course, was that this broke profiling almost everywhere, as sampling profilers were no longer able to unwind native stacks through third-party libraries. This meant that even if you compiled your own code with frame pointers, as soon as you’d call into any library (for example, libc to call malloc), your profiler would fail to properly identify how you reached the code you were executing.
Workarounds for frame pointer omission
As a result of the small x86 register set, all major Linux distributions ship all their default libraries and all their upstream packages compiled with frame-pointer-omission. This breaks simple stack walking for profiling, and in general the recommendations in the performance analysis community have been either:
- “Just recompile your upstream libraries without frame pointer omission”
- “Make sure you have debug symbols deployed on the machines where you do the profiling”
Neither option makes for a good user experience when it comes to profiling; very few organizations have the cycles to recompile upstream libraries, and debug symbols can be hundreds of megabytes (or even gigabytes) and clumsy to manage in production systems.
We needed a better solution.
Our 2019 epiphany: Use C++ exception handling data from eBPF
The Optimyze founding team mainly came from the security community, which has a long history of spending a lot of time staring at executable headers and disassemblies. As we started working on our first prototypes of what would become Prodfiler, we realized that everybody had been overlooking a source of data that would enable frictionless in-production profiling-focused stack unwinding without debug symbols or recompilation: C++ exception handling data.
In order for C++ to handle exceptions gracefully, the C++ code needs to be able to “throw” an exception — and then walk upward on the stack until a potential exception handler is found.
In order to facilitate this language feature, the compiler/linker engineers decided to add some limited form of stack unwinding information to C++ executables — but in order to facilitate interoperability between C and C++ code (for example, to allow a C library to call into a C++ library that might throw an exception, and to pass that exception through to callers of the C library), the compiler/linker would emit this data even for non-C++ projects.
Everyone had overlooked that the data required to perform stack unwinding in a profiler in production had been widely present in everybody’s production infrastructure.
How Prodfiler pioneered .eh_frame unwinding
We set to work, and a few months later we had a working prototype that performed full stack unwinding without any symbols. The experience is magical: You can just drop the agent on any Linux machine running one of the major distributions, and you get system-wide profiling of everything, and unwinding through third-party libraries just magically works.
The data inside .eh_frame is in the DWARF debug symbol format — a fantastically powerful format (it includes a full bytecode interpreter, since it needs to work on pretty much any imaginable CPU architecture) that is at the same time slow and cumbersome to work with, especially from eBPF.
In order to deal with this, we settled on a relatively simple architecture: Our eBPF code would notice when it encountered an executable (or shared object) that was compiled without frame pointers and send a notice to our userspace agent. The userspace agent then opens the relevant executable, reads the .eh_frame section, converts the data into a much more manageable (and faster-to-access) data structure, and provides it to the kernel code via eBPF maps. The next time the eBPF code encounters the same executable, it will have all the information it needs to walk the stack already in kernel space, so rapid unwinding would be easy to do.
We got to work making the prototype production-ready and by February 2021, we were running it in the first larger production environments (10k+ cores). By August 2021, we had launched the product as a public self-service beta and by November 2021, we had joined Elastic.
Stay tuned for the next post in this blog series, where we dive into the details on how we made everything work in eBPF for all Linux kernels 4.15 or higher! Until then, feel free to learn more about Elastic’s implementation of Universal Profiling as part of our full-stack observability solution.
Share
- Share on Twitter
Share on Twitter
- Share on LinkedIn
Share on LinkedIn
- Share on Facebook
Share on Facebook
- Share by Email
Share by Email
- Print this page
Print