Getting AWS logs from S3 using Filebeat and the Elastic Stack
Logs from a variety of different AWS services can be stored in S3 buckets, like S3 server access logs, ELB access logs, CloudWatch logs, and VPC flow logs. S3 server access logs, for example, provide detailed records for the requests that are made to a bucket. This is very useful information, but unfortunately, AWS creates multiple .txt files for multiple operations, making it difficult to see exactly what operations are recorded in the log files without opening every single .txt file separately. Additionally, S3 server access logs are recorded in a complex format, making it very hard for users to just open the .txt file and find the information they need.
Fortunately, all of your AWS logs can be easily indexed, analyzed, and visualized with the Elastic Stack, letting you utilize all the important data they contain. In this blog, we’ll take a look at just how easy it is.
Introduction
In Filebeat 7.4, s3 input became an option for users, allowing them to retrieve events from files in an S3 bucket, with each line from each file becoming a separate event. Along with s3 input, we also shipped two new filesets for the Filebeat AWS module: the s3access fileset and elb fileset (new in 7.5). With these, users can collect logs from different S3 buckets, and then visualize and analyze them in a centralized location without downloading or manually opening each file.
To avoid significant lagging with polling all log files from each S3 bucket, we decided to combine notification and polling: use Amazon Simple Queue Service (SQS) for Amazon S3 notification when a new S3 object is created. The Filebeat s3 input checks SQS for new messages regarding the new object created in S3 and uses the information in these messages to retrieve logs from S3 buckets. With this setup, periodic polling from each S3 bucket is not needed. Instead, the Filebeat s3 input guarantees near real-time data collection from S3 buckets with both speed and reliability.
Configuring S3 event notifications using SQS
By following these four steps, users can add a notification configuration on a bucket requesting AWS S3 to publish events of the s3:ObjectCreated:* type to an AWS SQS queue. Please see configure a bucket notification example walkthrough for more details.
Step 1: Create an SQS queue and S3 bucket
Create an SQS queue and an S3 bucket in the same AWS region using Amazon SQS console.
Step 2: Configure an SQS queue
Replace the access policy attached to the queue with the following queue policy:
{
 "Version": "2012-10-17",
 "Id": "example-ID",
 "Statement": [
  {
   "Sid": "example-statement-ID",
   "Effect": "Allow",
   "Principal": {
    "AWS":"*"
   },
   "Action": [
    "SQS:SendMessage"
   ],
   "Resource": "<SQS-queue-ARN>",
   "Condition": {
      "ArnLike": { "aws:SourceArn": "arn:aws:s3:*:*:<bucket-name>" }
   }
  }
 ]
}
Make sure to change the <sqs-queue-arn> and <bucket-name> to match your SQS queue arn and S3 bucket name.
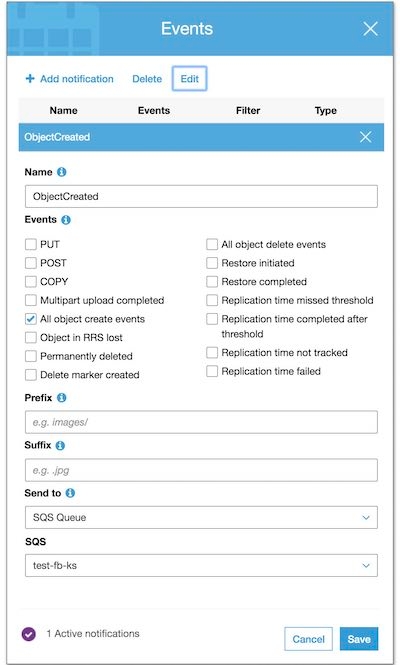
Step 3: Configure S3 bucket
Using the Amazon S3 console, add a notification configuration requesting Amazon S3 to publish
events of the
s3:ObjectCreated:* type to your Amazon SQS queue.
Step 4: Test S3-SQS setup
Upload an object to the S3 bucket and verify the event notification in the Amazon SQS console.
Using the Filebeat s3 input
By enabling Filebeat with s3 input, users will be able to collect logs from AWS S3 buckets. Every line in each log file will become a separate event and will be stored in the configured Filebeat output, like Elasticsearch. Using only the s3 input, log messages will be stored in the message field in each event without any parsing.
When processing an S3 object referenced by an SQS message, if half of the configured visibility timeout passes and the processing is still ongoing, then the visibility timeout of that SQS message will be reset to make sure the message does not go back to the queue in the middle of the processing. If there are errors happening during the processing of the S3 object, then the process will be stopped and the SQS message will be returned back to the queue.
Step 0: Create an IAM policy
An IAM policy is an entity that defines permissions to an object within your AWS environment. Creating a customized IAM policy for Filebeat with specific permissions is needed. Please see Creating IAM Policies for more details. Here is a list of permissions required for accessing SQS and S3:- s3:GetObject
- sqs:ReceiveMessage
- sqs:ChangeMessageVisibility
- sqs:DeleteMessage
Step 1: Install Filebeat
To download and install Filebeat, there are different commands working for different systems. For example, with Mac:
curl -L -O https://artifacts.elastic.co/downloads/beats/filebeat/filebeat-7.5.1-darwin-x86_64.tar.gz
tar xzvf filebeat-7.5.1-darwin-x86_64.tar.gz
Please see Install Filebeat for more details.
Step 2: Configure the s3 input
Here is an example of enabling s3 input in filebeat.yml:
filebeat.inputs:
- type: s3
  queue_url: https://sqs.us-east-1.amazonaws.com/1234/test-fb-ks
  visibility_timeout: 300s
  credential_profile_name: elastic-beats
With this configuration, Filebeat will go to the test-fb-ks AWS SQS queue to read notification messages. From the messages, Filebeat will obtain information about specific S3 objects and use the information to read objects line by line. visibility_timeout is the duration (in seconds) that the received messages are hidden from subsequent retrieve requests after being retrieved by a ReceiveMessage request. By default, the visibility_timeout is 300 seconds. The minimum is 0 seconds and the maximum is 12 hours. In order to make AWS API calls, s3 input requires AWS credentials in its configuration. In the example above, profile name elastic-beats is given for making AWS API calls. Please see AWS Credentials Configuration for more details.
Step 3: Start Filebeat
For Mac and Linux:
sudo chown root filebeat.yml
sudo ./filebeat -e
Please see Start Filebeat for more details.
Collecting S3 server access logs using the s3access fileset
In Filebeat 7.4, the s3access fileset was added to collect S3 server access logs using the s3 input. Server access logs provide detailed records for the requests that are made to a bucket, which can be very useful in security and access audits. By default, server access logging is disabled. To track requests for access to your bucket, you can enable server access logging. Each access log record provides details about a single access request, such as the requester, bucket name, request time, request action, response status, and an error code, if relevant.
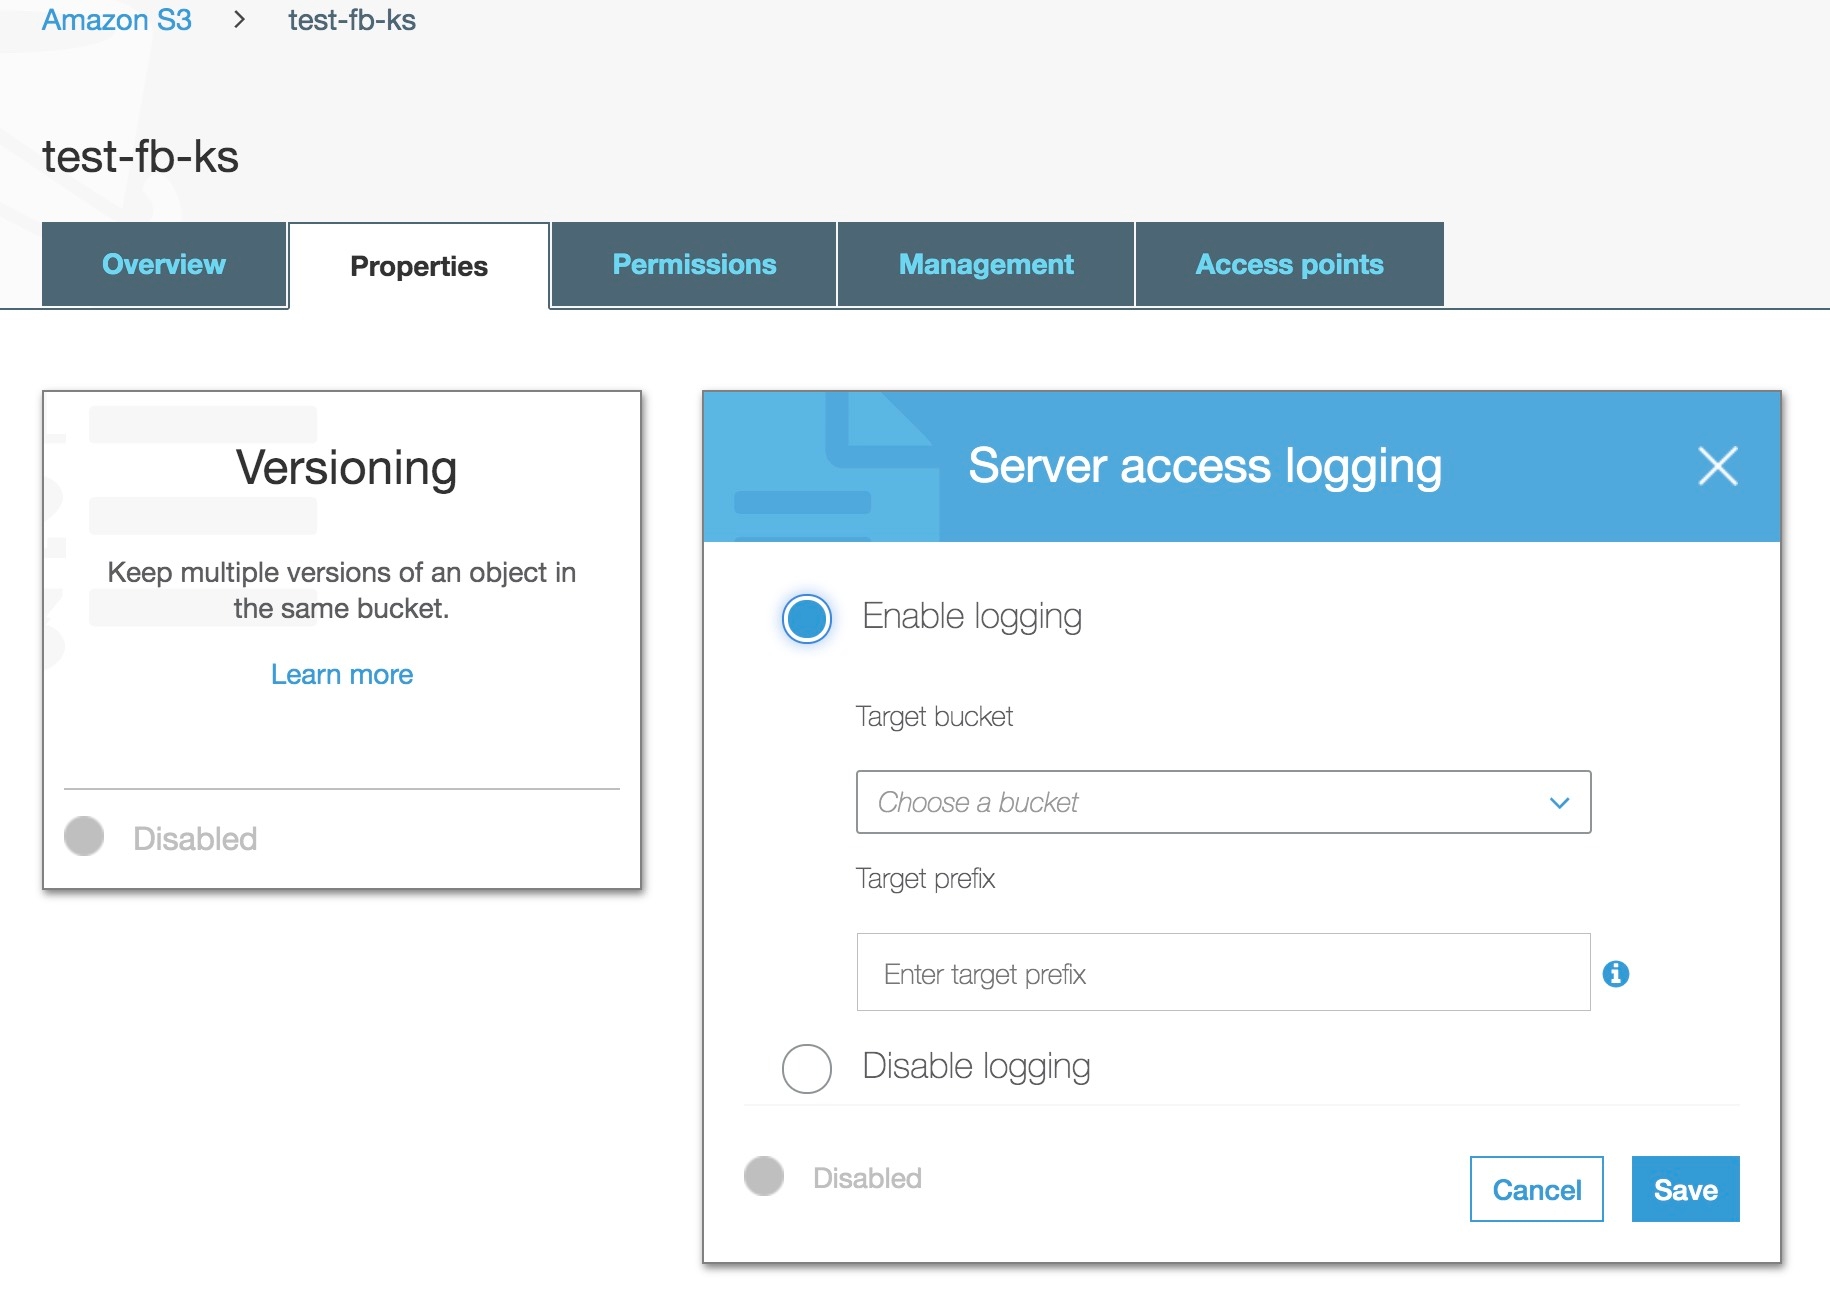
Step 1: Enable server access logging
Under Properties in a specific S3 bucket, you can enable server access logging by selecting Enable logging:
Step 2: Enable aws module in Filebeat
In a default configuration of Filebeat, the aws module is not enabled. The following command enables the aws module configuration in the modules.d directory on MacOS and Linux systems:
sudo ./filebeat modules enable aws
Step 3: Configure aws module
By default, the s3access fileset is disabled. To enable the s3access fileset, please see aws.yml below:
- module: aws
  s3access:
    enabled: true
    var.queue_url: https://sqs.myregion.amazonaws.com/123456/myqueue
    var.credential_profile_name: fb-aws
Step 4: Start Filebeat
For Mac and Linux:
sudo chown root filebeat.yml
sudo ./filebeat -e
Please see Start Filebeat for more details.
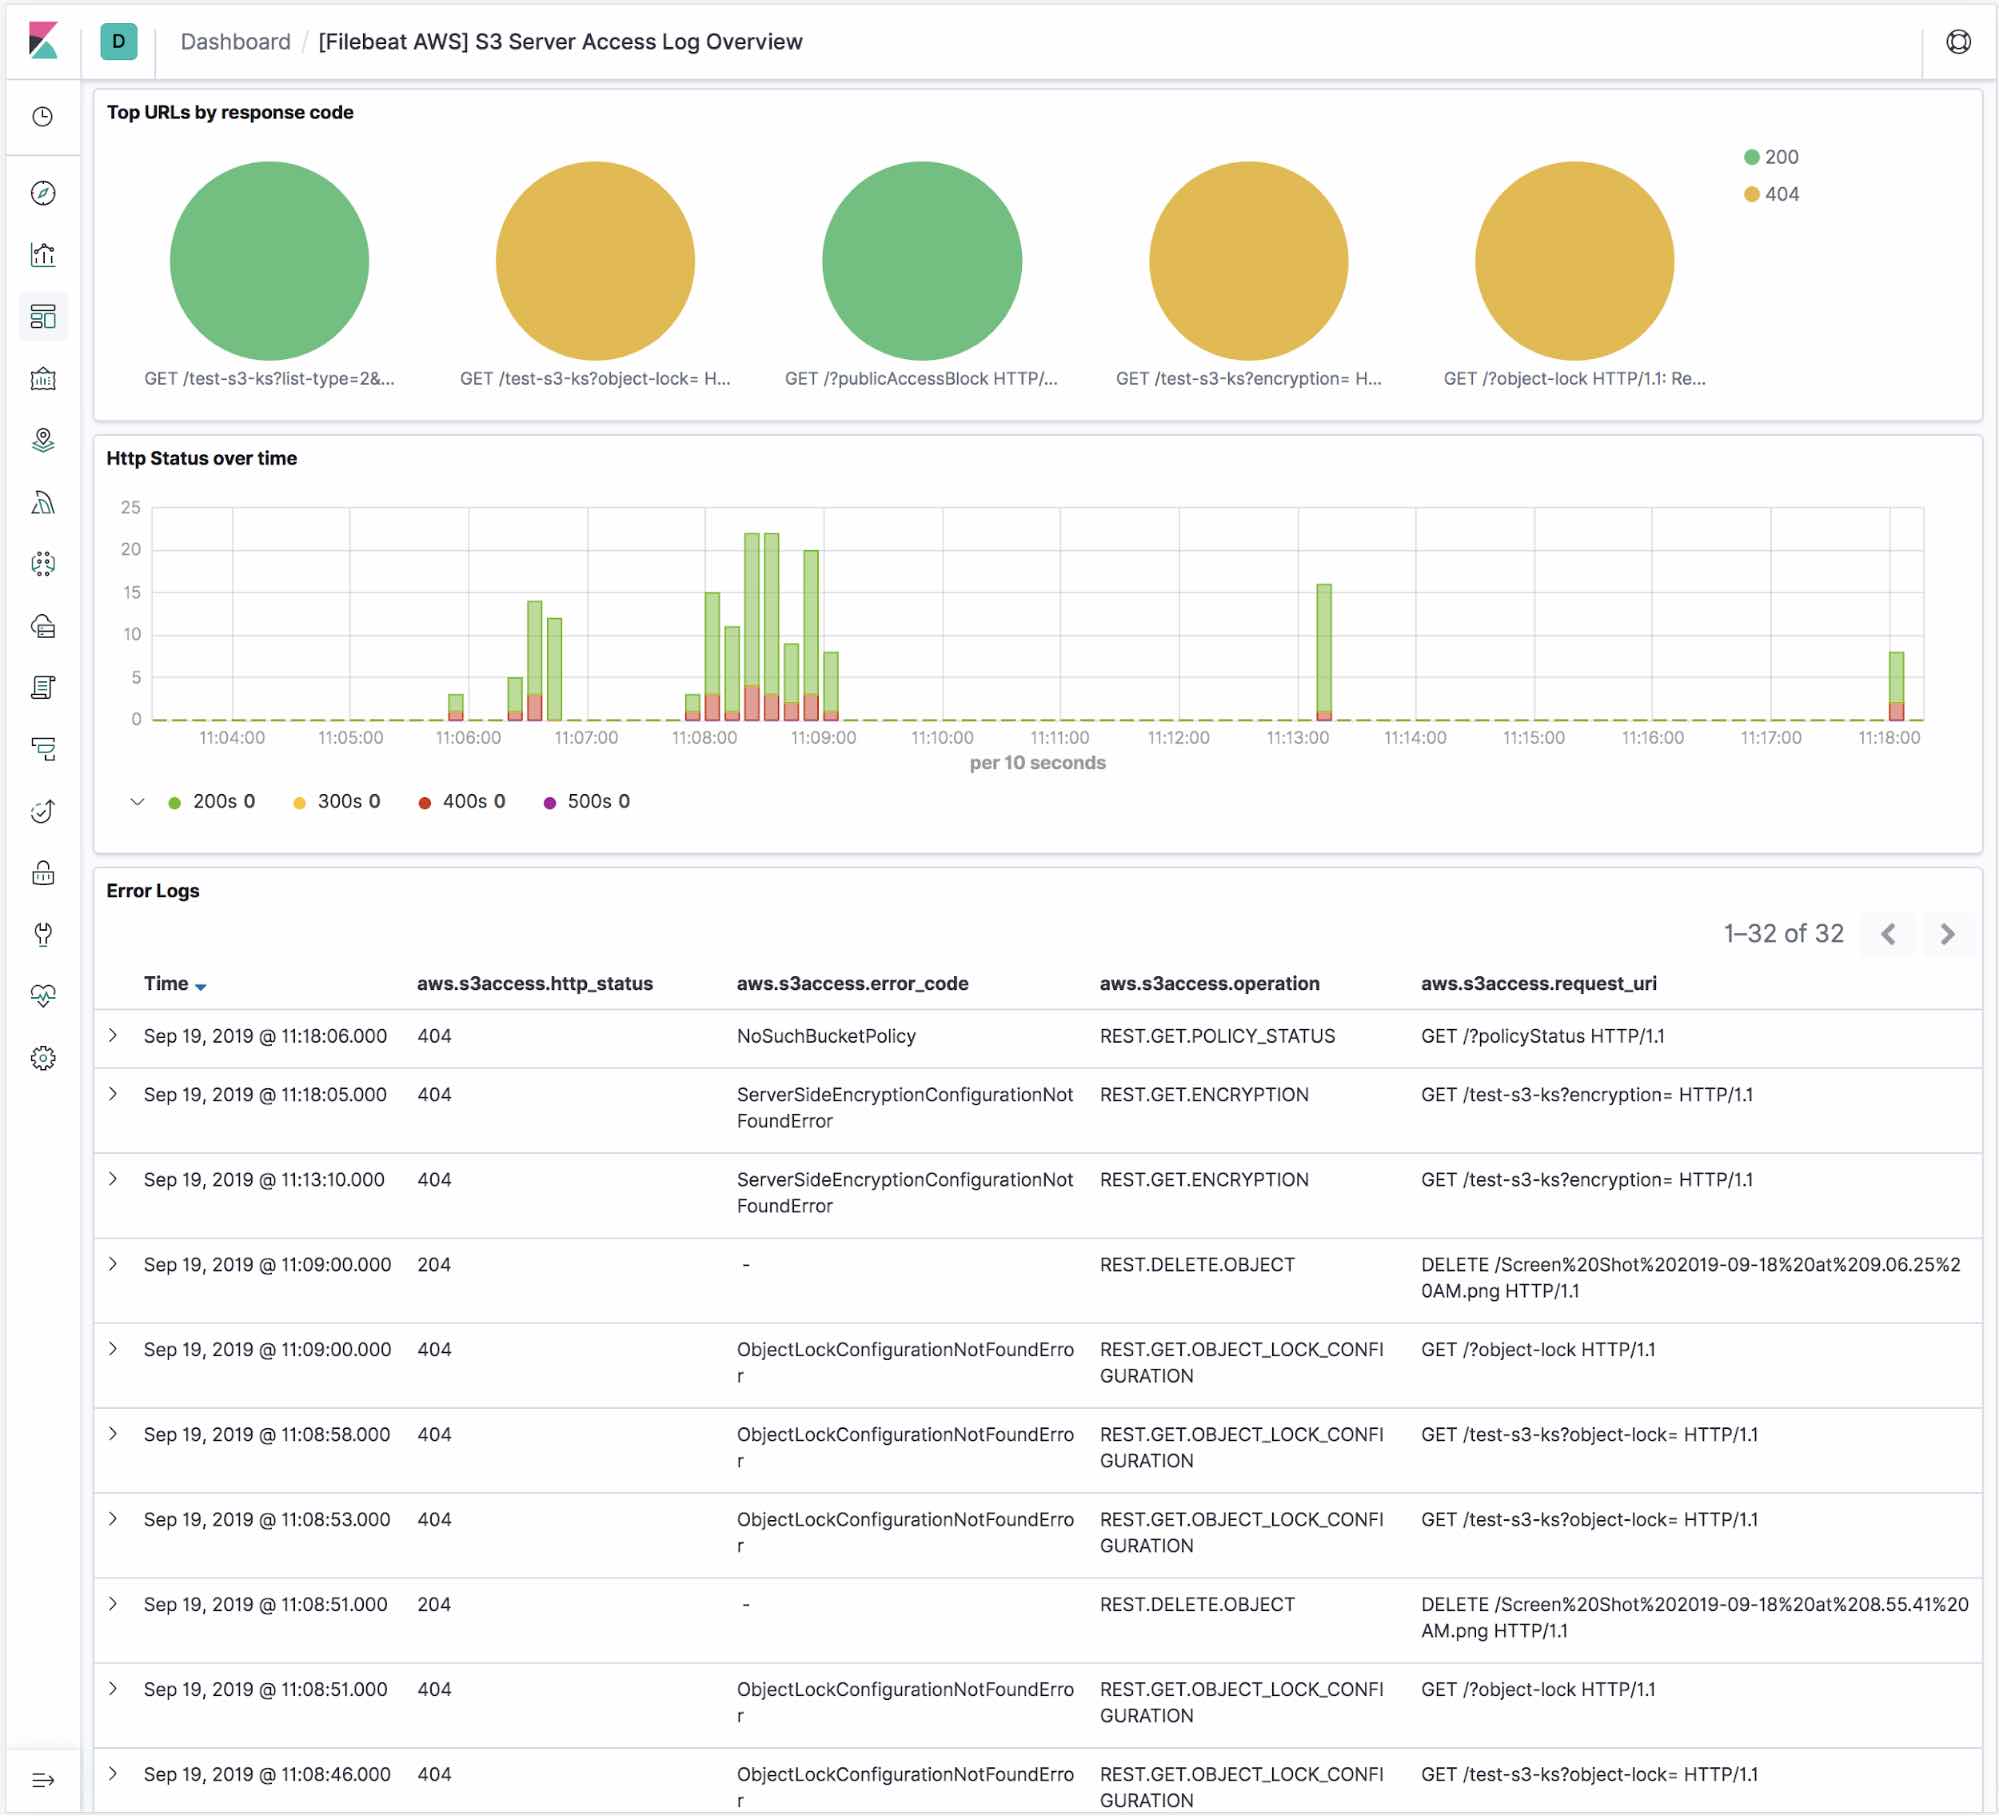
Step 5: Using the Kibana s3access fileset dashboard
The s3access fileset includes a predefined dashboard, called [Filebeat AWS] S3 Server Access Log Overview. By running the setup command when you start Filebeat, you automatically set up these dashboards in Kibana.
For Mac and Linux:
./filebeat setup --dashboards
For more information on this, please see the Set up the Kibana dashboards documentation.
This dashboard is an overview of AWS S3 server access logs. It shows top URLs with their response code, HTTP status over time, and all the error logs.
What’s next
With the Filebeat s3 input, users can easily collect logs from AWS services and ship these logs as events into our Elasticsearch Service on Elastic Cloud, or to a cluster running off of the default distribution. For 7.4, the s3access fileset is available for users to collect and analyze S3 server access logs. For 7.5, the elb fileset is available for users to collect logs from the classic load balancer, application load balancer, and network load balancer. In the near future, we will start adding more filesets to support other commonly used logs such as VPC flow logs, CloudWatch logs, and Cloudtrail logs. If you have any questions or feedback, please feel free to post on Beats Discuss forum!