Elastic Infrastructure 7.4.0 released
We are excited to announce a new version of Elastic Infrastructure, 7.4.0, available on the Elasticsearch Service, or as part of the default distribution of Elastic Stack. This release adds more integrations, a new UI section for AWS metrics, new out of the box dashboards, and much more!
StatsD module
StatsD is a popular monitoring agent written in Node.js. It listens for statistics, like counters and timers, sent over UDP or TCP, then sends aggregates to a backend.
7.4.0 adds a Metricbeat StatsD module for collecting custom metrics from applications that have been configured to send them to StatsD. There were several workarounds for this previously, e.g. capturing metrics from the Prometheus statsd_exporter, or using the Graphite module configured as a StatsD backend. Now we’ve added a dedicated module that integrates with StatsD.
Initially the module supports one metricset: server which exposes the following fields:
- statsd.<metric_name>.count - StatsD counters.
- statsd.<metric_name>.<agg_type> - custom metrics.
Like other Metricbeat modules, the StatsD module is easy to configure and use. To learn more see the StatsD module documentation page.
Note: the StatsD module is in beta.
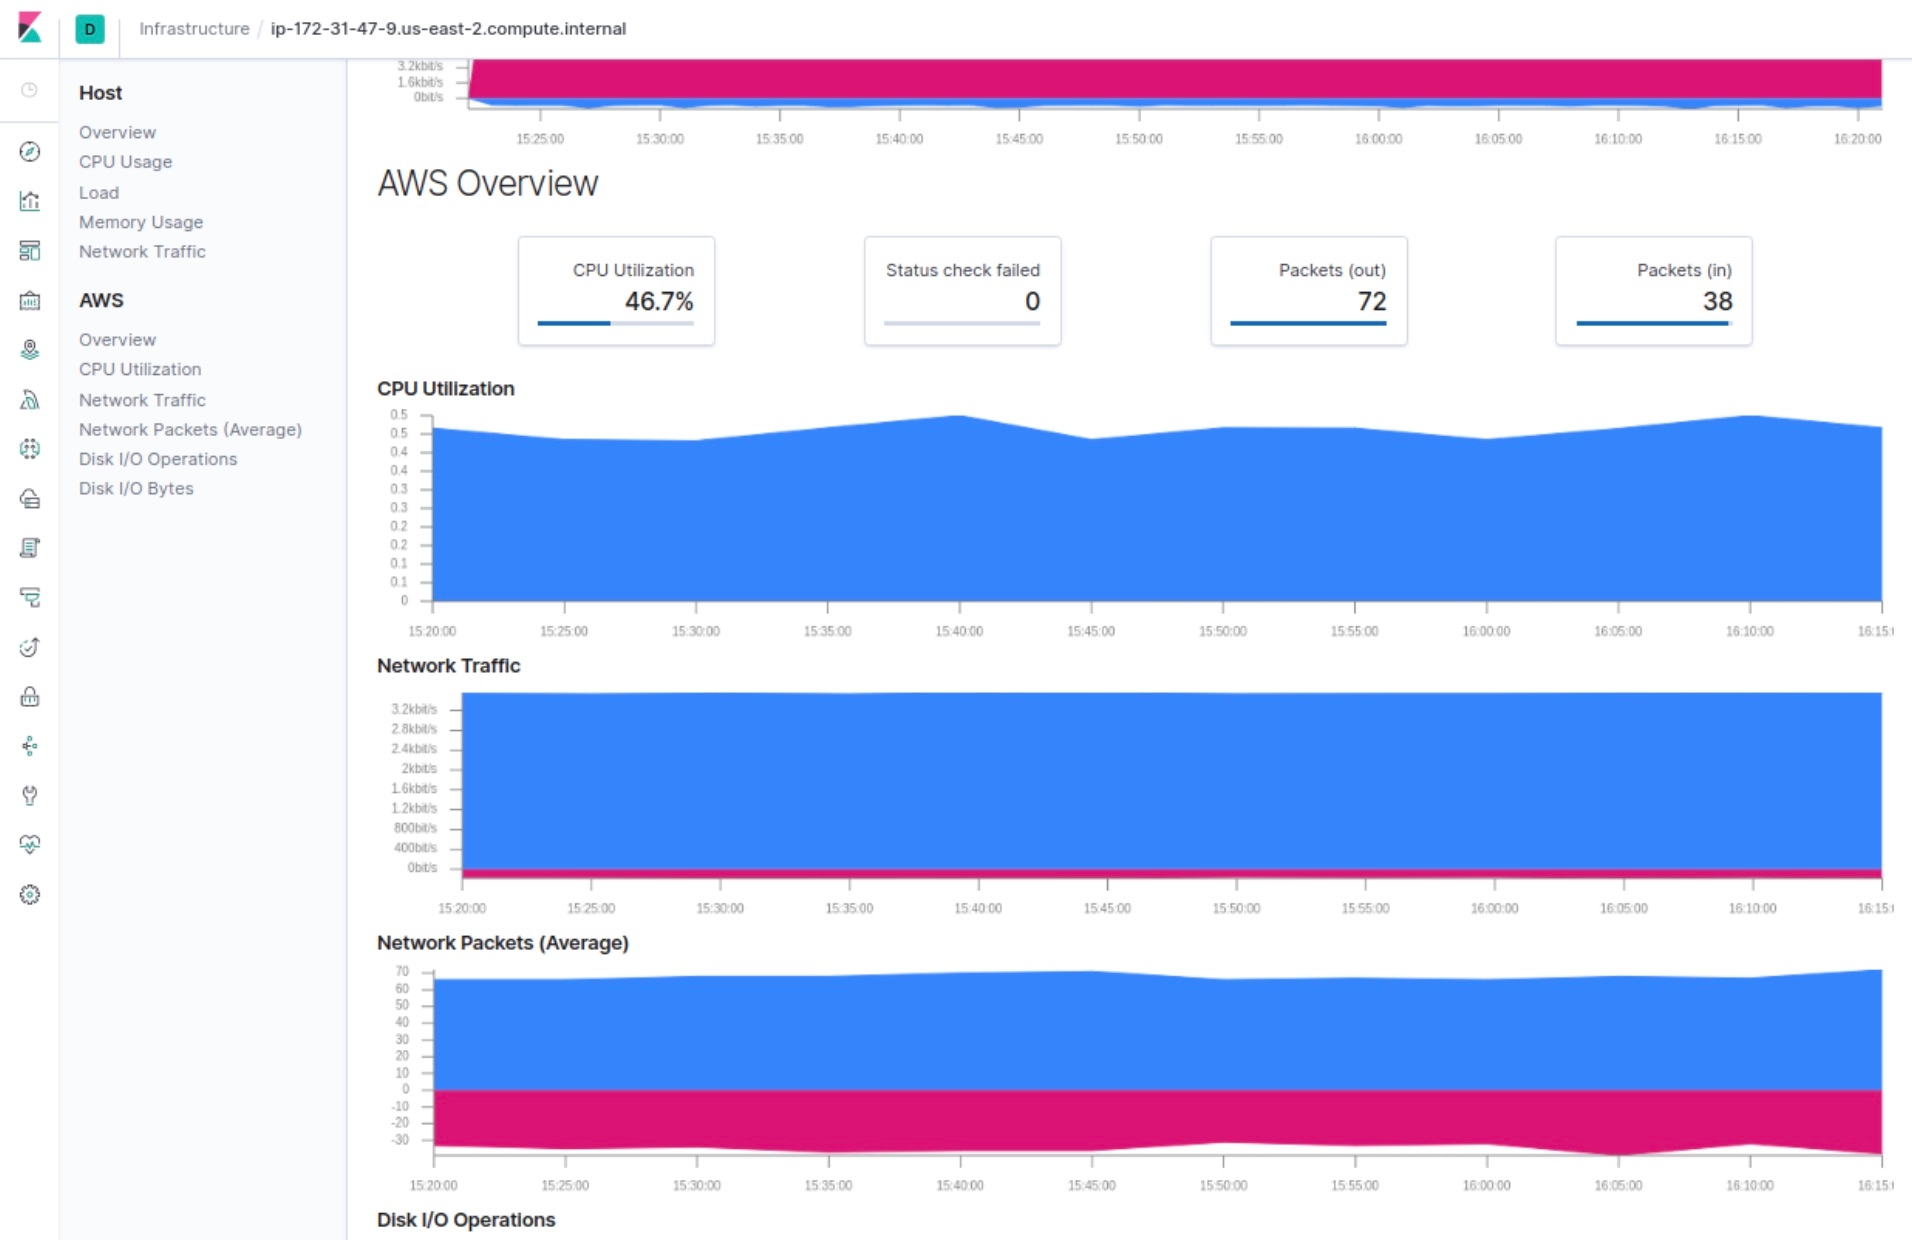
AWS Metrics UI, CloudWatch statistics, and more
In this release we’ve introduced a dedicated section for viewing the details of the most relevant metrics for your AWS resources. Simple and easy to use — a single place to see how your workloads are doing.
One of the key concepts in the AWS CloudWatch service is statistics, which are metric data aggregations over a specified period of time. Aggregations are made using the namespace, metric name, dimensions, and the data point unit of measure. We’ve added support for these statistics to the CloudWatch metricset in our AWS module. The currently supported statistics are: maximum, minimum, sum, average, sample count. Adding a statistic to the CloudWatch metricset configuration is very simple (note, for each metric users can define more than one statistic):
 metricsets:
    - cloudwatch
  metrics:
    - namespace: AWS/EC2
      name: ["DiskWriteOps"]
      statistic: ["Maximum", "Minimum"]   # one or more supported choices
Which will result in the following document:
{
   "aws": {
      "cloudwatch": {
         "namespace": "AWS/EC2",
         "metrics": {
            "DiskWriteOps.min": 30.2,
            "DiskWriteOps.max": 34,
         }
      }
   }
}
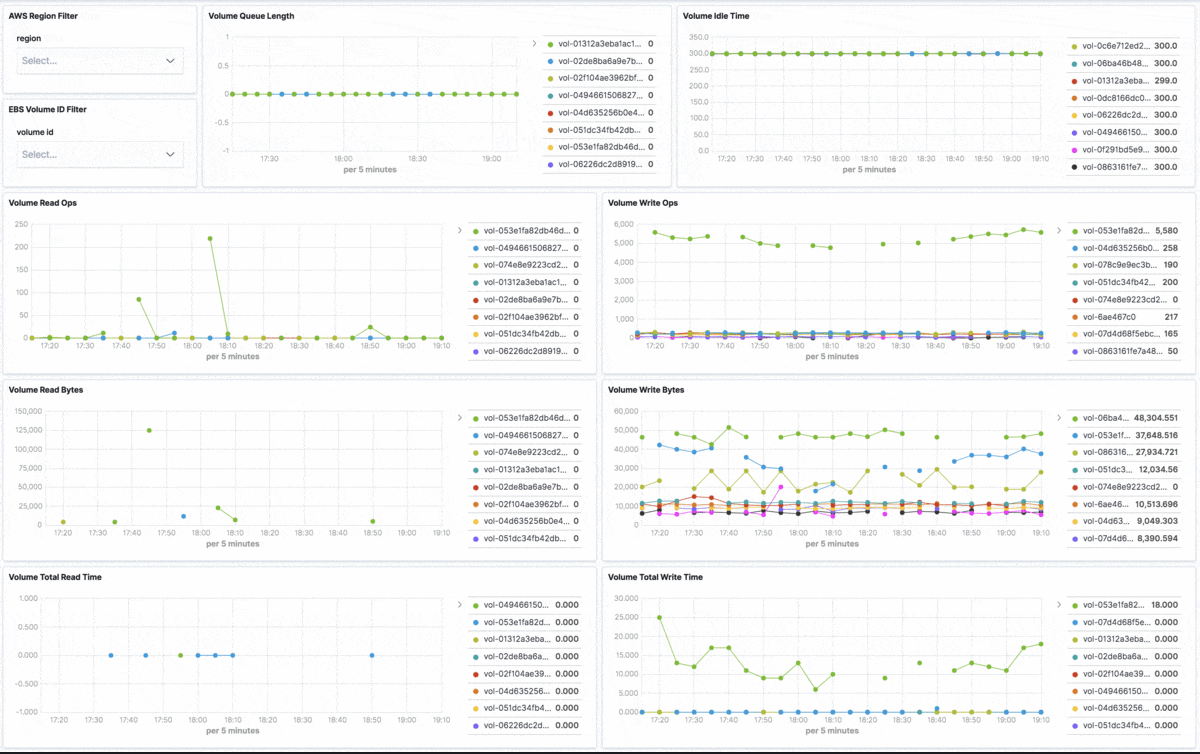
In addition this release brings new metricsets that cover two popular AWS services:
- AWS Elastic Load Balancing - provides high availability to applications by distributing traffic across a number of instances.
- AWS Elastic Block Store - a cloud block storage system that is best used for storing persistent data.
These metricsets are based on the concept of light modules, introduced in 7.3, which means we didn’t have to write any Go code to build them. Each comes bundled with an overview dashboard:
Improved Kubernetes observability
Many Kubernetes deployments make use of kube-state-metrics, a standalone agent that talks to the Kubernetes API server and captures a bunch of metrics about the state of all the Kubernetes objects. These metrics are exposed in the Prometheus metrics exposition format and served as plain text. In Metricbeat terms each object covered by the agent corresponds to a metricset in the Kubernetes Module.
This release continues expanding our observability capabilities of Kubernetes environments by adding support for the CronJob metrics of the excellent kube-state-metrics agent. CronJob is a service in Kubernetes used to run jobs on a time-based schedule.
This new cronjob metricset supports all fields exposed by the kube-state-metrics agent with the kubernetes.cronjob.* prefix. We will continue support for more objects in future releases.
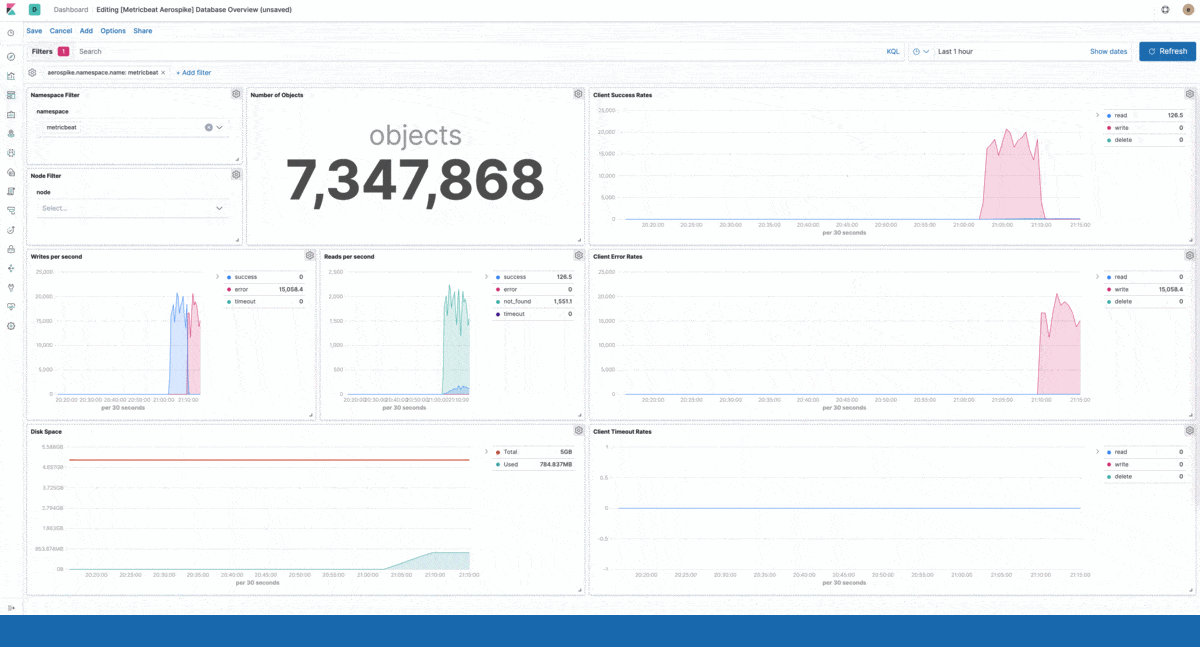
Metricbeat dashboards
Monitoring complex deployments is a big task. As a DevOps engineer you and your team want to be focused on the most mission critical parts of your application, yet still keep an eye on what’s happening with all the third party tools that comprise your stack. Our goal is to make such observability as easy as possible.
In this release we’ve introduced several new visualizations and dashboards that simplify monitoring of the most relevant KPIs for these Metricbeat modules showing:
- Aerospike - The most relevant metrics for Aerospike nodes and namespaces (e.g. read/write rates, number of objects, and error rates)
- Ceph - Object pools, disk usage, and IOPS
- Couchbase - Usage charts, such as CPU, memory, disk, and bucket stats
- CouchDB - An overview of the database requests/responses, open databases, and db read/writes
- PostgreSQL - Visualizations of database transactions, query latencies, conflicts, deadlocks, and block cache stats
- Prometheus - Prometheus server stats
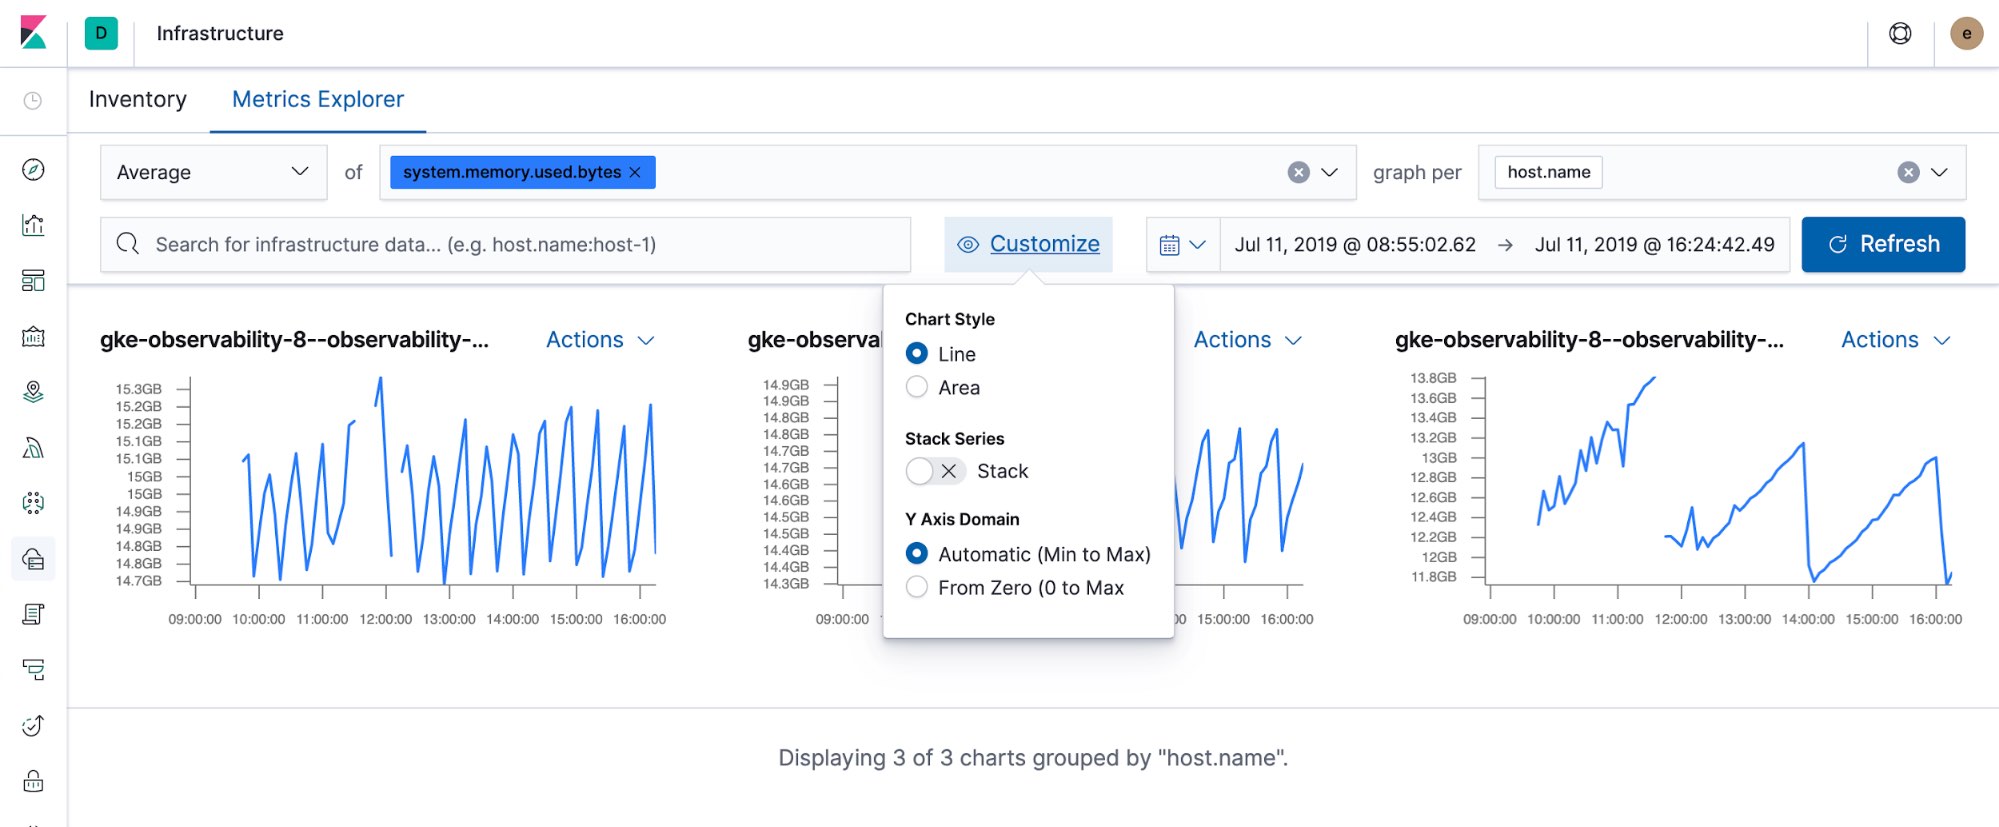
Customizable charts in Metrics Explorer
In 7.4 we’ve added several ways to customize our new Metrics Explorer, in particular, how the charts are displayed.
The first option is the Chart Style. Users can now change between line charts and area charts. Along with this option, the user can also control the series stacking. This becomes useful for visualising related metrics (e.g. system.memory.* or system.cpu.*.pct) on one chart.
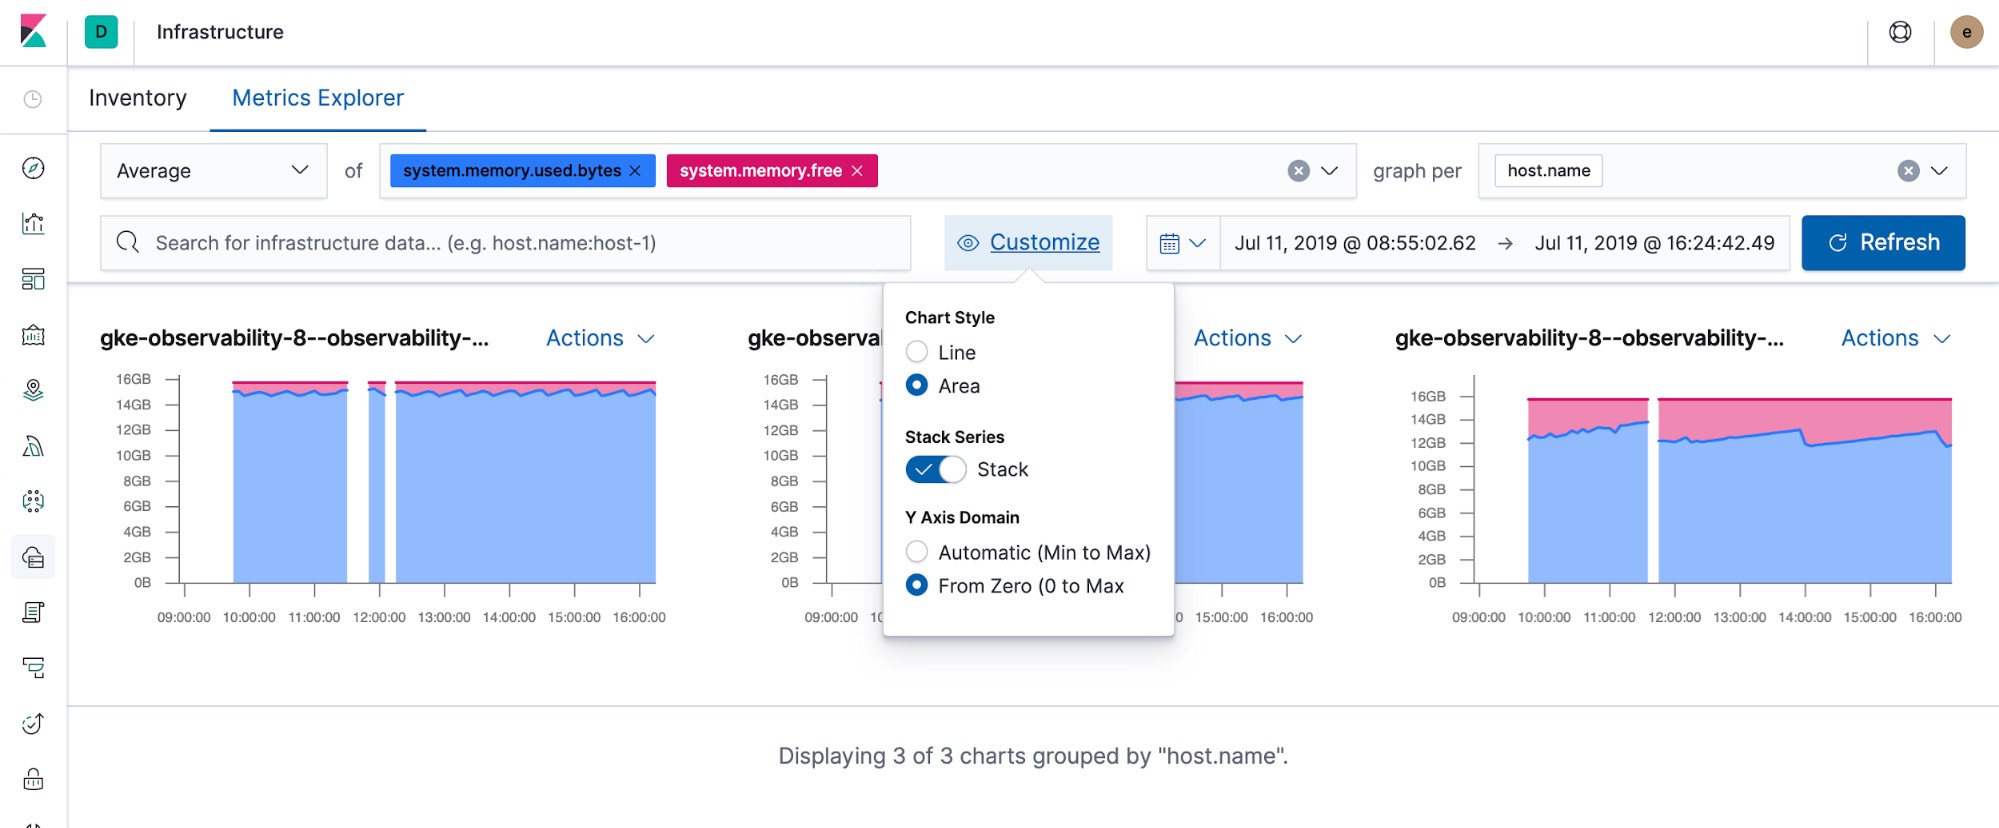
Y-Axis domain. The Y-Axis always starting at zero makes it more difficult to notice changes in very large numbers. This option will allow the user to switch between From Zero (zero to max) and Automatic (min to max).
Performance metrics for Oracle databases
The Oracle integration introduced in the previous release gets an update too. This time we’ve added a new performance metricset that covers performance related Oracle metrics for the open cursors and cache based data. There are three types of events generated by the metricset:
- Instance based cursor data.
- Cursor data aggregated by username and machine.
- Cache data.
Find out more about what performance metrics have become available on the Oracle module documentation page.
Try it yourself!
You can access the latest version of the Elastic Infrastructure application on the Elasticsearch Service on Elastic Cloud by creating a new cluster, or upgrading an existing cluster the day of release, or you can download it as part of the default distribution of the Elastic Stack.
Let us know what you think. Ask a question or leave feedback in our forums.