Getting started with free and open Elastic Observability
Unify and contextualize your logs, metrics, application trace data, and availability data behind a single pane of glass. Elastic Observability provides a unified view into the health and performance of your entire digital ecosystem. With easy ingest of multiple kinds of data via pre-built collectors for hundreds of data sources, Elastic Observability delivers seamless integration between the facets of observability. Built-in alerting allows you to see when you're nearing your SLAs, and purpose-built applications let you see your data in ways that make sense, including detailed user experience scores. Companies like Audi, Etsy, Societe Generale, Domain, Kroger, and many more have deployed Elastic Observability for varied use cases, ranging from centralized logging to monitoring the digital experiences.
In this blog, we'll show you how to get started with Elastic Observability. First, we will download and prep the software, then deploy and do a dry run with Elasticsearch, the heart of the Elastic Stack. Next, we'll enable security and role-based access control in Elasticsearch, and connect Kibana, the window to the Elastic Stack, which serves as both the administrative front end and visualization layer. Finally, we'll further secure our cluster by enabling SSL, TLS, and HTTPS.
NOTE: The steps in this blog use the self-managed option of running Elastic Observability. Everything described here is part of our free and open distribution tier, rich with capabilities like distributed tracing, unified agent, hundreds of data integrations, curated apps for APM, infrastructure monitoring, log exploration, and much more. All of these features are also available on the Elasticsearch Service on Elastic Cloud, a completely managed service, with a free trial. Whichever route you choose, you'll get the same great user experience.
I am running on a Mac, but the below instructions should be similar for Linux.
Step 1: Get the software
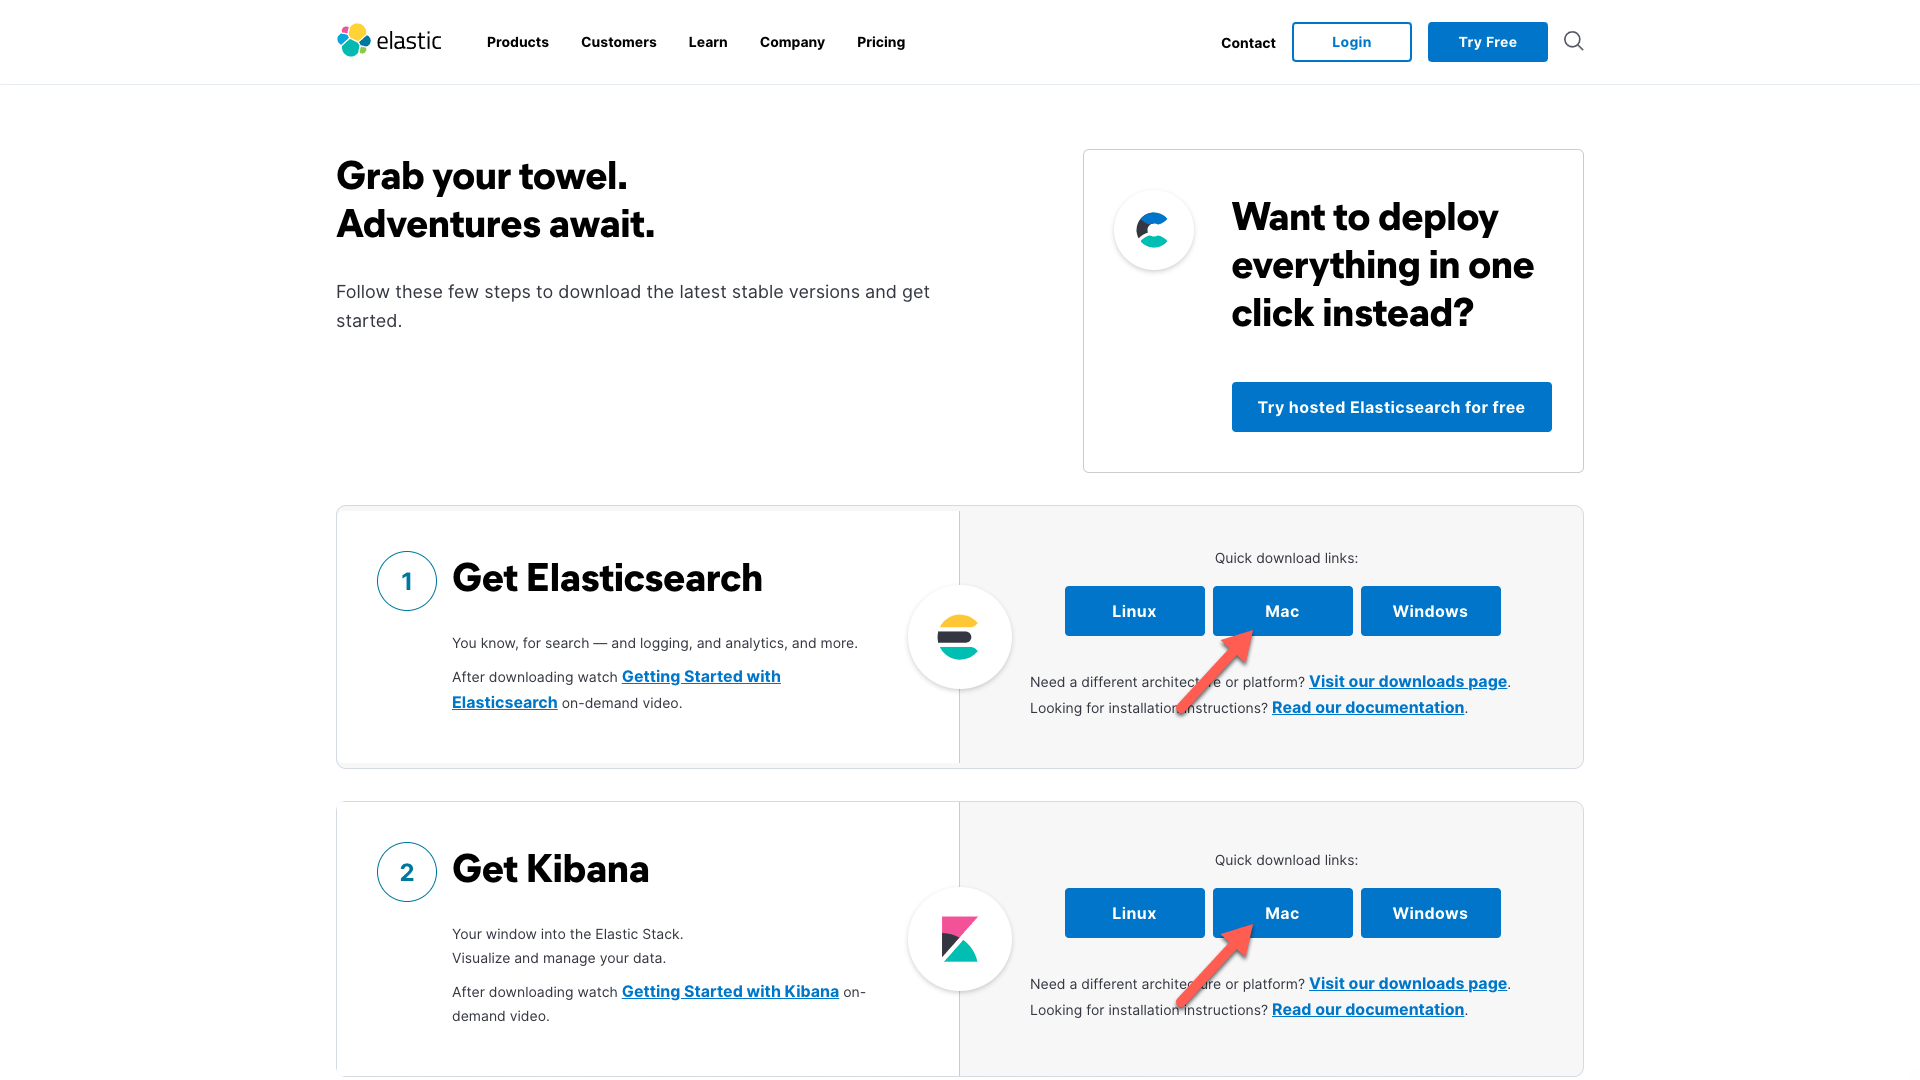
The first thing that we need to do is download the installation bundles for Elasticsearch and Kibana. You can grab the latest links from the getting started page and use cURL to grab them, or download them directly, which is what I did, just clicking on the Mac-flavored quick download links for Elasticsearch and Kibana:
In an attempt to be a little more organized than I normally am, I'm going to do this all in a subfolder in my own home directory. I will call it ~/ELK, and untar the two downloaded files that are in my ~/Downloads/ folder to there, and make the names a bit easier to type:
mkdir ~/ELK
cd ~/ELK
tar xzf ~/Downloads/elasticsearch-7.12.0-darwin-x86_64.tar.gz
tar xzf ~/Downloads/kibana-7.12.0-darwin-x86_64.tar.gz
mv elasticsearch-7.12.0 elasticsearch
mv kibana-7.12.0-darwin-x86_64 kibana
Now my directory looks like this:
~/ELK $ >ls -lF
total 0
drwxr-xr-x@ 12 jamie  staff  384 Mar 18 02:24 elasticsearch/
drwxr-xr-x@ 15 jamie  staff  480 Mar 18 03:03 kibana/
If there's a newer version available, adjust the names accordingly. We're now ready to move on to a dry run.
Step 2: Dry run with Elasticsearch
From this point on it will make it easier if I have multiple terminal tabs (or windows) open. I'll have three, each in the specified directory so I don't have to move around too much:
- Elasticsearch (in the elasticsearch directory)
- Tools ( also in the elasticsearch directory)
- Kibana (in the kibana directory)
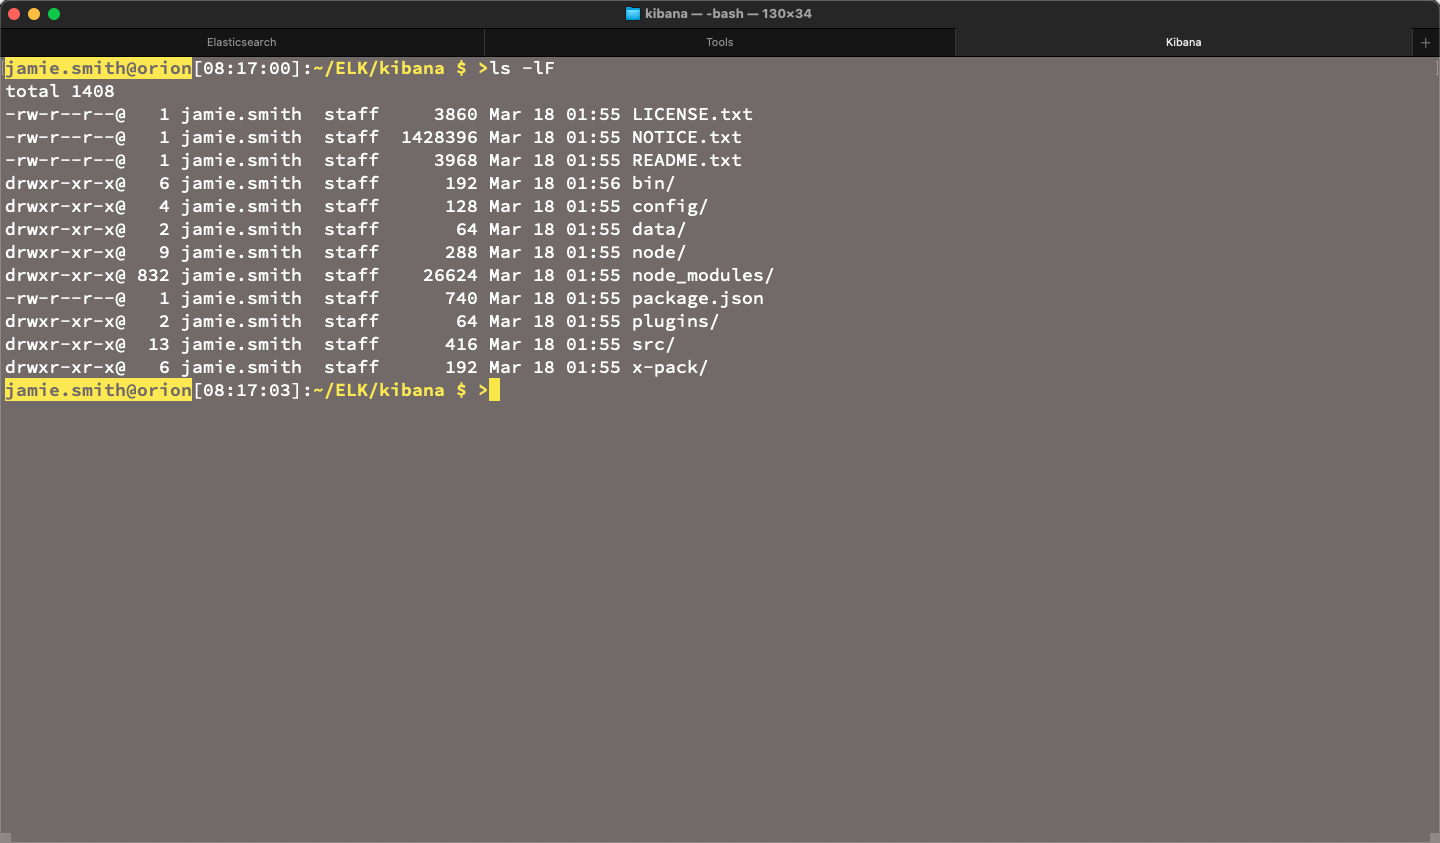
Now it looks like this:
At this point we can start a dry run — everything should just work. Starting on the Elasticsearch tab (again, in the elasticsearch directory), run ./bin/elasticsearch, and you should see a bunch of console output. It's done starting up when you see a line like this:
[orion] Active license is now [BASIC]; Security is disabled
Now, jump over to the Tools tab (quick tip if you're using Terminal (not iTerm) on MacOS: the keyboard shortcut ⌘+2 will take you to the second tab) and run curl "localhost:9200/?pretty", which gives you some version information:
curl "localhost:9200/?pretty"
{
  "name" : "orion",
  "cluster_name" : "elasticsearch",
  "cluster_uuid" : "i3mw-HM8SmaLMr1kYVK5oQ",
  "version" : {
    "number" : "7.12.0",
    "build_flavor" : "default",
    "build_type" : "tar",
    "build_hash" : "78722783c38caa25a70982b5b042074cde5d3b3a",
    "build_date" : "2021-03-18T06:17:15.410153305Z",
    "build_snapshot" : false,
    "lucene_version" : "8.8.0",
    "minimum_wire_compatibility_version" : "6.8.0",
    "minimum_index_compatibility_version" : "6.0.0-beta1"
  },
  "tagline" : "You Know, for Search"
}
Fantastic!
Elasticsearch is now set up and running, but without password protection. Role-based access control (RBAC) is free with the Elastic Stack, so let's go ahead and enable that.
Step 3: Setting up security
Enabling security in Elasticsearch
While we're still on the Tools terminal tab, we want to add "xpack.security.enabled: true" to the Elasticsearch configuration file, config/elasticsearch.yml. You can use the editor of your choice, but for this one liner I just run echo "xpack.security.enabled: true" >> config/elasticsearch.yml, and check it with tail config/elasticsearch.yml:
#
# For more information, consult the discovery and cluster formation module documentation.
#
# ---------------------------------- Various -----------------------------------
#
# Require explicit names when deleting indices:
#
#action.destructive_requires_name: true
xpack.security.enabled: true
Looks good.
Bootstrapping the default users
Back on the Elasticsearch terminal tab, restart Elasticsearch (ctrl+C then ./bin/elasticsearch) to pick up the configuration change, and go right back to the Tools tab.
Now we will set the passwords for the default users. When you run ./bin/elasticsearch-setup-passwords interactive you'll be prompted to type the password for each of the default users:
~/ELK/elasticsearch $ >./bin/elasticsearch-setup-passwords interactive
Initiating the setup of passwords for reserved users elastic,apm_system,kibana,kibana_system,logstash_system,beats_system,remote_monitoring_user.
You will be prompted to enter passwords as the process progresses.
Please confirm that you would like to continue [y/N]y
Enter password for [elastic]:
Reenter password for [elastic]:
Enter password for [apm_system]:
Reenter password for [apm_system]:
Enter password for [kibana_system]:
Reenter password for [kibana_system]:
Enter password for [logstash_system]:
Reenter password for [logstash_system]:
Enter password for [beats_system]:
Reenter password for [beats_system]:
Enter password for [remote_monitoring_user]:
Reenter password for [remote_monitoring_user]:
Changed password for user [apm_system]
Changed password for user [kibana_system]
Changed password for user [kibana]
Changed password for user [logstash_system]
Changed password for user [beats_system]
Changed password for user [remote_monitoring_user]
Changed password for user [elastic]
If we run the curl test again it should fail:
~/ELK/elasticsearch $ >curl "localhost:9200/?pretty"
{
  "error" : {
    "root_cause" : [
      {
        "type" : "security_exception",
        "reason" : "missing authentication credentials for REST request [/?pretty]",
        "header" : {
          "WWW-Authenticate" : "Basic realm=\"security\" charset=\"UTF-8\""
        }
      }
    ],
    "type" : "security_exception",
    "reason" : "missing authentication credentials for REST request [/?pretty]",
    "header" : {
      "WWW-Authenticate" : "Basic realm=\"security\" charset=\"UTF-8\""
    }
  },
  "status" : 401
}
But if we add in a basic auth header using the kibana_system user and the password that I created (curl --user elastic:ThisIsTooEasy "localhost:9200/?pretty") it works again:
{
  "name" : "orion",
  "cluster_name" : "elasticsearch",
  "cluster_uuid" : "i3mw-HM8SmaLMr1kYVK5oQ",
  "version" : {
    "number" : "7.12.0",
    "build_flavor" : "default",
    "build_type" : "tar",
    "build_hash" : "78722783c38caa25a70982b5b042074cde5d3b3a",
    "build_date" : "2021-03-18T06:17:15.410153305Z",
    "build_snapshot" : false,
    "lucene_version" : "8.8.0",
    "minimum_wire_compatibility_version" : "6.8.0",
    "minimum_index_compatibility_version" : "6.0.0-beta1"
  },
  "tagline" : "You Know, for Search"
}
Configuring Kibana for authentication
We haven't started Kibana yet, but before we do we need to configure it with the kibana_system user that we just tested above. Switch to the Kibana tab, and open config/kibana.yml in your favorite text editor. Search for password in the file (in 7.12.0 it's on line 45) — it should look like this:
# If your Elasticsearch is protected with basic authentication, these settings provide
# the username and password that the Kibana server uses to perform maintenance on the Kibana
# index at startup. Your Kibana users still need to authenticate with Elasticsearch, which
# is proxied through the Kibana server.
#elasticsearch.username: "kibana_system"
#elasticsearch.password: "pass"
There's a note about If your Elasticsearch is protected with basic authentication…, and ours is. Uncomment the two elasticsearch.* lines by removing the # at the beginning, so they are right at the start of the line. Change the quoted value on the second one to match the password that you chose for the kibana_system user. Mine now looks like this:
elasticsearch.username: "kibana_system"
elasticsearch.password: "ThisIsTooEasy"
Save and close the file.
Step 4: Start Kibana
Now we'll start Kibana, but a quick note. If you're on a Mac and the startup causes a popup (five or so times) that looks like this:
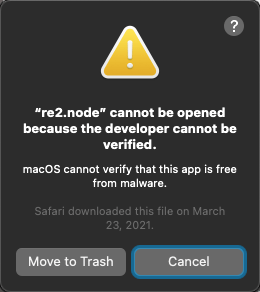
Then you'll need to remove it from the Gatekeeper quarantine. Hit cancel each time (don't Move to Trash or you'll have to untar Kibana and redo the config again — don't ask me how I know that). To remove it from quarantine inside the kibana directory, just run:
xattr -d -r com.apple.quarantine ./node_modules/re2/build/Release/re2.node
Still on the Kibana tab, run ./bin/kibana, which will start Kibana. On the console you'll see something like this in the middle, indicating that it's ready to go:
  log   [08:55:18.098] [info][listening] Server running at http://localhost:5601
  log   [08:55:18.557] [info][server][Kibana][http] http server running at http://localhost:5601
Open up the Kibana URL in a browser (another Terminal tip: hold down the ⌘ key and double click the URL in Terminal to open it in the default browser). Log in with the elastic user and the password that you created for it (I just used the same ThisIsTooEasy).
Load sample data
Once logged in you're greeted with a welcome screen, and a chance to load some sample data. Let's do that!
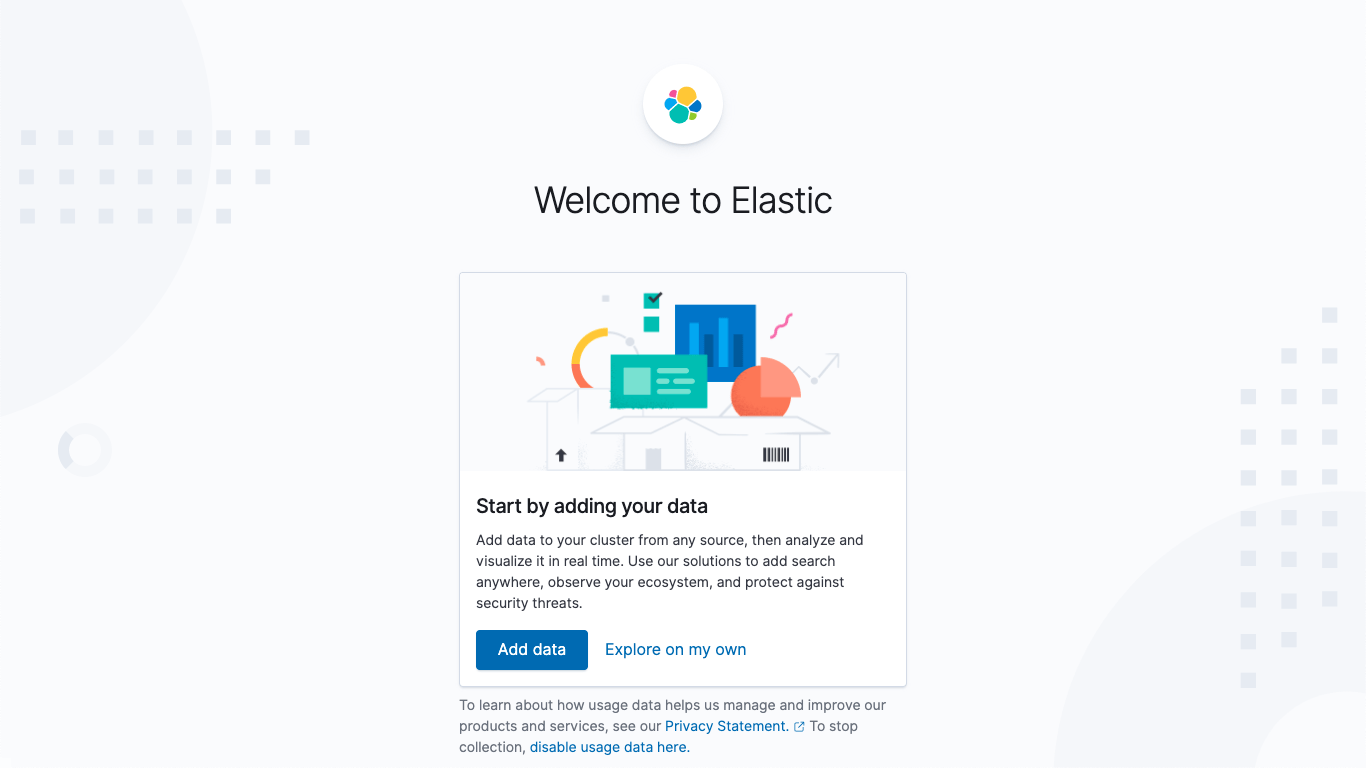
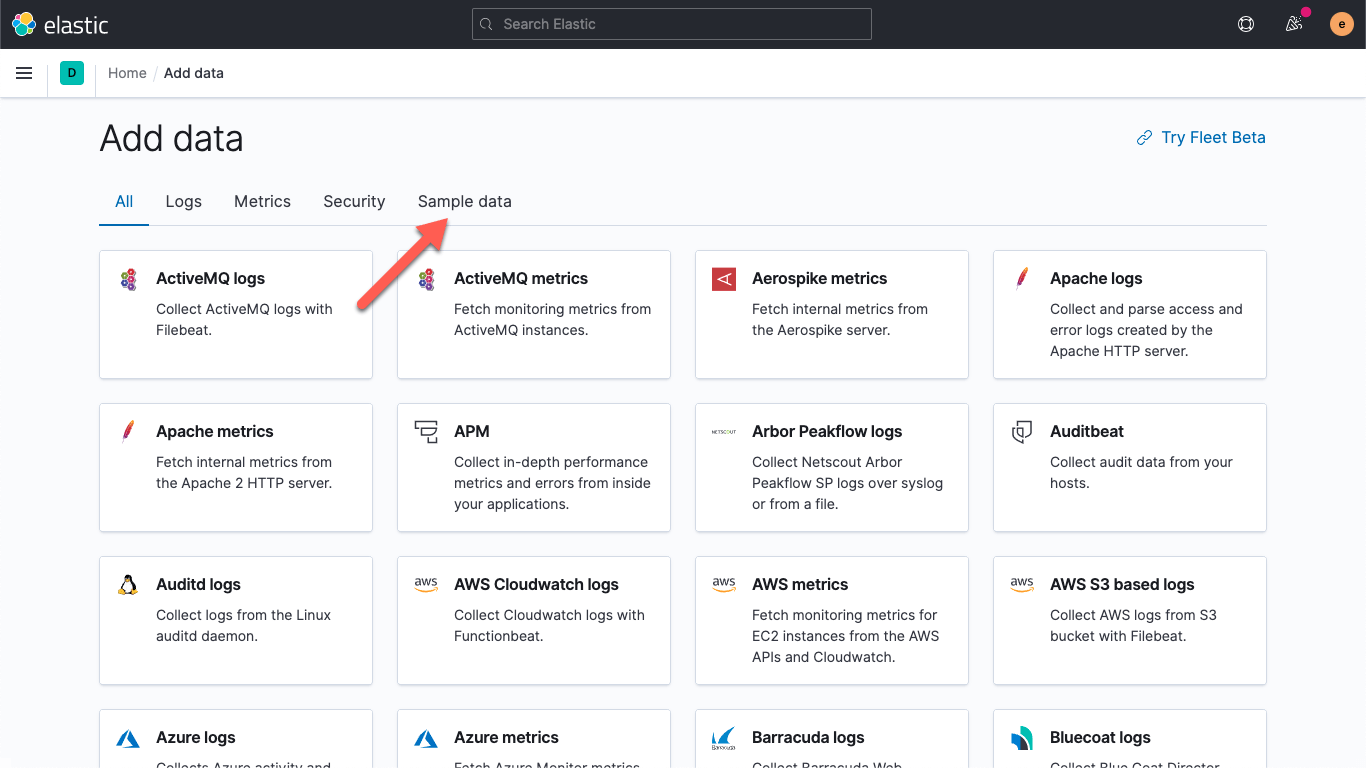
Click on Add data, and you'll land on the Add data page (makes sense). You can dismiss the message about the "New: Elastic Agent and Fleet Beta" (another part of the free and open Elastic Stack, but that's another story). Click on Sample data,
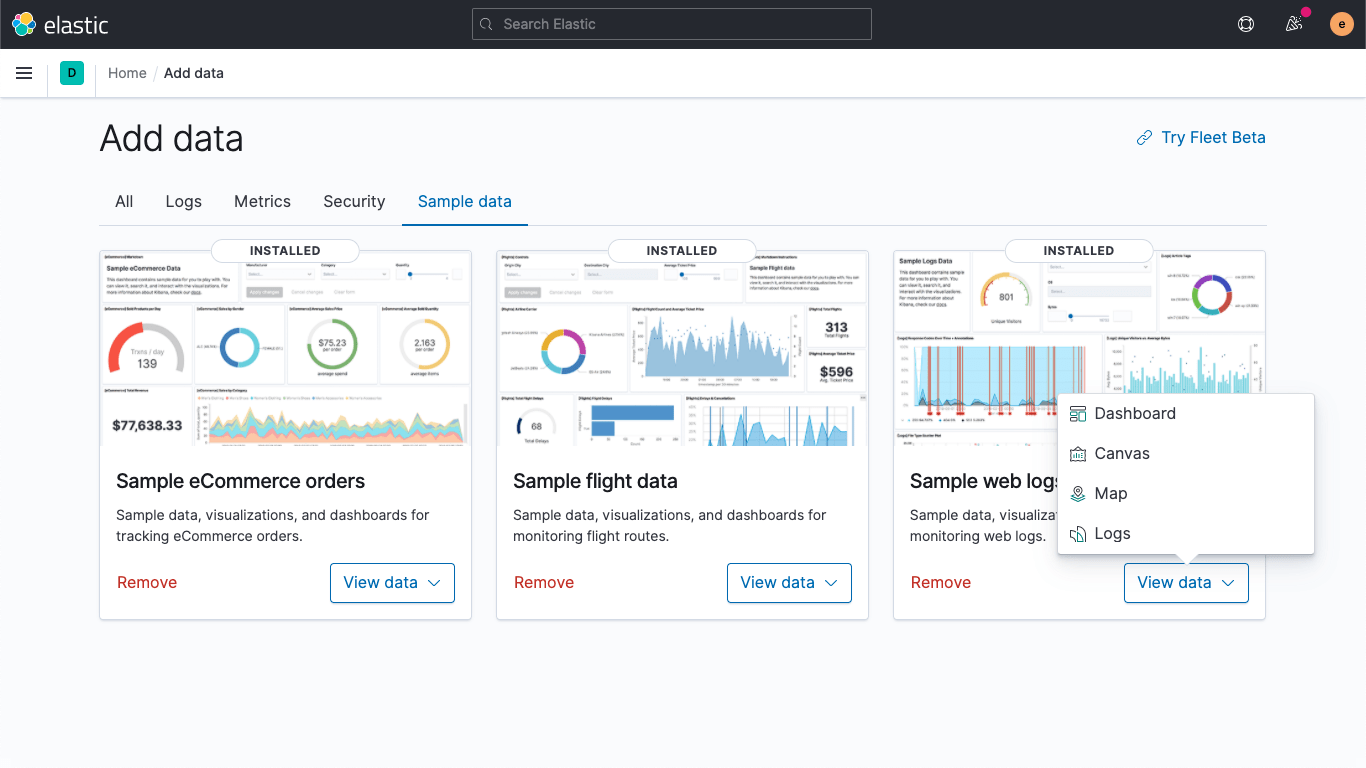
then add the sample data sets (at least the Sample web logs one). Once they're done, click on View data for the Sample web logs:
The Elastic Stack has integrations for many data sources, such as databases, cloud service providers, and services, most of which are free to use under the Elastic License (if you want to check out the source code most of it is in the Beats GitHub repository). Look for the "Data sources" on the licensing page; anything with a check mark in either of the first two columns is free to use.
Integrations also include other things as well. Most come with visualizations and dashboards, some come with preconfigured data tiering, or Canvas workpads. As shown above, the sample data has some of these as well. The dashboard shows some of the visualization types at your disposal,
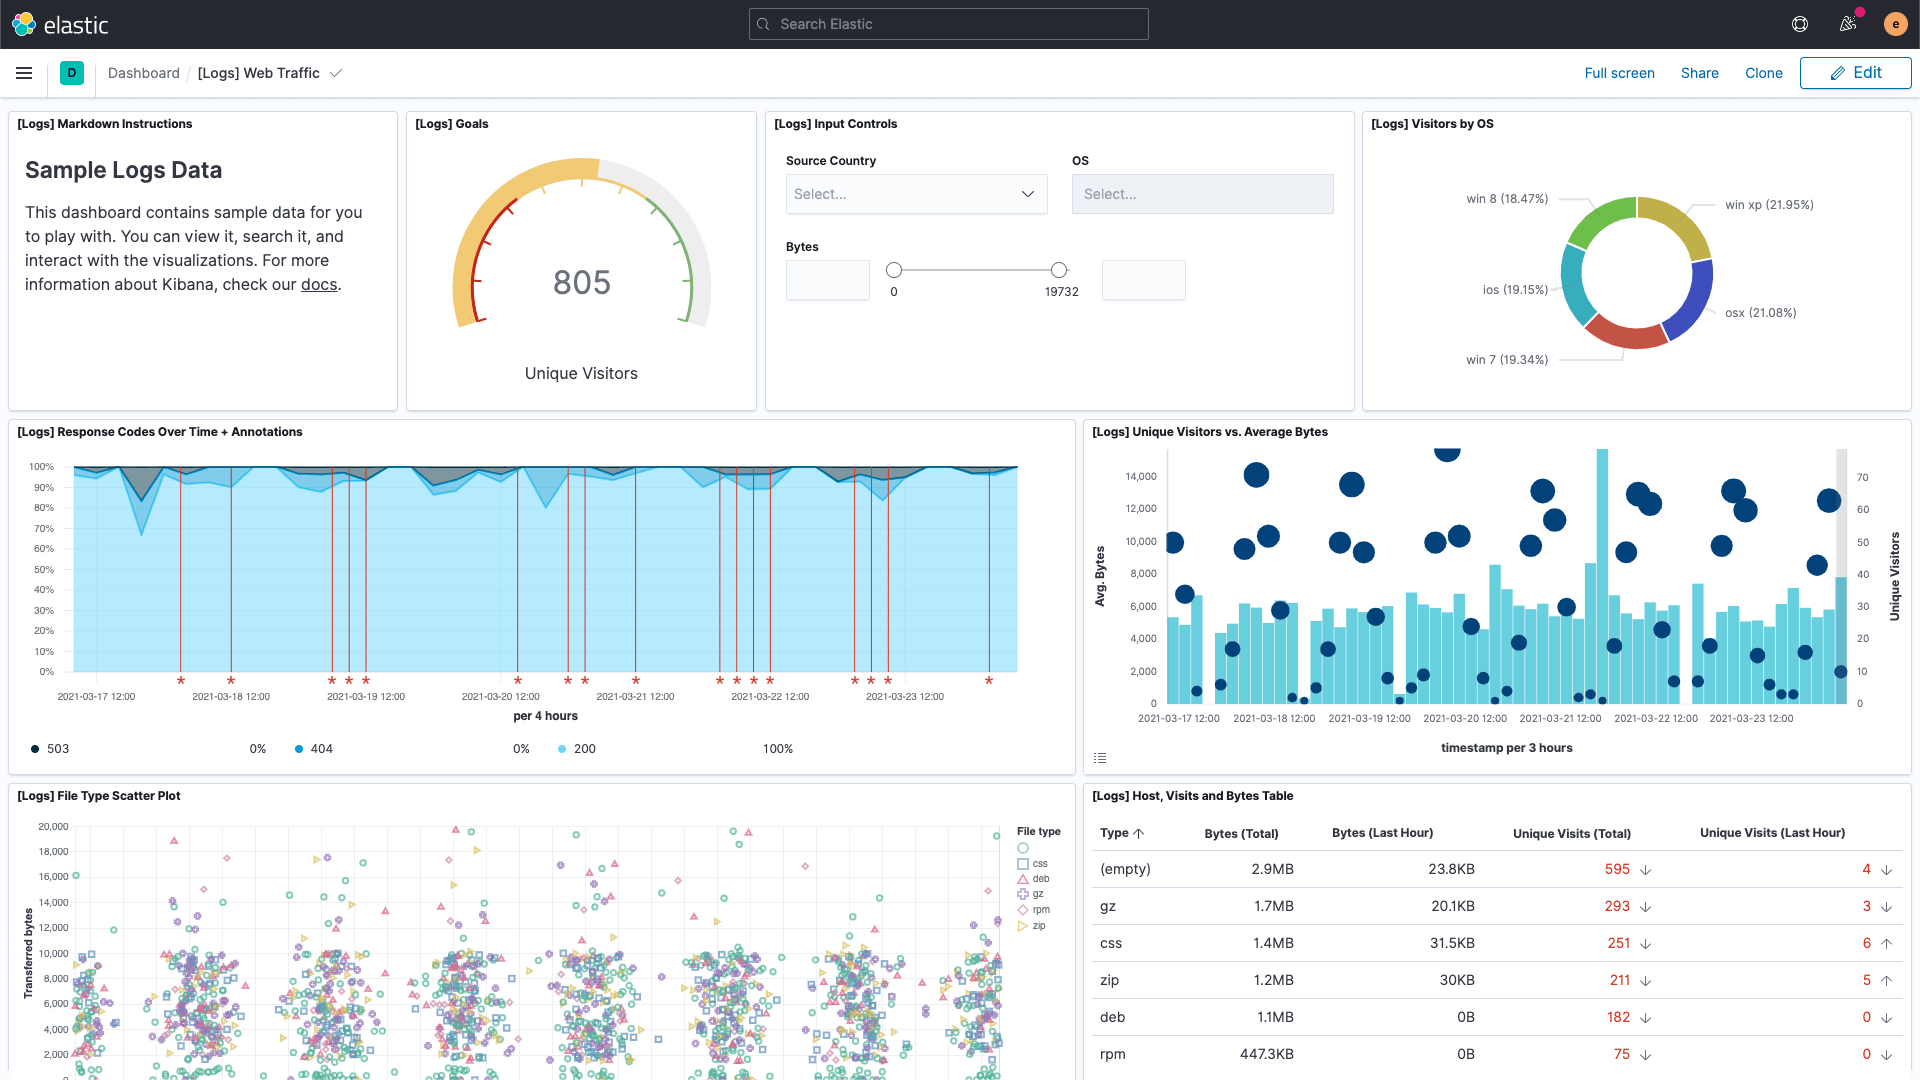
while the Logs app provides a consolidated view of the logs across your ecosystem:
There are also links to other areas in Elastic Observability to help streamline investigations but since we don't have this kind of data yet they're not clickable.
Click around a bit more, try out the highlight feature in the Logs app. It lets you see key bits of information without filtering.
Everything is working now, and you can explore Kibana and the data from the other sample datasets. To get back to that load screen, click on the hamburger at the top, then home:
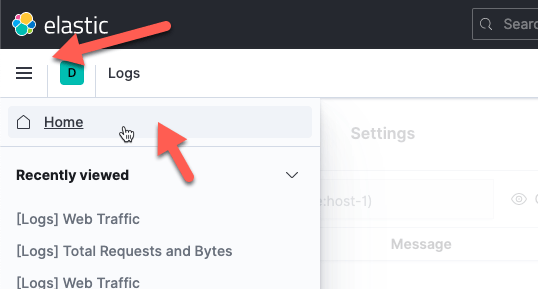
then the Add Data button).
You might have noticed that our Kibana URL (http://localhost:5601) is only accessible on the local host and isn't HTTPS, so we can't access it from other hosts and it's not as secure as it could be. Lets remedy that next.
Step 5: Encrypting communications with Elastic Stack
Next we'll harden our cluster a bit more, by enabling HTTPS on the Kibana interface and setting up SSL/TLS communications. To do this we'll set up some self-signed certificates, but feel free to use another mechanism if you have one available (spoilers: if you use self-signed you'll have to accept the exemption in your browser later). We will create two sets: one for our Elasticsearch node and one for our Kibana instance. Feel free to stop Kibana for now.
Prepping the configuration
First we'll generate a certificate authority. Jump back over to the Tools terminal tab for this. Run the command ./bin/elasticsearch-certutil ca --pem, which will prompt you for a file to save it in. Feel free to change the name, or go with the default, elastic-stack-ca.zip.
We need to generate the certificates for a specific machine, and we can do that either by using a name that will resolve to an IP, or by an actual IP address. If you choose to go the name route you can either make sure that your host is registered in the DNS (if it's DHCP it might already be), or put it into your hosts file, found at /etc/hosts.
Next, generate a configuration file called certs.yml, and paste in the following:
instances:
  - name: 'es_1'
    dns: [ '<your_hostname>' ]
  - name: 'kibana_1'
    dns: [ '<your_hostname>' ]
If you're using a name, replace <your_hostname> with a hostname that will resolve. In my case, it's orion, so mine looks like:
# add the instance information to yml file
instances:
  - name: 'es_1'
    dns: [ 'orion' ]
  - name: 'kibana_1'
    dns: [ 'orion' ]
If I wanted to do it by IP address it would have been:
# add the instance information to yml file
instances:
  - name: 'es_1'
    ip: [ '192.168.1.175' ]
  - name: 'kibana_1'
    ip: [ '192.168.1.175' ]
In either case make sure that you get the spacing right. YAML is finicky. Whether you use the hostname or IP address, let's call the value for the host the "<HOST_ID>".
Unzip the elastic-stack-ca.zip that we generated, which should yield:
~/ELK/elasticsearch $ >unzip elastic-stack-ca.zip
Archive:  elastic-stack-ca.zip
   creating: ca/
  inflating: ca/ca.crt
  inflating: ca/ca.key
Finally, generate the certificates by running:
./bin/elasticsearch-certutil cert \
  --ca-cert ca/ca.crt \
  --ca-key ca/ca.key \
  --pem \
  --in certs.yml \
  --out certs.zip
Which will basically use the CA we created to generate our certificates and create a file called certs.zip, containing the following files (yours might vary a bit):
unzip -l certs.zip
Archive:  certs.zip
  Length      Date    Time    Name
---------  ---------- -----   ----
        0  03-25-2021 08:42   es_1/
     1168  03-25-2021 08:42   es_1/es_1.crt
     1679  03-25-2021 08:42   es_1/es_1.key
        0  03-25-2021 08:42   kibana_1/
     1172  03-25-2021 08:42   kibana_1/kibana_1.crt
     1675  03-25-2021 08:42   kibana_1/kibana_1.key
---------                     -------
     5694                     6 files
Installing the certificates for Elasticsearch
Now we're ready to install the keys and certificates in our Elasticsearch and Kibana instances.
Run the following commands:
unzip -d certs certs.zip
mkdir config/certs
cp ca/ca* certs/es_1/* config/certs
Which unzips the keys and certificates to a folder called certs in our elasticsearch directory, creates a certs directory under the config dir, and copies the relevant files for Elasticsearch.
Now, edit the Elasticsearch config, config/elasticsearch.yml, and add the following to enable SSL, set up the keys and certificate authority:
node.name: es_1
network.host: <HOST_ID>
xpack.security.http.ssl.enabled: true
xpack.security.transport.ssl.enabled: true
xpack.security.http.ssl.key: certs/es_1.key
xpack.security.http.ssl.certificate: certs/es_1.crt
xpack.security.http.ssl.certificate_authorities: certs/ca.crt
xpack.security.transport.ssl.key: certs/es_1.key
xpack.security.transport.ssl.certificate: certs/es_1.crt
xpack.security.transport.ssl.certificate_authorities: certs/ca.crt
discovery.seed_hosts: [ "<HOST_ID>" ]
cluster.initial_master_nodes: [ "es_1" ]
Replacing <HOST_ID> with either your hostname or the IP address. Save the config, then go back to the Elasticsearch tab and restart Elasticsearch (ctrl+C then ./bin/elasticsearch again), watching for the cluster to turn green:
[2021-03-24T10:07:21,234][INFO ][o.e.c.r.a.AllocationService] [es_1] Cluster health status changed from [RED] to [GREEN] (reason: [shards started [[.kibana-event-log-7.12.0-000001][0], [kibana_sample_data_ecommerce][0], [kibana_sample_data_flights][0]]]).
Our old command (curl --user kibana_system:ThisIsTooEasy "localhost:9200/?pretty") will no longer work; instead use the CA we created: curl --cacert ca/ca.crt --user kibana_system:ThisIsTooEasy "https://<HOST_ID>:9200/?pretty".
Installing the certificates for Kibana
We need to follow similar steps as above, starting with grabbing the keys and certs that we created. Switch back over to the Kibana tab (stop Kibana if you didn't earlier). If you're following along, we're in the ~/ELK/kibana directory, and the directory above it (~/ELK) also holds the elasticsearch directory, which is where our certs are. Run the following:
mkdir config/certs
cp ../elasticsearch/ca/ca.crt config/certs/
cp ../elasticsearch/certs/kibana_1/kibana_1.* config/certs/
Then verify with ls -l config/certs/ which should look like this:
~/ELK/kibana $ >ls -l config/certs/
total 12
-rw-r--r--  1 jamie  staff   1.2K Mar 24 13:36 ca.crt
-rw-r--r--  1 jamie  staff   1.1K Mar 24 13:36 kibana_1.crt
-rw-r--r--  1 jamie  staff   1.6K Mar 24 13:36 kibana_1.key
Finally, we need to add them to the Kibana configuration file, similar to how we did it for Elasticsearch. Open up config/kibana.yml and add the following:
server.name: "<HOST_ID>"
server.host: "<HOST_ID>"
server.ssl.enabled: true
server.ssl.certificate: config/certs/kibana_1.crt
server.ssl.key: config/certs/kibana_1.key
elasticsearch.hosts: ["https://<HOST_ID>:9200"]
elasticsearch.ssl.certificateAuthorities: [ "config/certs/ca.crt" ]
xpack.encryptedSavedObjects.encryptionKey: "something_at_least_32_characters"
Again replacing <HOST_ID> with your host ID. Save the configuration and start up Kibana again with ./bin/kibana, and you should see:
log [13:48:39.322] [info][listening] Server running at https://<HOST_ID>:5601
Recall that new HTTPS URL (which is now the <HOST_ID> instead of localhost) may be running against a self-signed certificate (unless you used a trusted authority), so you'll need to accept it (for example, with Safari, you'd click on show details, then visit the website, accept the prompt, and enter your credentials to proceed. If you're using Chrome you can add the CA, or just type thisisunsafe (you won't see the letters as you type) to bypass the warning. Once you're on the login screen enter the same username and password as before (elastic / ThisIsTooEasy).
What's next?
Now that you've got your Elastic Stack up and running you're ready to start your journey into observability. The next best step is to start centralizing your logs and infrastructure metrics. You can read the rationale behind infrastructure monitoring, or jump right in and start gathering metrics. Of course, if you'd rather run on a managed service you can sign up for a free trial of the Elasticsearch Service on Elastic Cloud.