Elastic APM 7.7.0 released with service maps, async profiler, and more
We are pleased to announce the release of Elastic APM 7.7.0 — available on the Elasticsearch Service, or when you download the Elastic Stack. This is a massive release for APM which brings a lot of exciting new features to the APM app, including service maps, inferred span support, alerting, agent central configuration, and custom links.
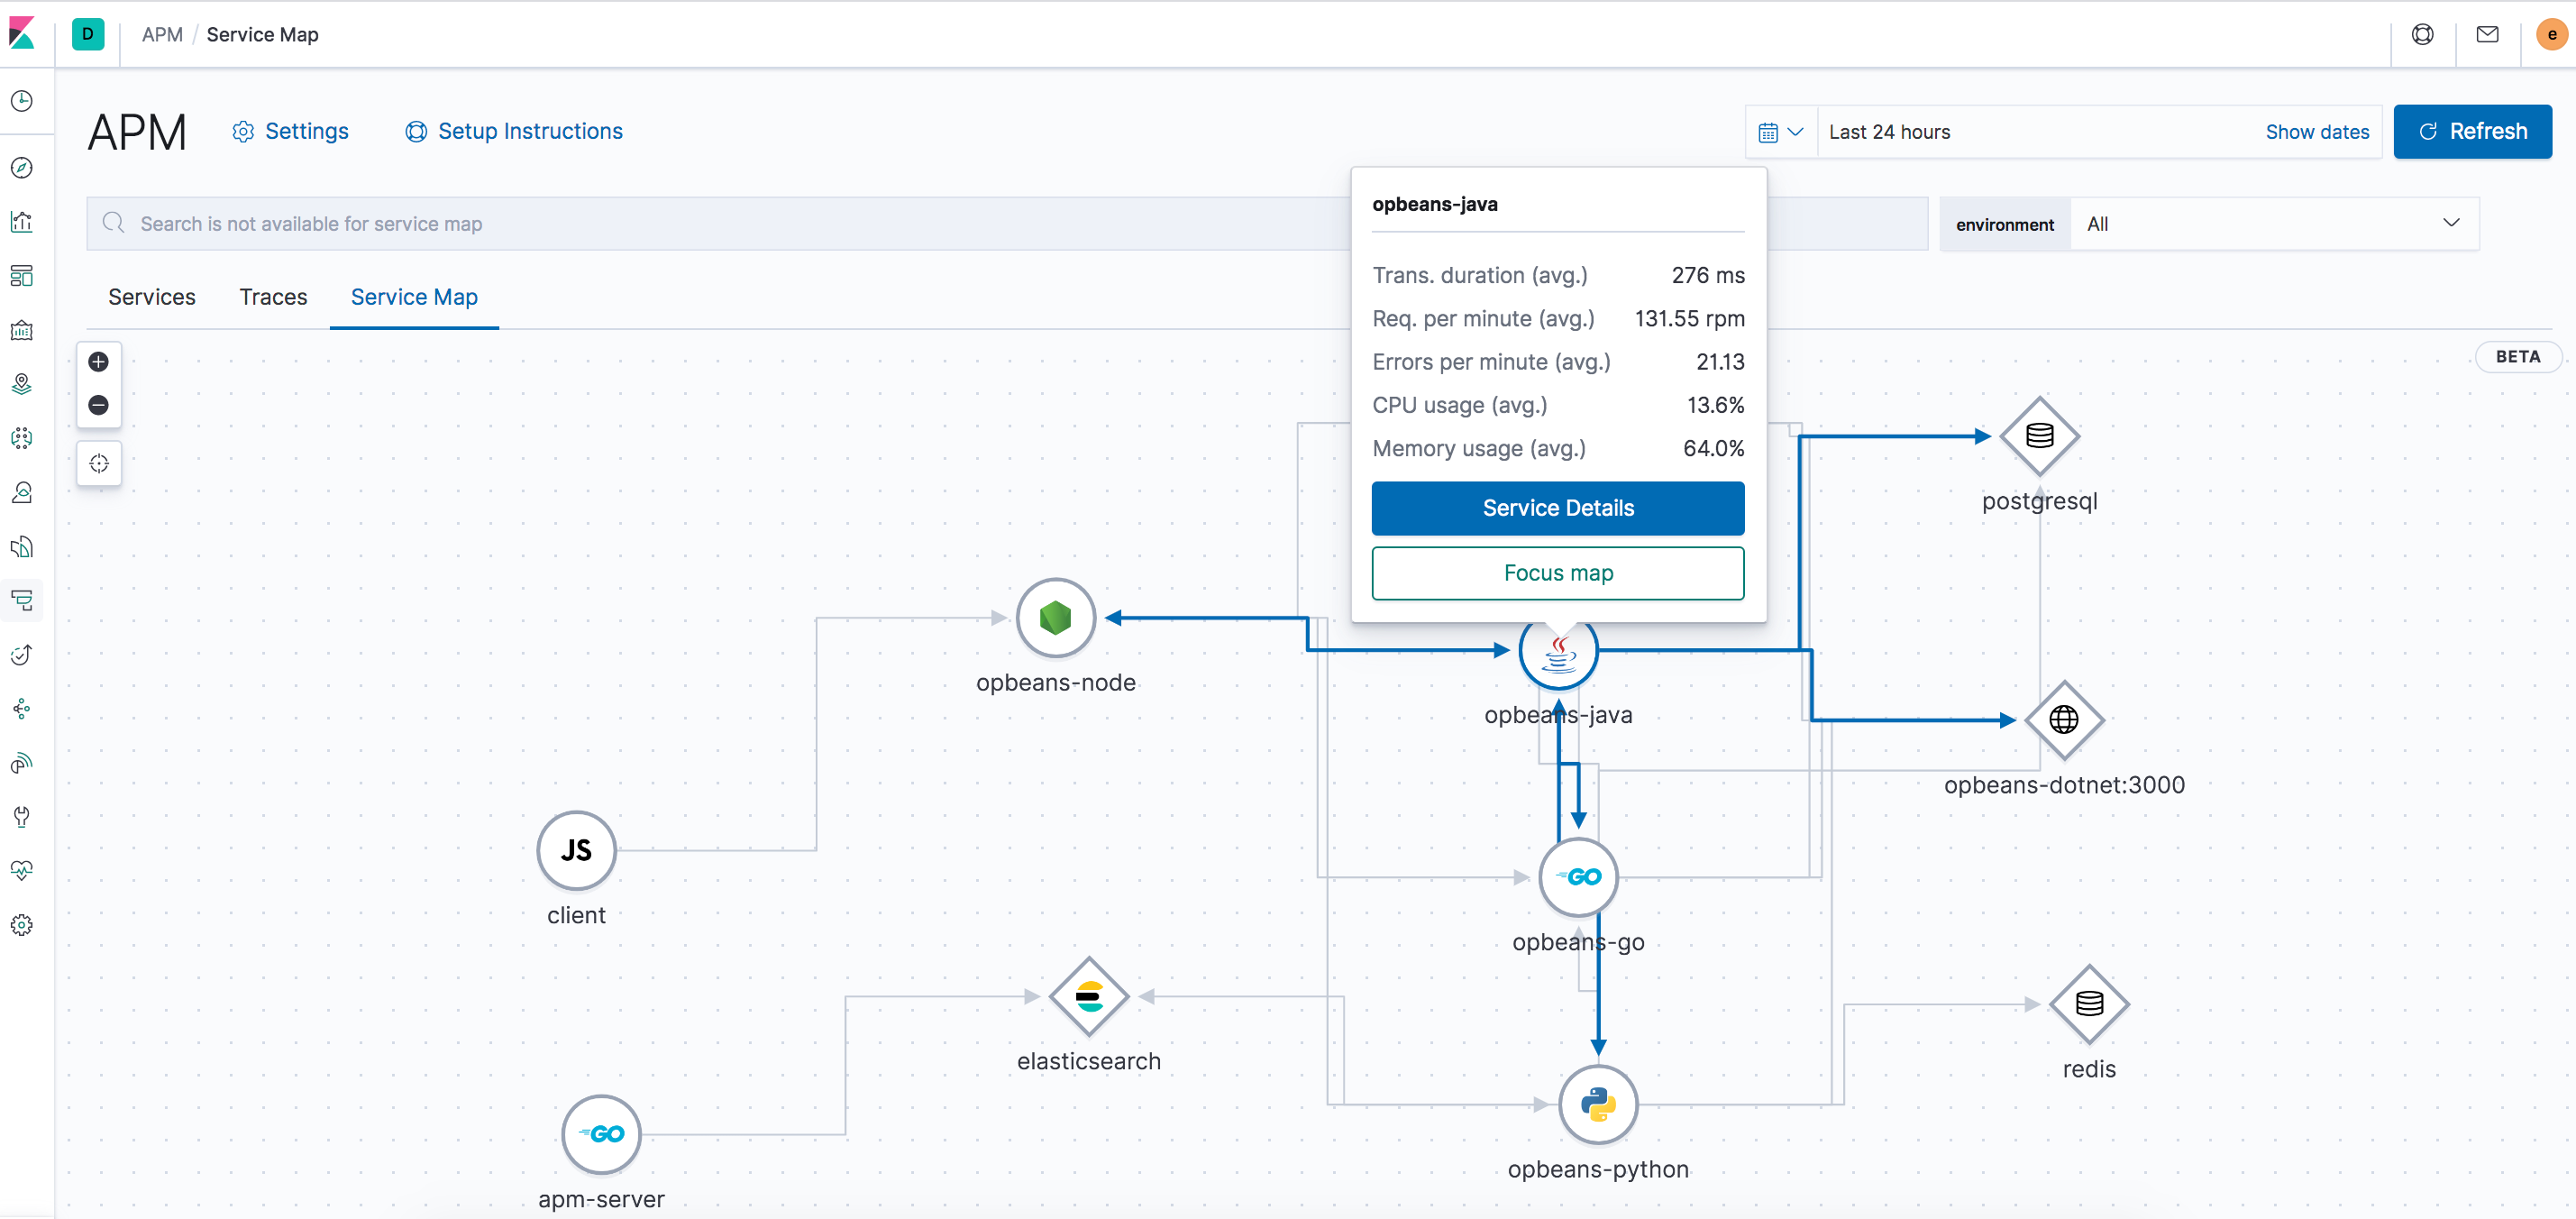
Service maps
Trying to do an impact analysis during an outage but don’t know where to look? Well, look no further! The 7.7 version of the stack release adds service maps as a beta feature to the Elastic APM app. This means that you have access to a real time, high-level view of all your Elastic instrumented services. You can easily leverage these maps to identify how your services are connected, what external services or databases your services might be calling, along with high-level metrics that can help you decipher the health of your services. This platinum-level feature is available from both a global (all Elastic instrumented services) and per-monitored-service level, giving you the flexibility to pick where you want to begin your troubleshooting journey. Service maps serve as a graphical requirement mapping of your services, allowing you to see the dependencies between your applications and services, internal and external, enabling you to identify connections that you didn't even know existed. As long as you are using supported agent versions in your application, you do not need to do anything to get started with maps. Check out our documentation to learn more!
Inferred spans with async profiler
Adding instrumentation to gain visibility into your services can be an iterative process that requires you to configure and specify everything you want visibility into upfront. In 7.7, our Java Agent now adds the capability to surface additional spans that show you granular method-level information about your services, greatly reducing that upfront instrumentation effort, while still greatly reducing time to diagnose the root cause of errors and slow performing code, even in complex systems. This capability is powered by a low overhead async profiler in the agent that can continuously run even in your production environments (Yes! You read that right!) and surface method-level insights. Check our blog post to learn all the awesomeness that is this feature.
Alerting
The 7.7 release also introduces turnkey integrations with Kibana alerting (in beta). This integration makes it super easy for you to configure your threshold alerts for your service response time or error rate with the click of a button. Click the alert you want to create, pick the actions you want to take when the alert is triggered, and you are done! When the thresholds are violated, you will be notified based on the action you picked while configuring.
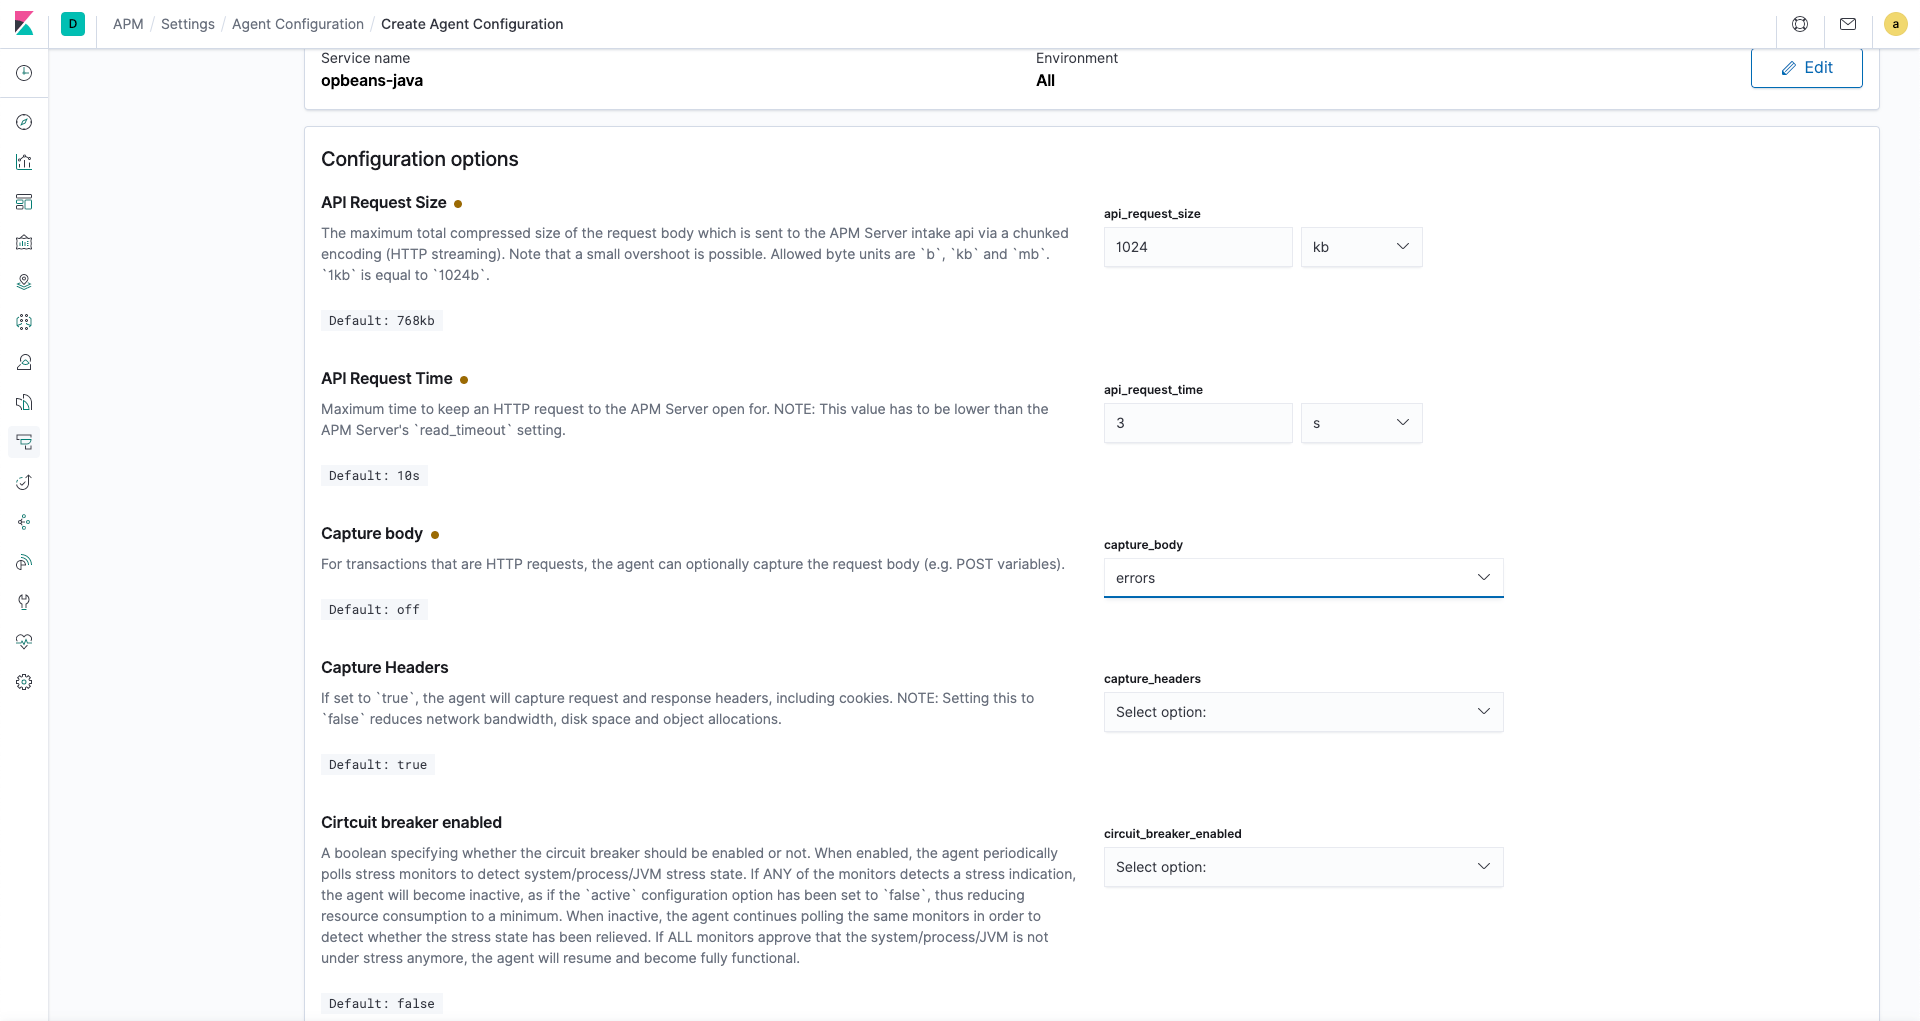
Agent central config
Managing agent configurations via YAML files is never easy. A small mistake (was that a tab or spaces?) in your YAML file can cause you to spin cycles debugging the file. With the 7.7 release, we have added the ability to configure most of the agent configuration properties in the APM app right in Kibana. The ability to configure these settings from Kibana allows you to easily edit an agent’s configuration without having to deal with individual agent configuration files. With a feedback indicator, you can also quickly identify if your changes have been applied to the selected services.
Custom links
With 7.7 we have also added a capability allowing you to create dynamic custom links based on your specific APM data. These custom links allow you to do things like populate GitHub or Jira issues or even link to another Kibana dashboard for further analysis. These custom links can be filtered to only appear in the APM app for relevant services, environments, transaction types, or transaction names. Check out our documentation for ideas and examples of how you could leverage this feature to streamline your workflows.
Try it out!
You can access the 7.7.0 Elastic APM app on the Elasticsearch Service on Elastic Cloud, or you can download the Elastic Stack. Grab the APM Server (or leverage the one included with an Elasticsearch Service account), instrument your applications with the APM agents, and start monitoring your applications.