Why metrics, logs, and traces aren’t enough
Unlock the full potential of your observability stack with continuous profiling


 Share on Twitter
Share on Twitter

 Share on LinkedIn
Share on LinkedIn

 Share on Facebook
Share on Facebook

 Share by Email
Share by Email

 Print this page
Print
Identifying performance bottlenecks and wasteful computations can be a complex and challenging task, particularly in modern cloud-native environments.
As the complexity of cloud-native environments increases, so does the need for effective observability solutions. Organizations typically rely on the established three pillars of observability –– metrics, logs, and traces –– to improve the reliability and performance of their applications and infrastructure. While the pillars are valuable for observability, they are not enough on their own.
In this blog post, we will discuss why continuous profiling signals are a must-have in your observability toolbox, and how they complement metrics, logs, and traces. In addition, we will also discuss why it is crucial to consolidate all four observability signals in a unified platform, as opposed to dispersed, siloed tools.
What are the different types of observability signals?
Before we go into more detail, let’s briefly describe the four types of observability signals and their common use cases.
Profiles: Profiles (also referred to as profiling signals in this blog post) are stacktraces that provide a detailed view of where a code spends resources, typically CPU cycles or memory. They provide an overview of the most expensive areas of a system, down to a single line of code.
Metrics: Metrics are numerical values that represent the state or performance of a system at a particular point in time. They are used to monitor health, identify trends, and trigger alerts.
Logs: Logs are records of events and messages emitted by a system. They provide insights into system behavior and help identify issues.
Traces: Traces are detailed records of a request's path through a system. They are used to understand dependencies and interactions between system components.
When are metrics, logs, and traces not enough?
Observability is more than just monitoring your system; it is about gaining a comprehensive understanding of it — this is measured by how well practitioners can answer the “why” questions. To effectively understand a system, however, developers, SREs, and CloudOps engineers need granular visibility of where compute resources are spent across their entire fleet, including the unknown-unknowns that may be lurking beneath the surface. This is where profiling (in production) becomes a crucial signal in your observability stack.
Metrics, logs, and traces all have their own unique strengths in providing insight into the performance of a system, but profiling offers a deeper level of visibility that goes beyond what these other signals can provide. Profiles allow for the identification of even the most obscure issues, such as those related to data structures and memory allocation, as well as code visibility at the kernel and userspace level.
Put another way, metrics, logs, and traces are analogous to measuring and monitoring the vital signs of the human body — they provide general information about health and performance, such as body temperature, weight, and heart rate, including records of events leading to symptoms. But profiling is like taking an X-ray — it allows you to see the inner workings of the body and understand how different systems interact, giving more detailed information and potentially identifying issues that would not be visible just by looking at macro-level indicators.
Further, profiling provides unprecedented breadth and depth of visibility that unlocks the ability to surface unknown-unknowns of your system. This deeper level of system-wide visibility enables users to ditch the guesswork; it opens up the ability to quickly get to the heart of the “why” questions –– why are we spending x% of our CPU budget on function y? Why is z happening? What is the most expensive function across our entire fleet?
Elastic Universal ProfilingTM extends the benefits of profiling to the DevFinOps persona by providing a better understanding of how specific lines of code are impacting their cloud costs and carbon footprint. They can identify specific areas where resources are being wasted and take action to optimize and reduce costs, as well as reduce the environmental impact of their application. This ultimately results in cost savings and a reduction in the carbon footprint of their organization.
To summarize, in most scenarios, metrics and traces provide visibility into the known-unknowns of a system. Logs, on the other hand, provide visibility into the known-knowns of a system. Together, the three pillars of observability provide macro-level visibility into the system. Observability without profiling leaves a significant gap in visibility, as there are always unknown-unknowns in any system. Profiling signals close that gap by providing micro-level visibility into a system –– this level of visibility is a must-have in modern cloud-native environments.
The next section dives deeper into the unknown-unknown concept using the Johari Window framework.
What is the relationship between the Johari Window framework and observability?
The Johari Window framework was developed by Joseph Luft and Harry Ingham, and it is widely adopted by professionals in national defense and risk management to access and evaluate threats and risks.1 According to the framework, the knowledge of a system can be categorized into known-knowns, known-unknowns, and unknown-unknowns.
Observability is anchored on the collection and analysis of data to gain knowledge of a system, so we can utilize the Johari Window framework to classify observability signals as follows:
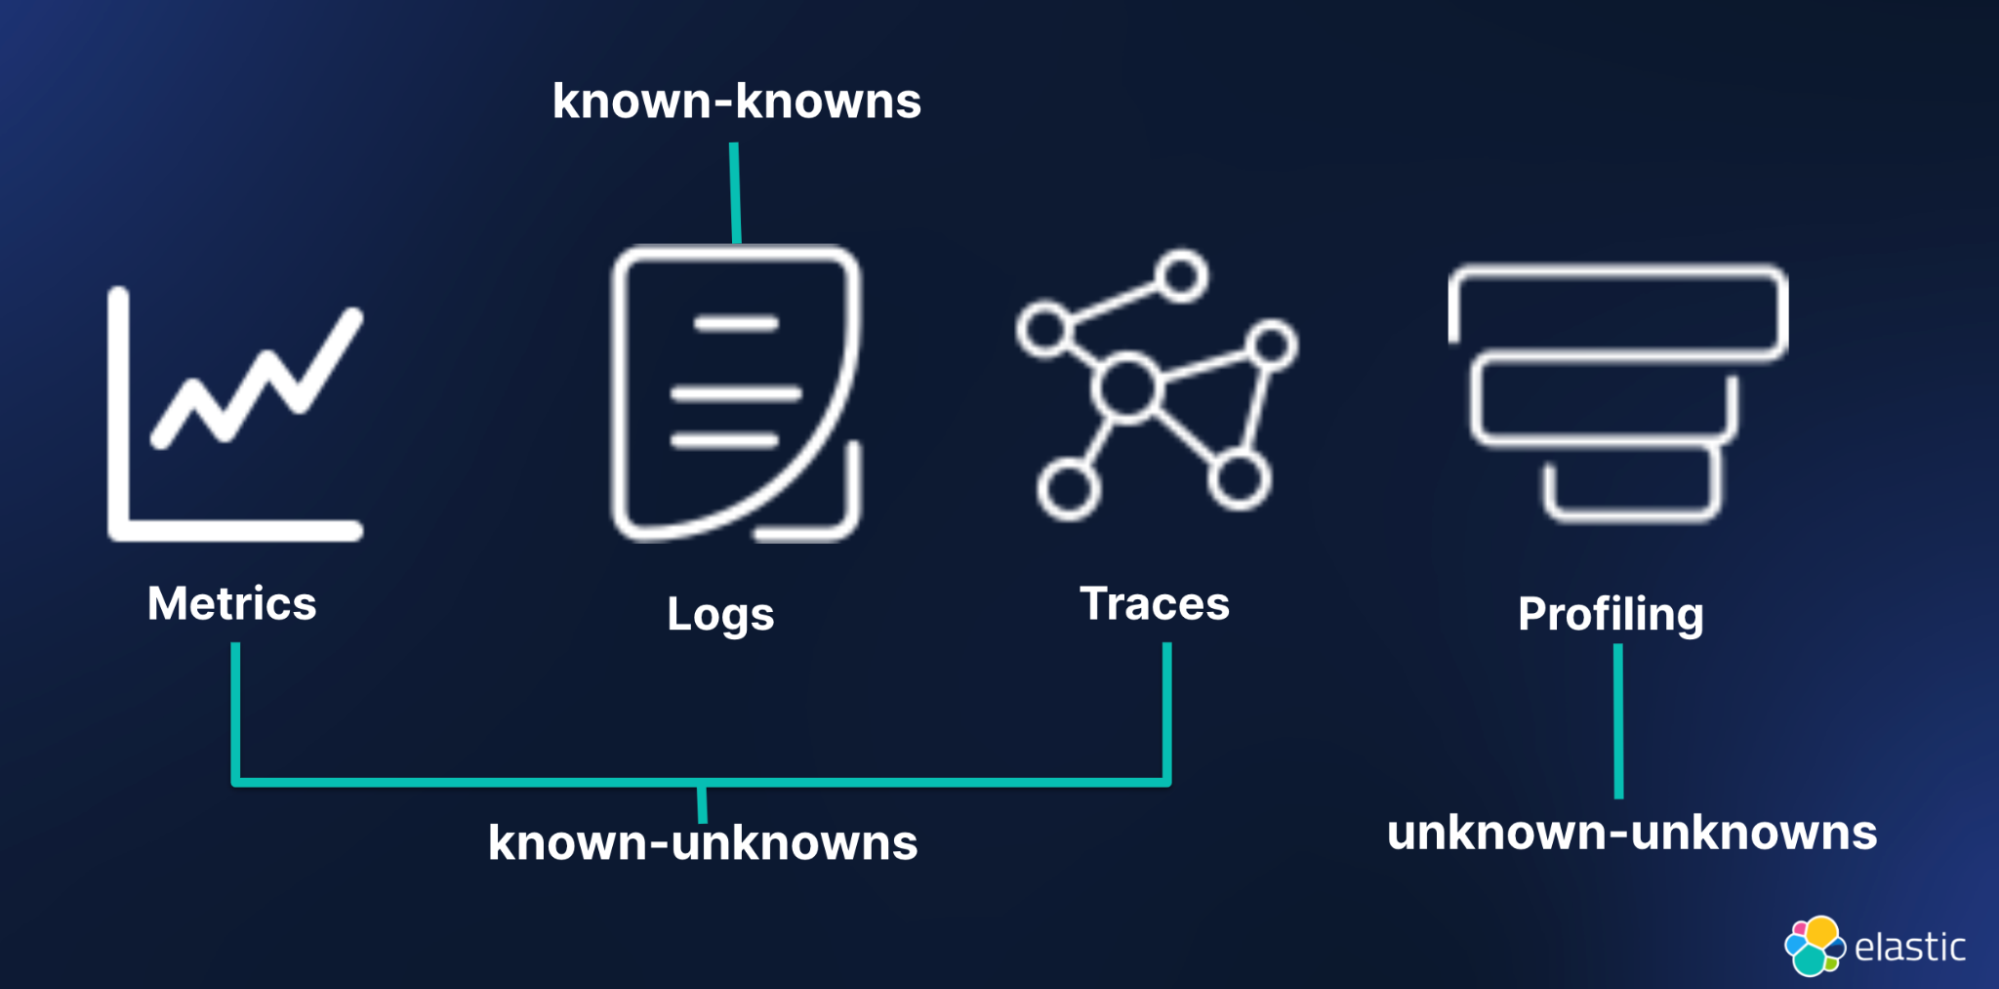
- Known-knowns are things that we are aware of and understand. This is related to logs in observability. You have to know it to log it.
- Known-unknowns are the things that we are aware we don't know, but that we can potentially discover through further investigation. This is related to traces and metrics in observability. For example, metrics allow us to monitor predefined measurements, such as average-response-time and calls-per-minute, while traces help us investigate how a specific request traverses the system.
- Unknown-unknowns are the things that we don't even know we don't know and that remain invisible until their impact manifests. This is similar to the Black Swan theory in software engineering.2 Observability practitioners need profiling signals to unearth unknown-unknowns.
To sum it up, metrics, logs, and traces offer a broad overview of a system, while profiling signals give a more detailed, fine-grained view of the system's inner workings. This deeper level of visibility can help identify issues more quickly and improve mean-time-to-detect (MTTD).
Better together: observability with profiling
Solely relying on profiling or the three pillars of observability alone is not enough.
To optimize the benefits of observability, it's essential to use all four forms of signals –– metrics, logs, traces, and profiles –– together in a unified platform. This gives practitioners a comprehensive understanding of their environments and equips them to answer the why, what, where, and when questions using a single correlated source of truth. In addition, to maximize ROI, organizations must have an efficient observability strategy that consolidates all observability signals in a single platform.
Tool proliferation is a significant problem in observability.3 According to Gartner, many organizations utilize numerous tools across distributed teams to monitor various parts of their stack, resulting in siloed data, higher costs, and longer mean time to detect and repair issues (MTTD and MTTR).
Elastic Observability solves this problem by unifying your metrics, logs, traces, and now profiles in a unified pane. To this end, Elastic Universal Profiling (in beta) is now a first-class citizen of the Elastic Observability suite –– with a relentless focus on creating tighter integration with metrics, logs, and traces.
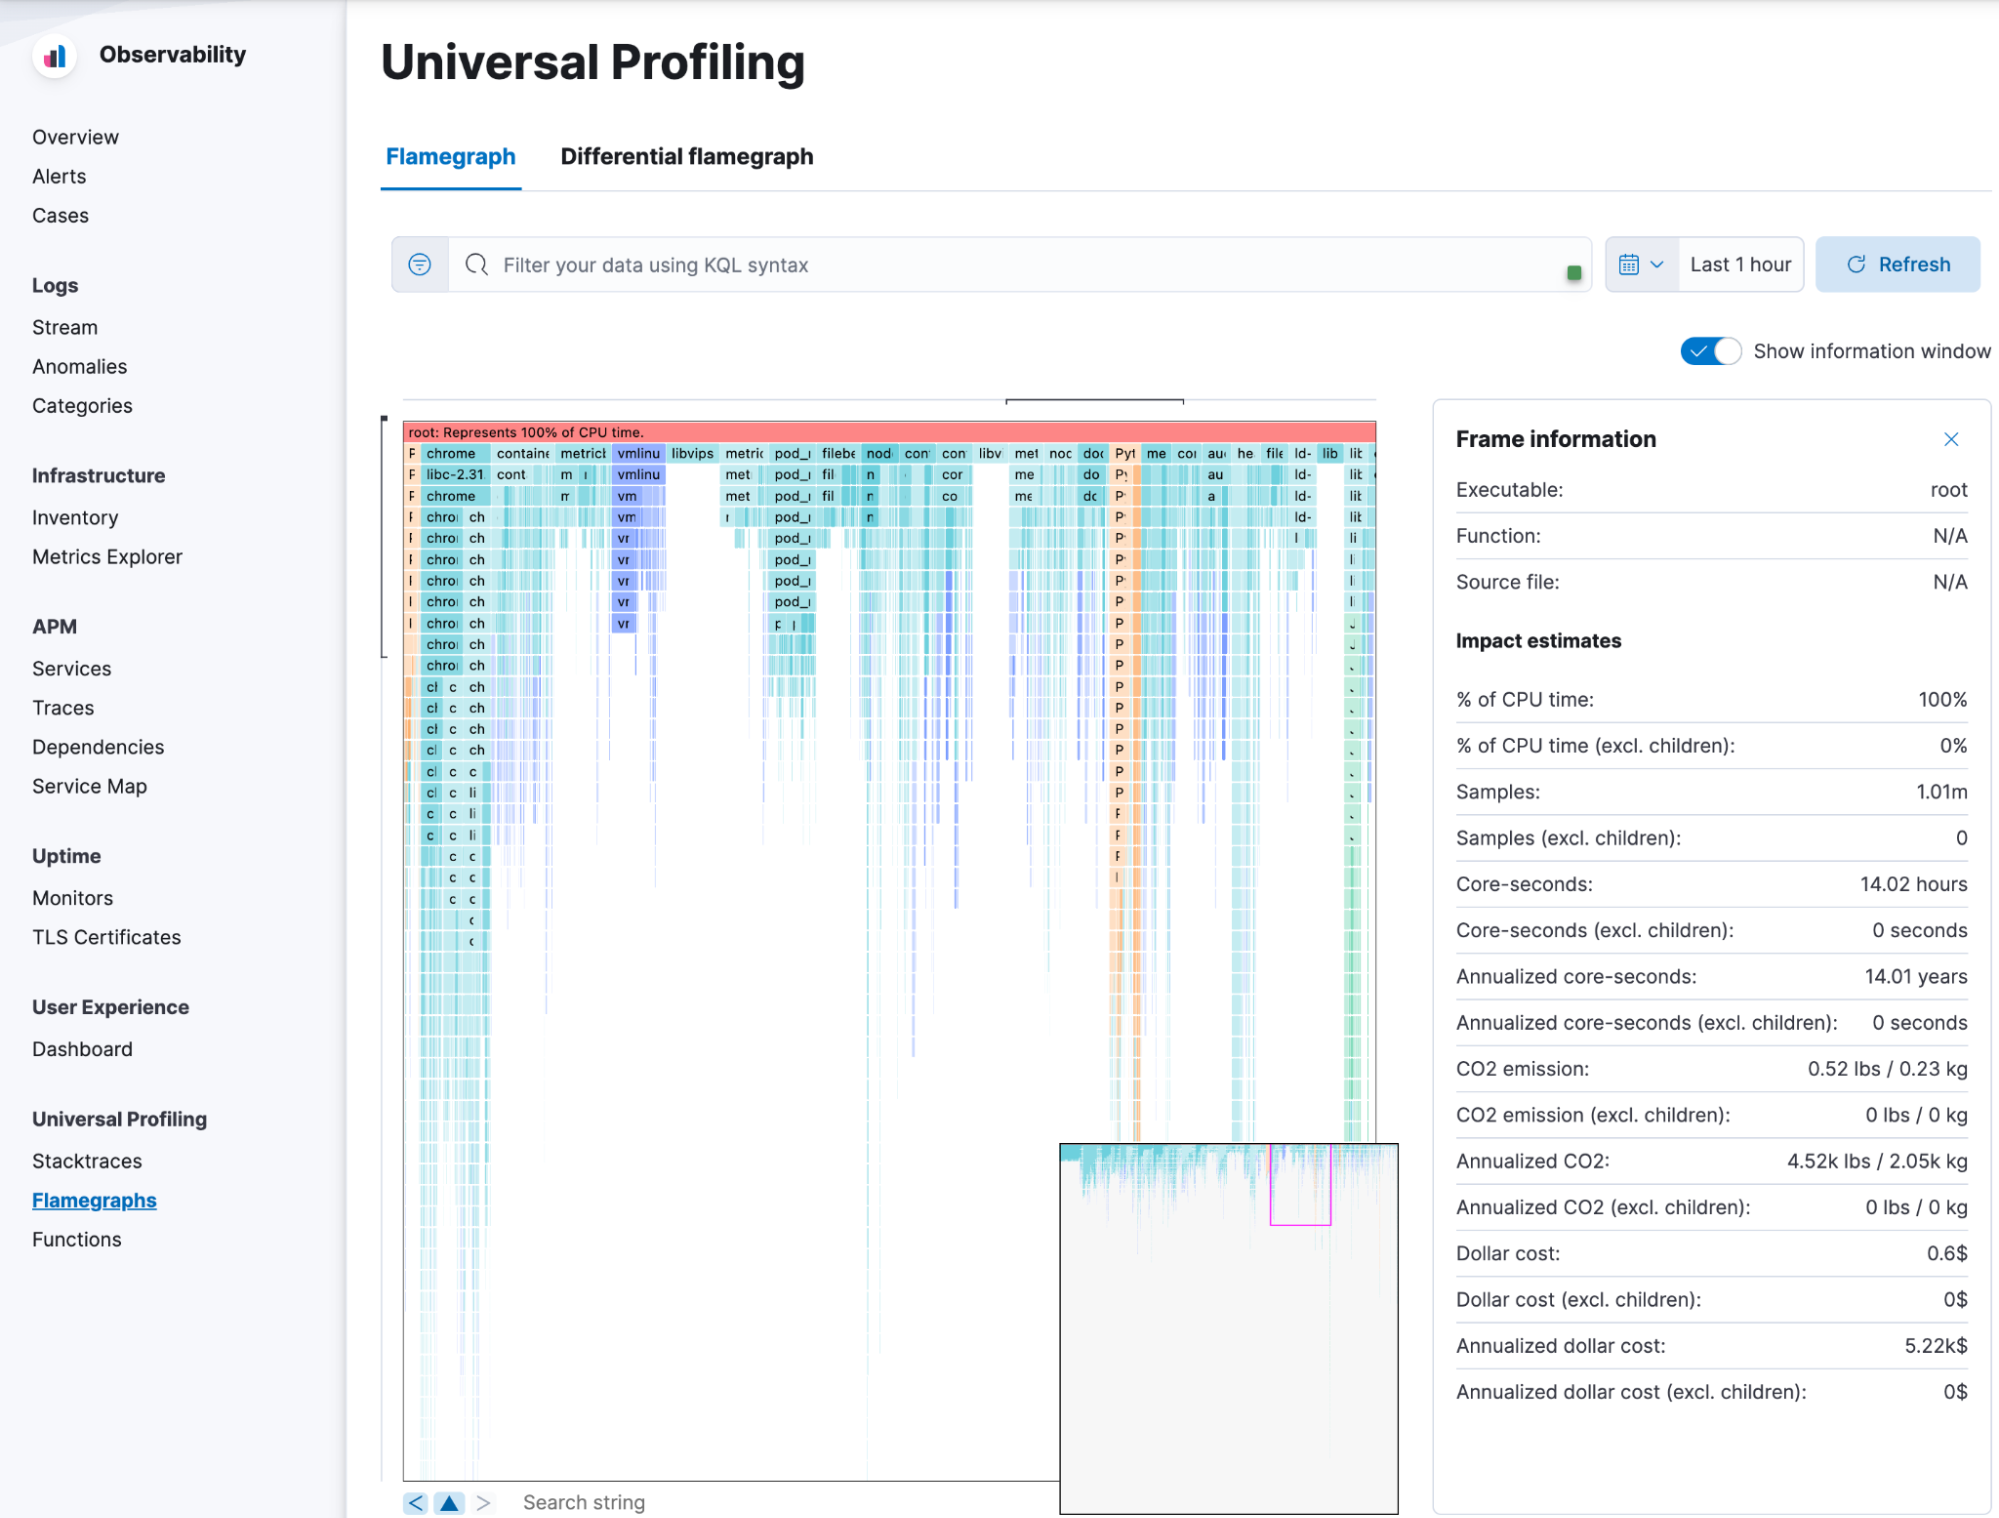
Elastic Observability and Universal Profiling
Elastic Universal Profiling provides fleet-wide, whole-system continuous profiling.
Universal Profiling is lightweight and requires zero instrumentation. Enabled by eBPF, it overcomes the limitations of other profiling solutions by requiring no changes to the application code, making it easier to quickly identify performance bottlenecks, reduce cloud cost, and improve MTTR and MTTD.
The low overhead of Universal Profiling consumes less than 1% CPU on average, making it possible to deploy in production environments to deliver deep and broad visibility into infrastructure and cloud-native environments at scale.
For a production application running across a few hundred servers, early results show code optimization savings of 10%–20% of CPU resources, resulting in cost savings and a reduction of CO2 emissions per year.
Universal Profiling delivers unprecedented visibility into systems
In conclusion, observability is about understanding a system, not just monitoring it. To achieve this understanding, practitioners must use metrics, logs, traces, and profiles in a unified observability solution. Metrics, logs, and traces are not enough on their own. You need continuous profiling. Profiling signals, like a magnifying glass, provide granular visibility into the unknown-unknowns of a system to answer the "why" questions and fill the gap left by the other signals.
A comprehensive observability strategy must cater to all four signals in a unified platform. Elastic Observability solves the monitoring tool sprawl problems by providing a unified pane for metrics, logs, traces, and continuous profiling.
Join the beta program for Universal Profiling now by signing up today.
Share
- Share on Twitter
Share on Twitter
- Share on LinkedIn
Share on LinkedIn
- Share on Facebook
Share on Facebook
- Share by Email
Share by Email
- Print this page
Print