Service maps
editService maps
editThis functionality is in beta and is subject to change. The design and code is less mature than official GA features and is being provided as-is with no warranties. Beta features are not subject to the support SLA of official GA features.
Service map support for Internet Explorer 11 is extremely limited. Please use Chrome or Firefox if available.
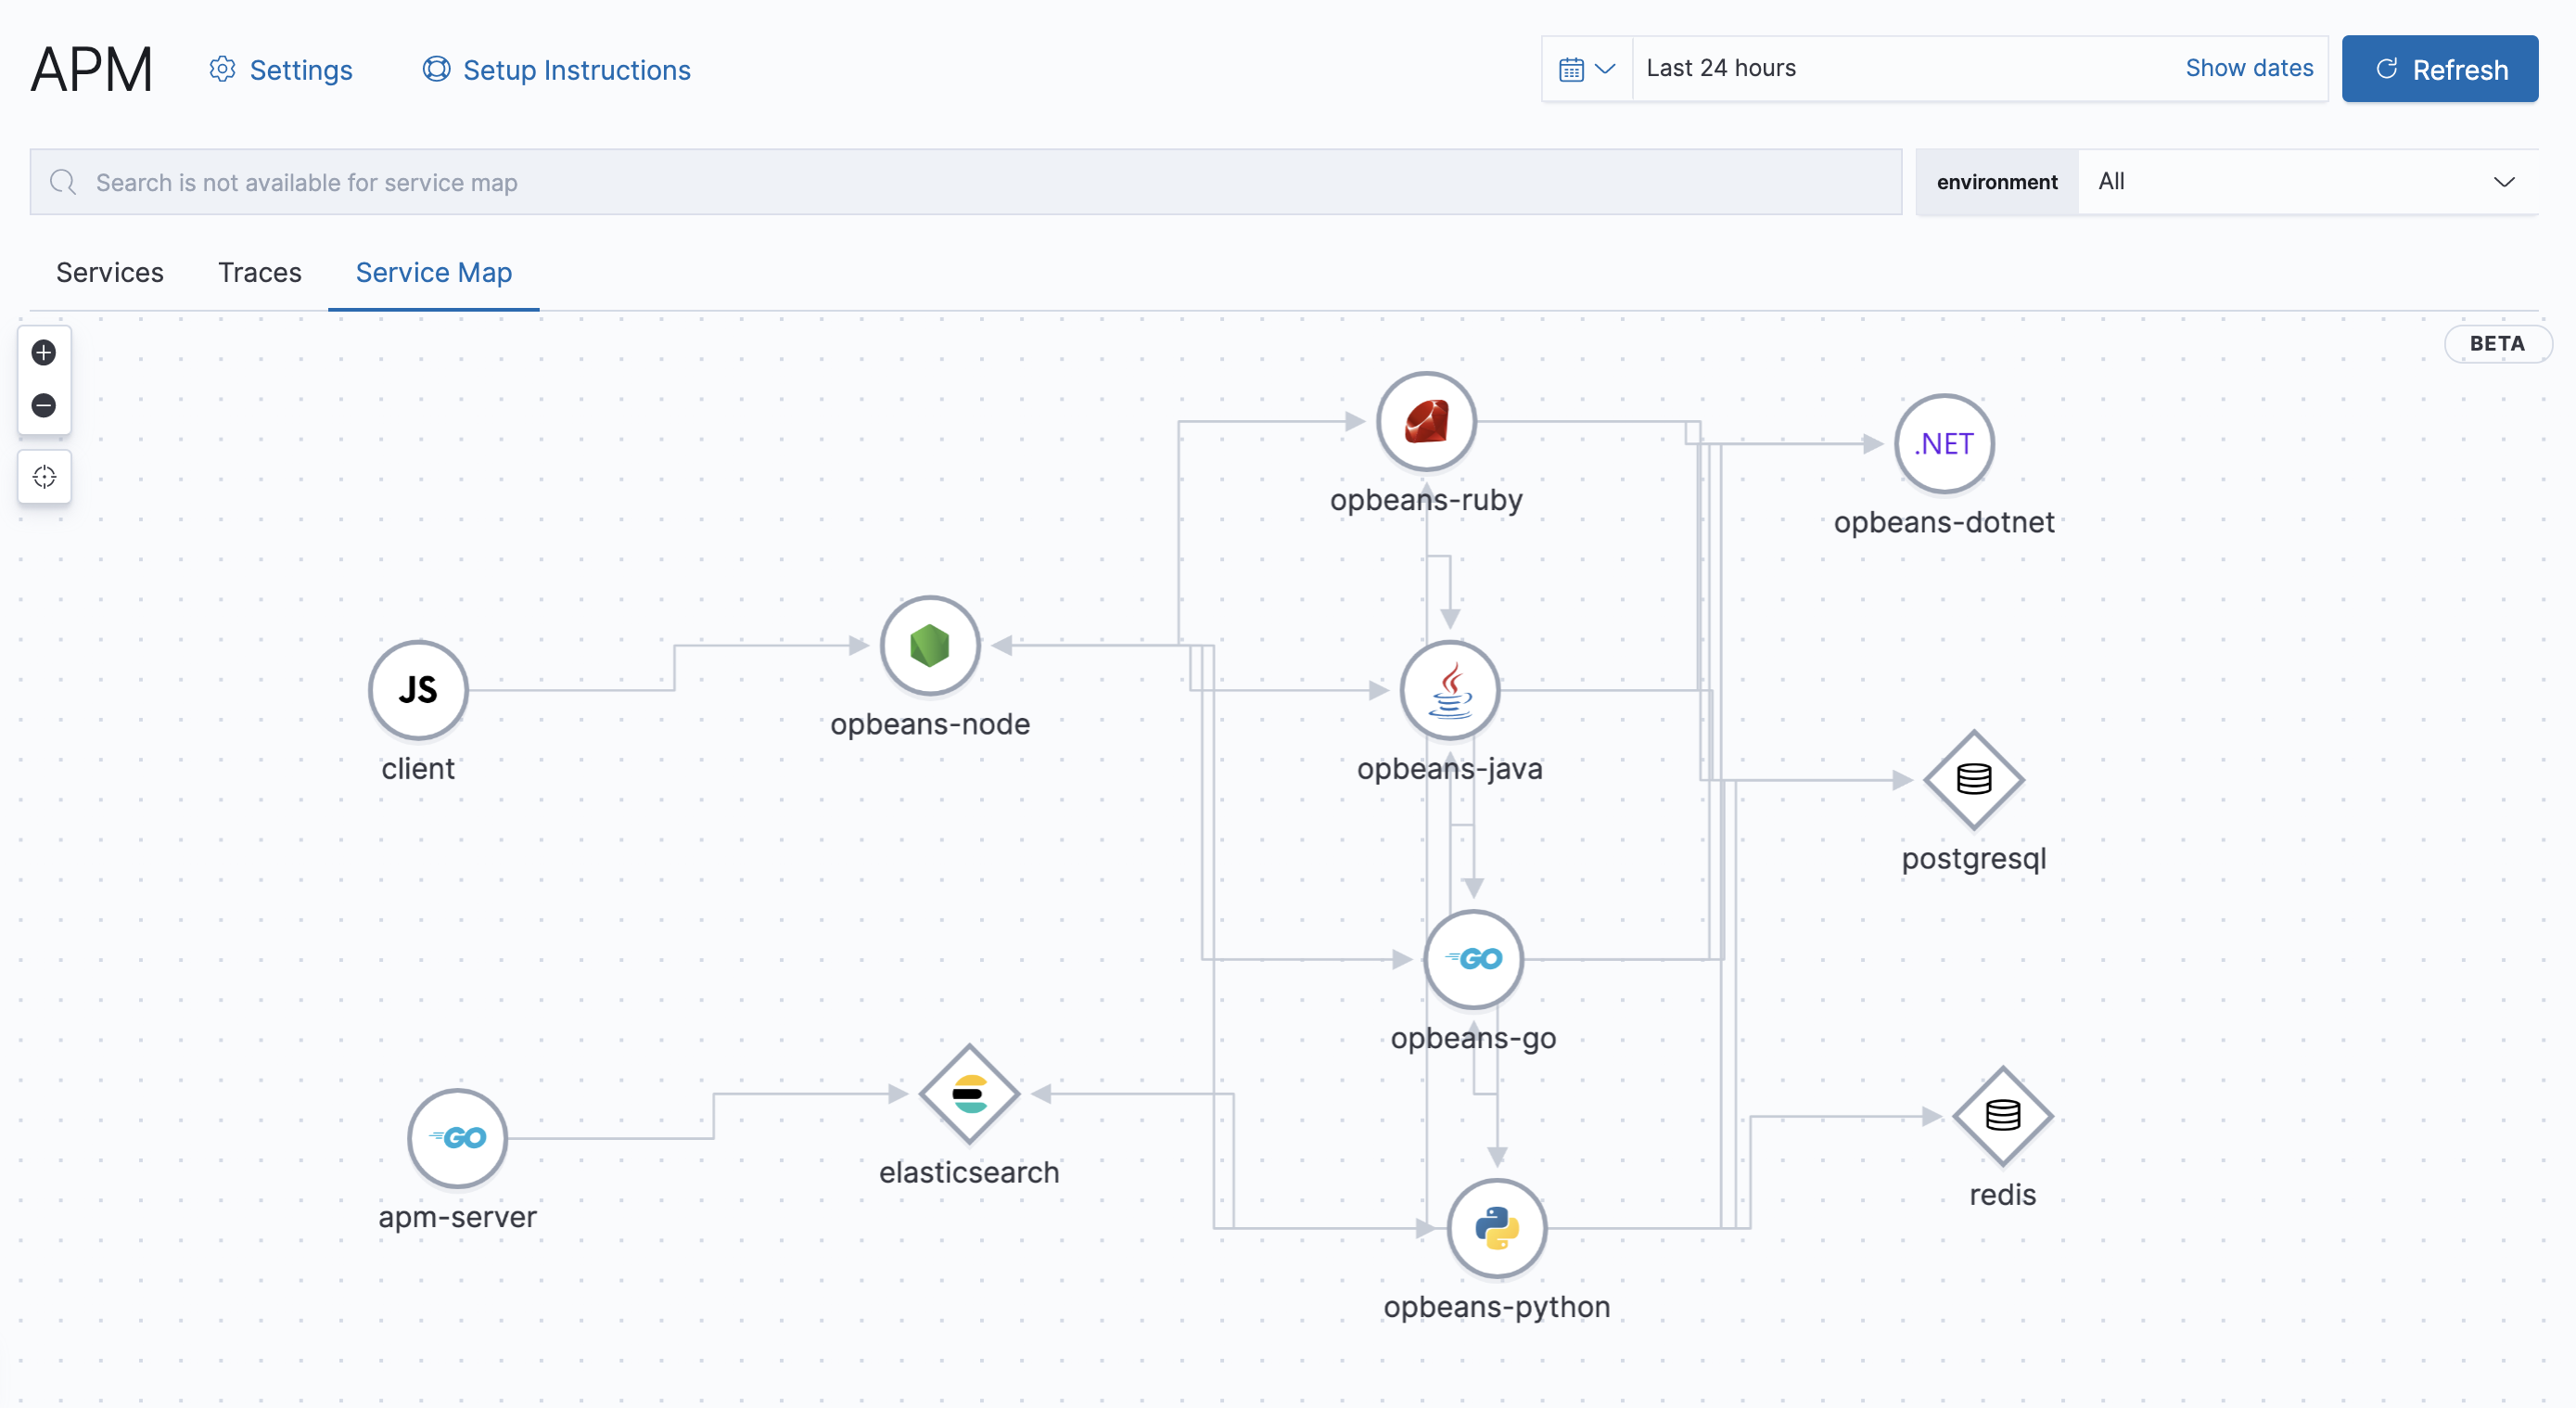
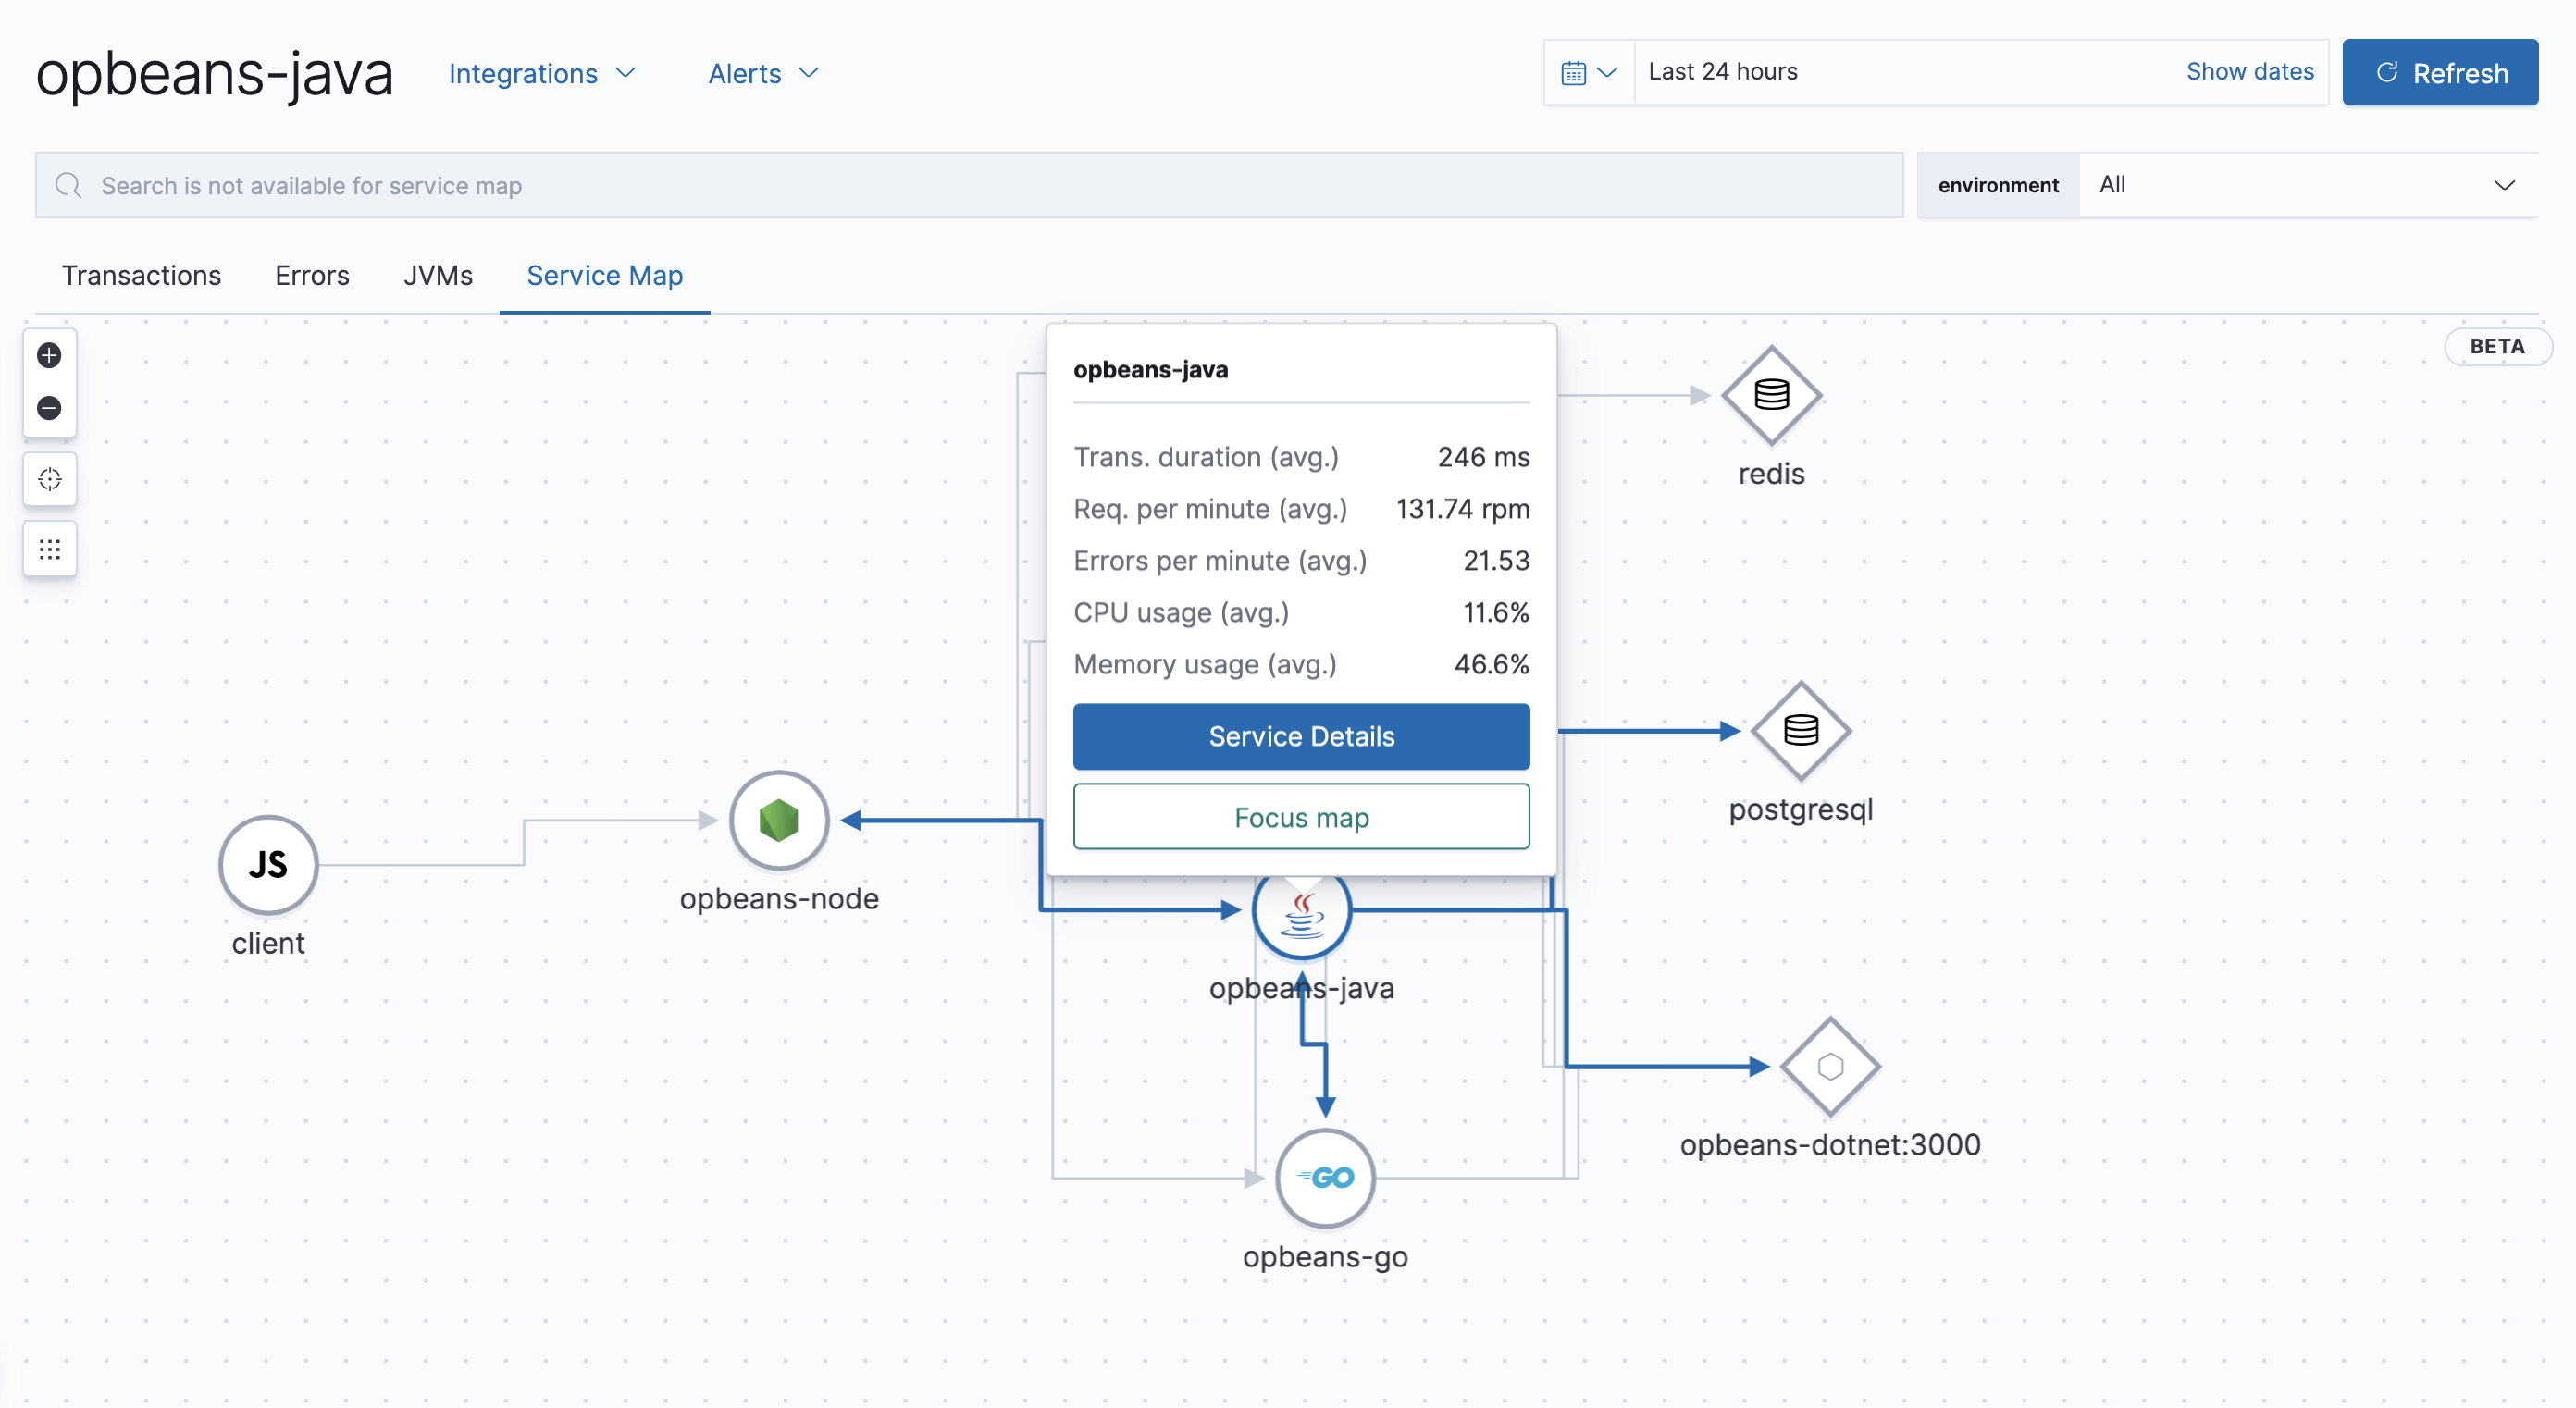
A service map is a real-time visual representation of the instrumented services in your application’s architecture. It shows you how these services are connected, along with high-level metrics like average transaction duration, requests per minute, and errors per minute, that allow you to quickly assess the status of your services.
We currently surface two types of service maps:
- Global: All services instrumented with APM agents and the connections between them are shown.
- Service-specific: Highlight connections for a selected service.
How do service maps work?
editService maps rely on distributed traces to draw connections between services.
As distributed tracing is enabled out-of-the-box for supported technologies, so are service maps.
However, if a service isn’t instrumented,
or a traceparent header isn’t being propagated to it,
distributed tracing will not work, and the connection will not be drawn on the map.
Visualize your architecture
editSelect the Service Map tab to get started. By default, all instrumented services and connections are shown. Whether you’re onboarding a new engineer, or just trying to grasp the big picture, click around, zoom in and out, and begin to visualize how your services are connected.
If there’s a specific service that interests you, select that service to highlight its connections. Clicking Focus map will refocus the map on that specific service and lock the connection highlighting. From here, select Service Details, or click on the Transaction tab to jump to the Transaction overview for the selected service. You can also use the tabs at the top of the page to easily jump to the Errors or Metrics overview.
Filter out your maps by picking the environment from the environment drop-down filter.
This can be useful if you have two or more services, in separate environments, but with the same name.
Use the environment drop-down to only see the data you’re interested in, like dev or production.
Additional filters are not currently available for service maps.
Legend
editNodes appear on the map in one of two shapes:
- Circle: Instrumented services. Interior icons are based on the language of the agent used.
-
Diamond: Databases, external, and messaging. Interior icons represent the generic type,
with specific icons for known entities, like Elasticsearch.
Type and subtype are based on
span.type, andspan.subtype.
Supported APM Agents
editService maps are supported for the following Agent versions:
|
Go Agent |
>= v1.7.0 |
|
Java Agent |
>= v1.13.0 |
|
.NET Agent |
>= v1.3.0 |
|
Node.js Agent |
>= v3.6.0 |
|
Python Agent |
>= v5.5.0 |
|
Ruby Agent |
>= v3.6.0 |
|
Real User Monitoring (RUM) Agent |
>= v4.7.0 |