

Finance, Sales, and Marketing
Canvas is a data visualization and presentation tool that allows you to pull live data from Elasticsearch, then combine the data with colors, images, text, and your imagination to create dynamic, multi-page, pixel-perfect displays. If you are a little bit creative, a little bit technical, and a whole lot curious, then Canvas is for you.
Voir des démos similaires
Search
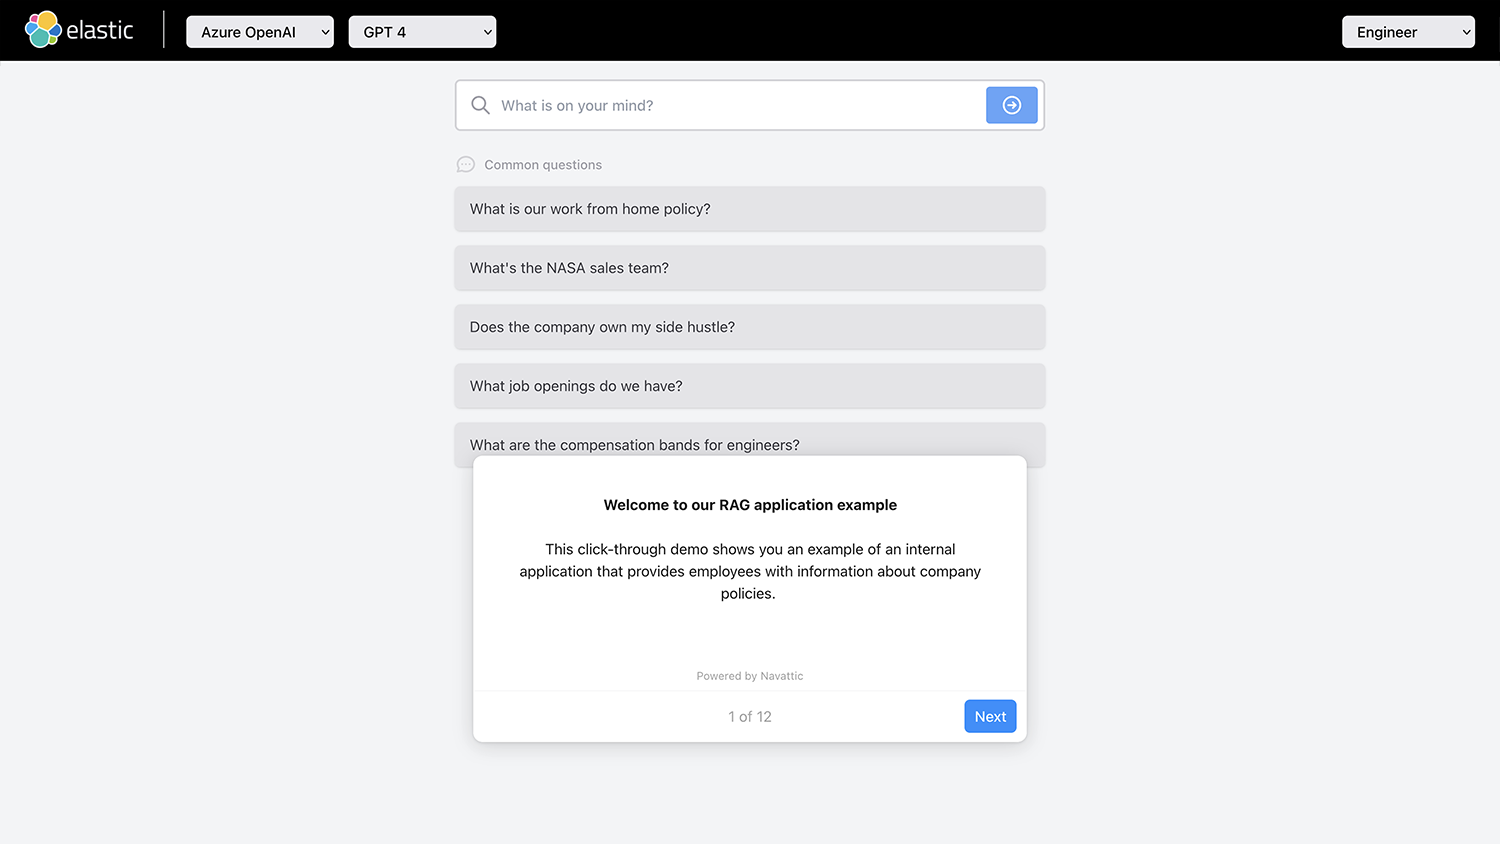
Building generative AI applications with retrieval augmented generation (RAG)
See first-hand how RAG workflows use your proprietary data to provide critical context to your generative AI experiences. This click-through demo shows you an example of an internal application that provides employees with information about company policies.
Observability
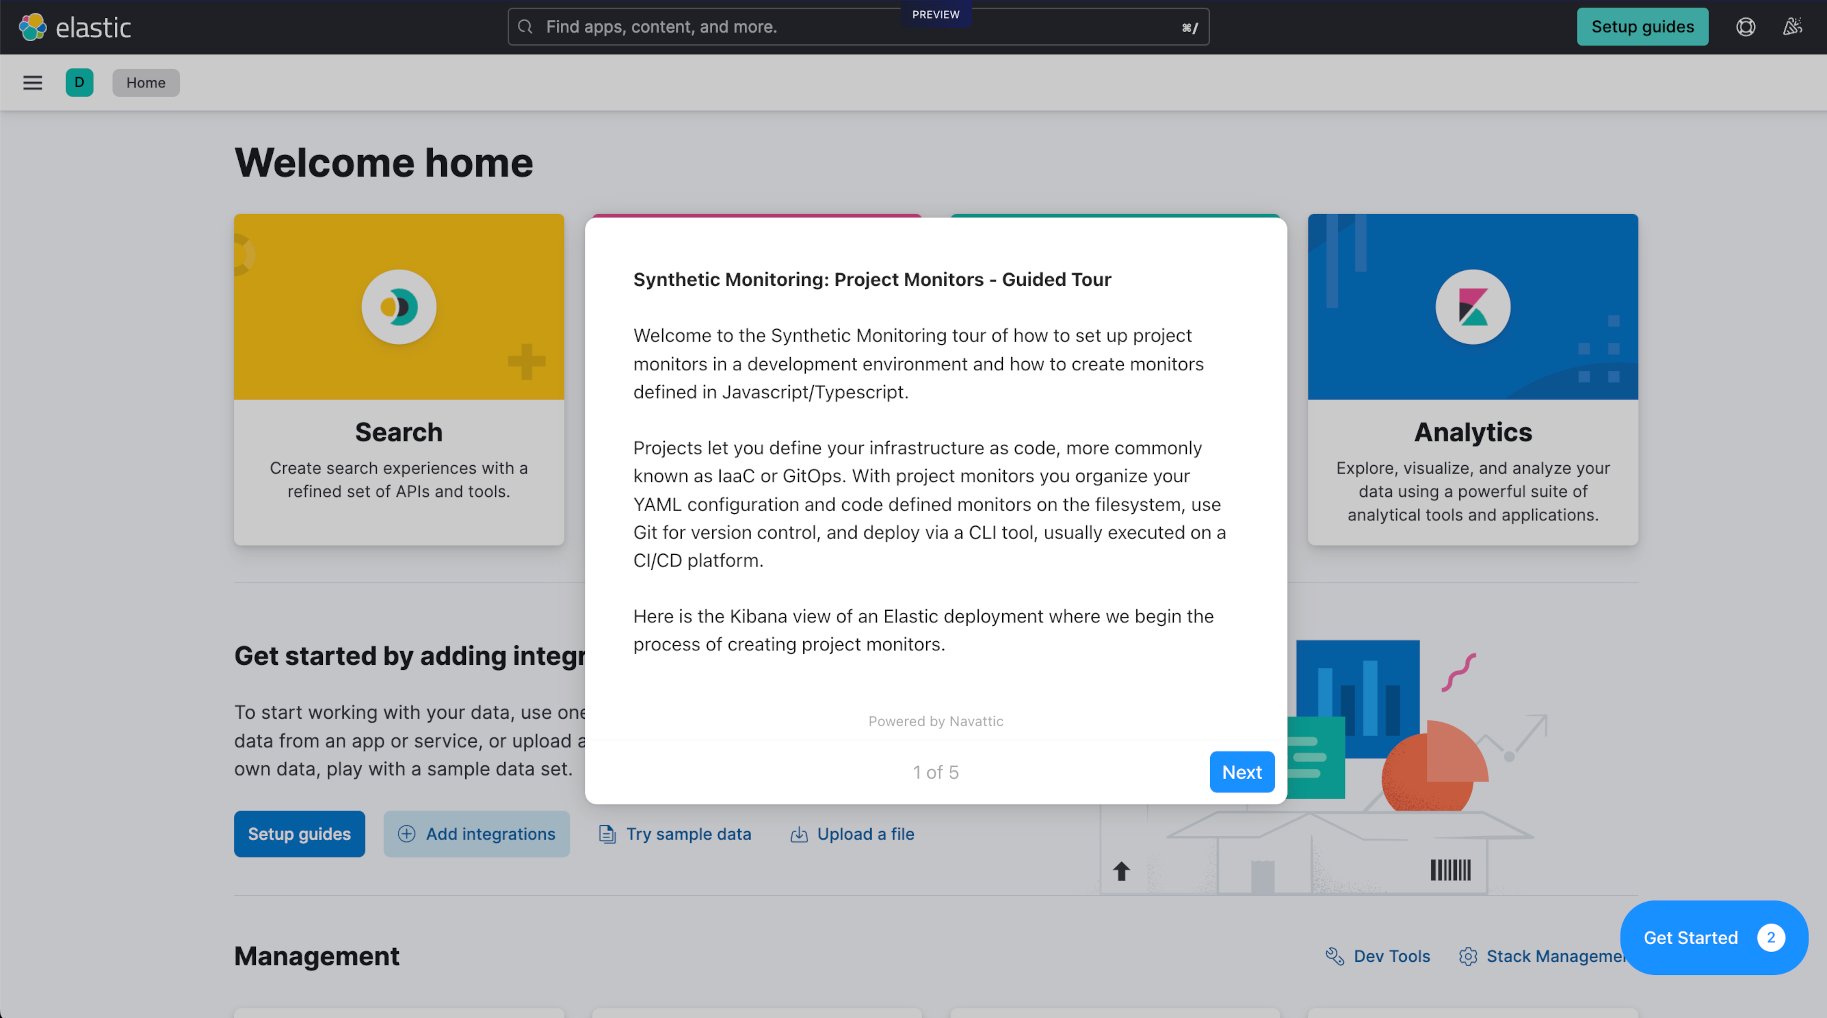
Synthetic Monitoring - Project Monitors
See a click-through tour of how to set up project monitors in a development environment and how to create monitors defined in Javascript/Typescript.
Platform
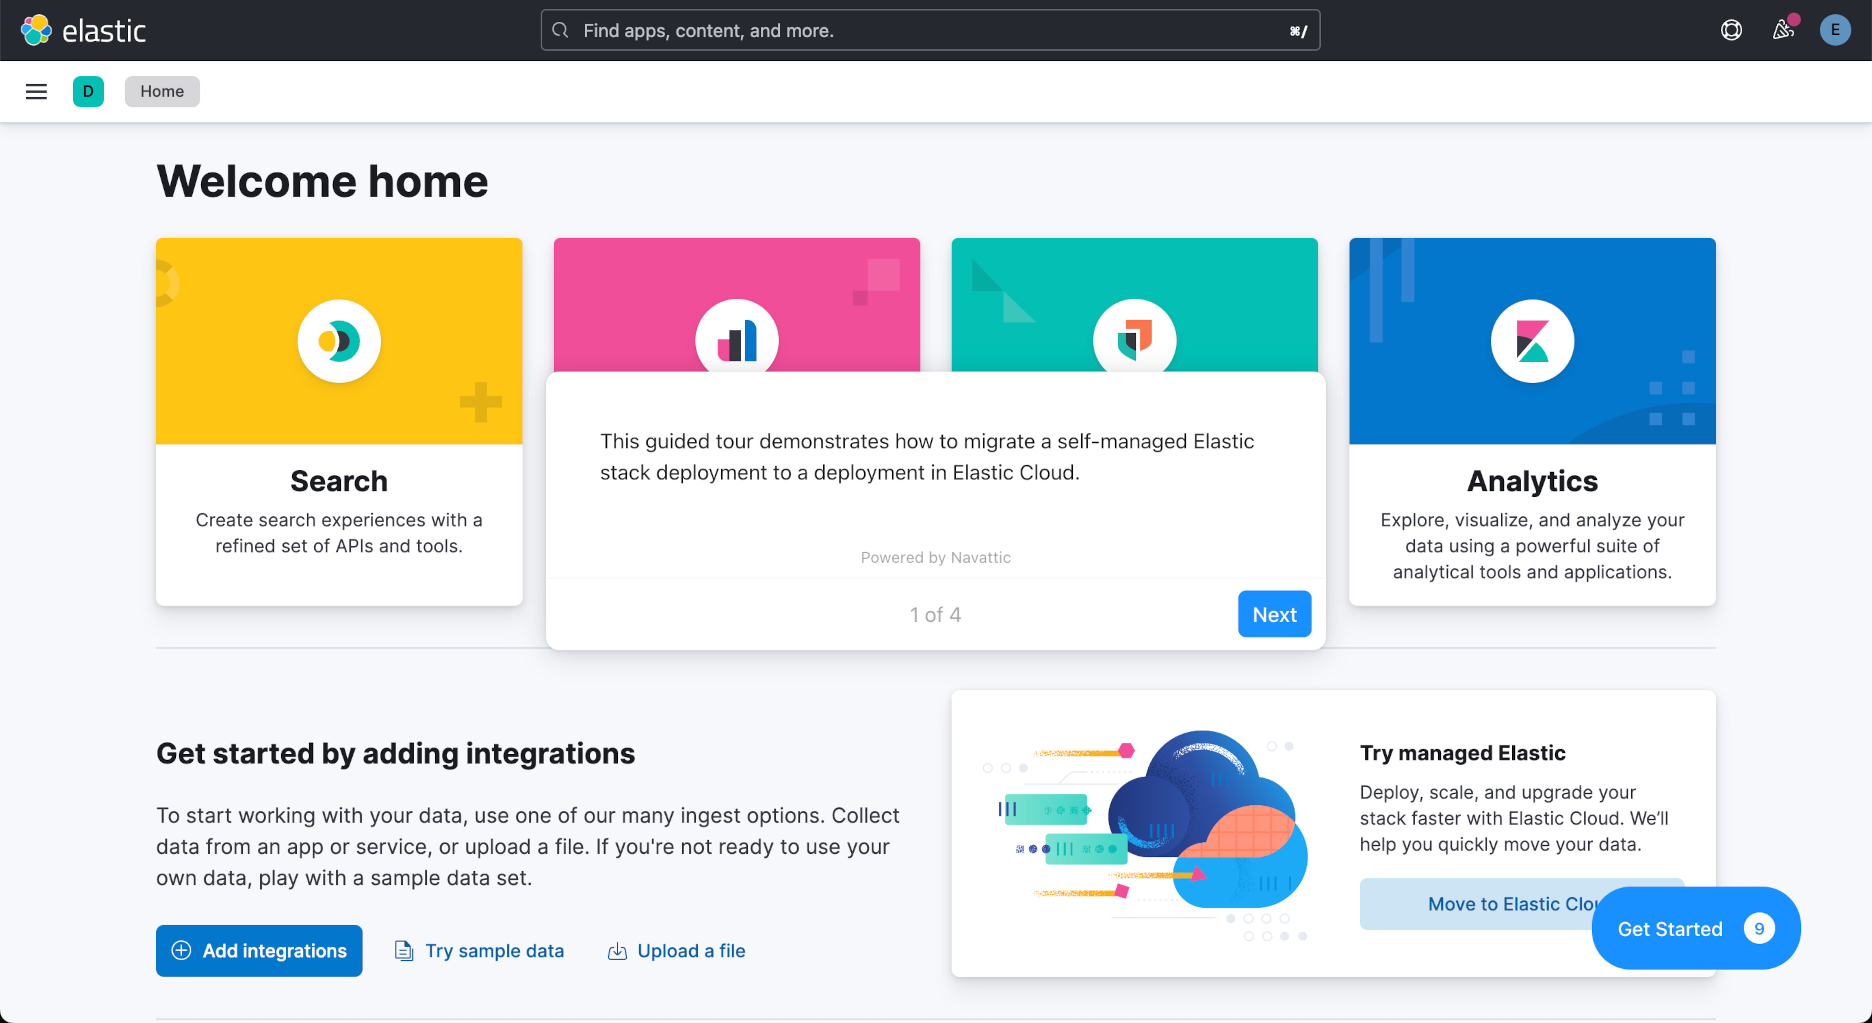
Migration using Google Cloud Storage
See how to set up a self-managed Elastic stack and then migrate that Elastic stack’s contents to Elastic Cloud using a snapshot and restore migration method. Google Cloud Storage will be used as the storage location of the snapshot, since it is an ideal service for saving and accessing files.

