Elastic Stack & Cloud 8.5: AIOps, collaboration, vector search GA, and more

We are pleased to announce the release of Elastic Stack 8.5. Learn how you can:
- Experience extended support for personalized collaboration to streamline workflows and facilitate escalations with your team. You can quickly assign cases to users in Kibana and define and search user profiles.
- Reach insights faster with richer context for your data and visualizations, including sourcing annotations dynamically from Elasticsearch queries in Kibana.
- Reduce noise when analyzing logs with AIOps pattern analysis.
- Search smarter with enhancements to vector search using the HNSW KNN capability (now GA), including filtering, hybrid search, and aggregation over HNSW based result sets.
- Gain better visibility into cluster health with more troubleshooting tools for cloud deployments on the new Health page in Elastic Cloud.
Ready to roll up your sleeves and get started? We have the links you need:
- Start Elasticsearch on Elastic Cloud
- Download Elasticsearch, Kibana, Integrations
- 8.5 Release notes for Elasticsearch, Kibana
- 8.5 Breaking changes
Drive actionable insights with collaboration and annotations in Kibana
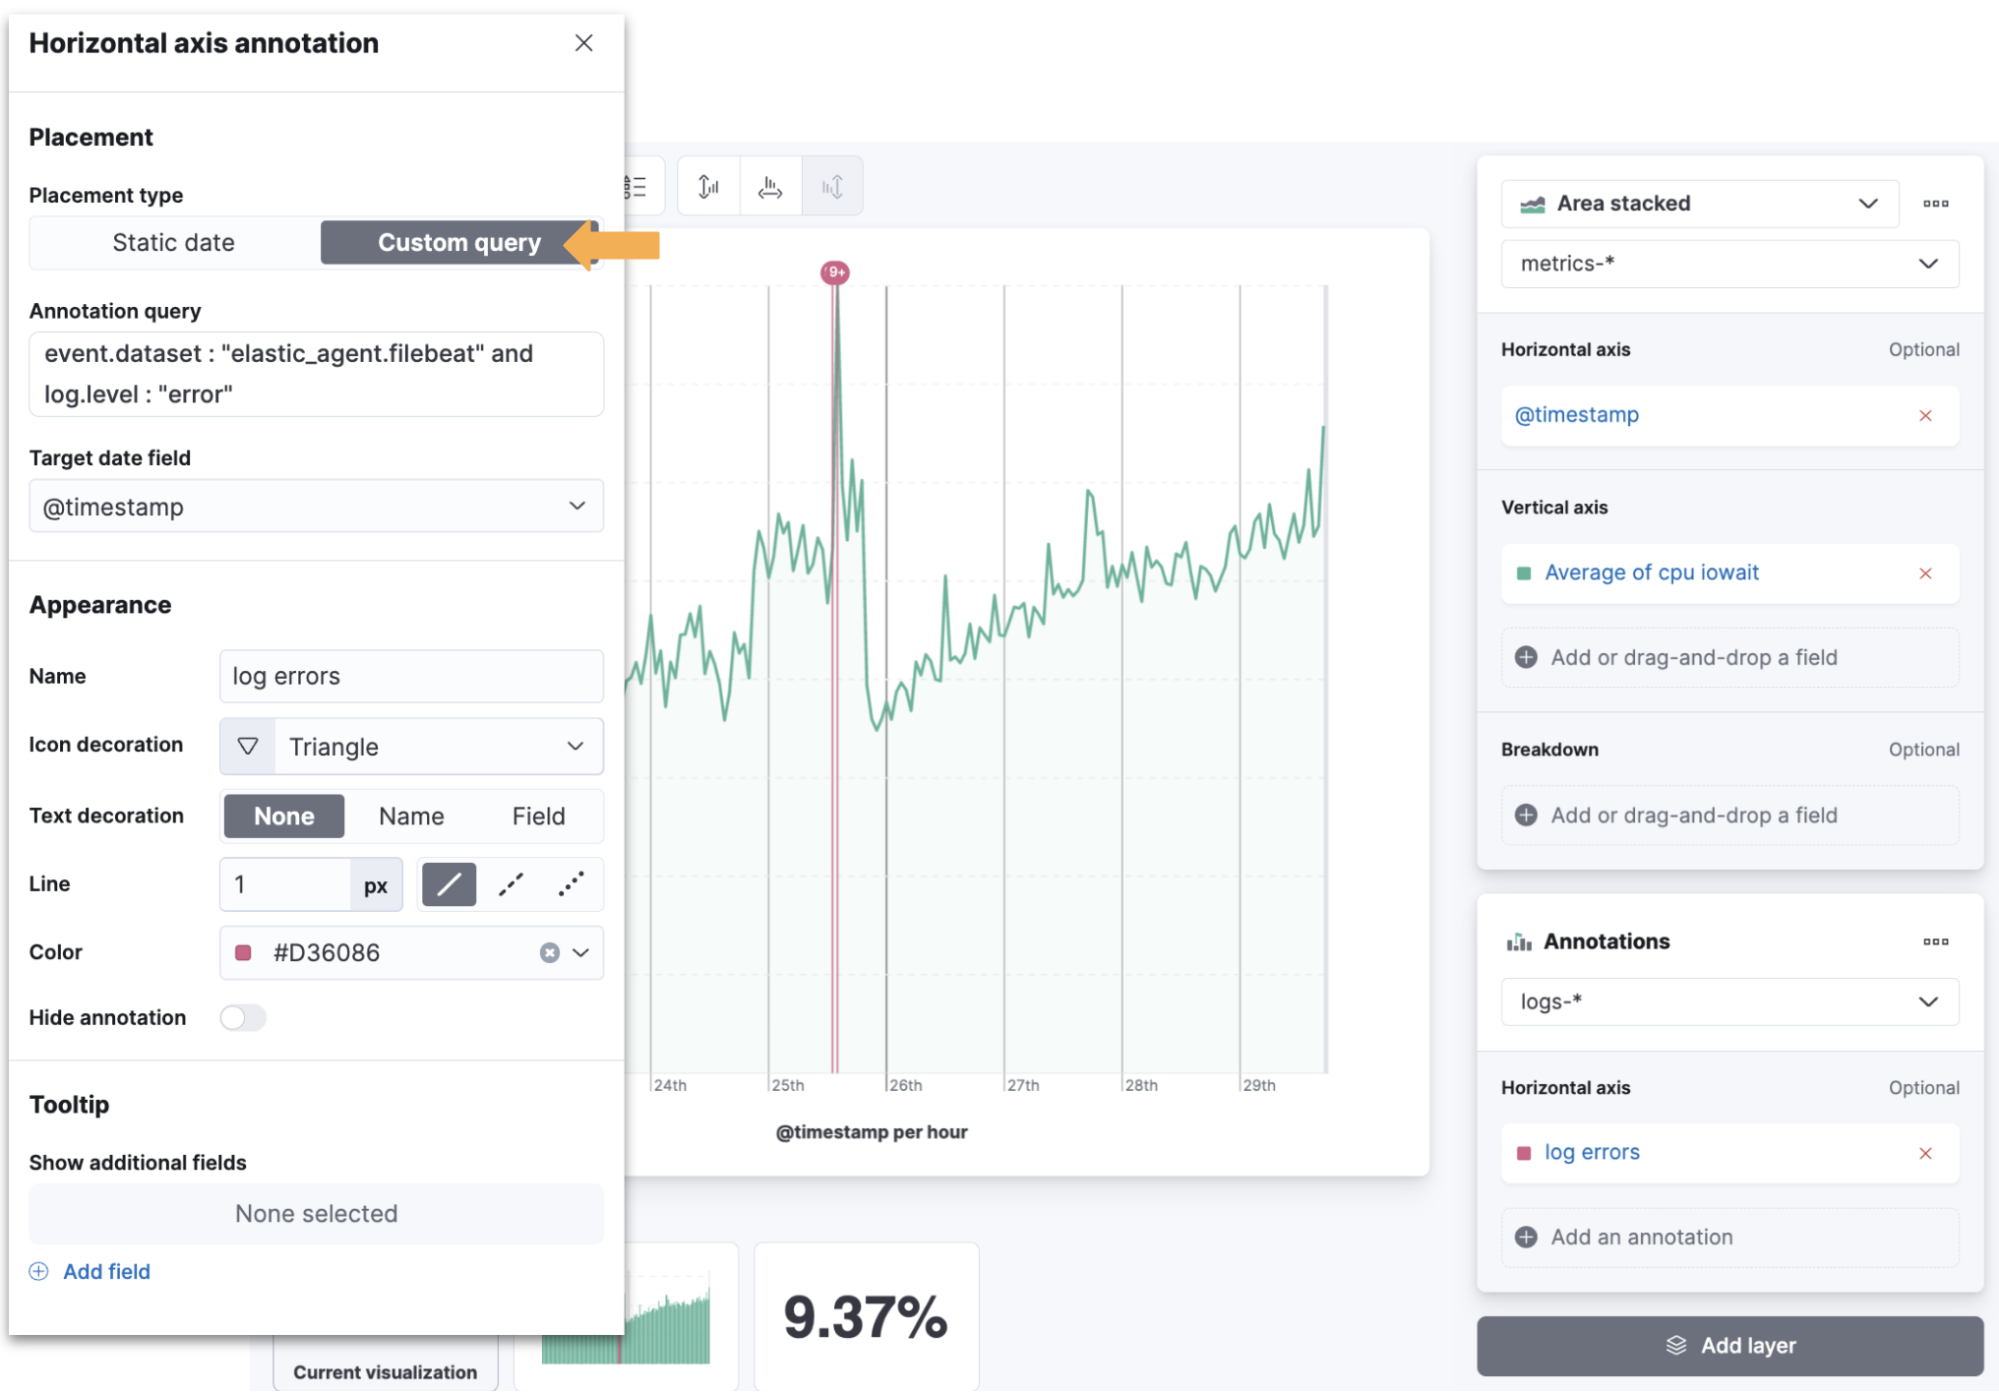
Whether in a Security, Observability, or Analytics use case, collaboration is a powerful way to make decisions and act on your insights. Kibana 8.5 adds the ability to assign a case to users as the first feature in a series of planned personalized collaboration capabilities. For query-based annotations, you now have the ability to manually annotate Kibana Lens visualization with notes.
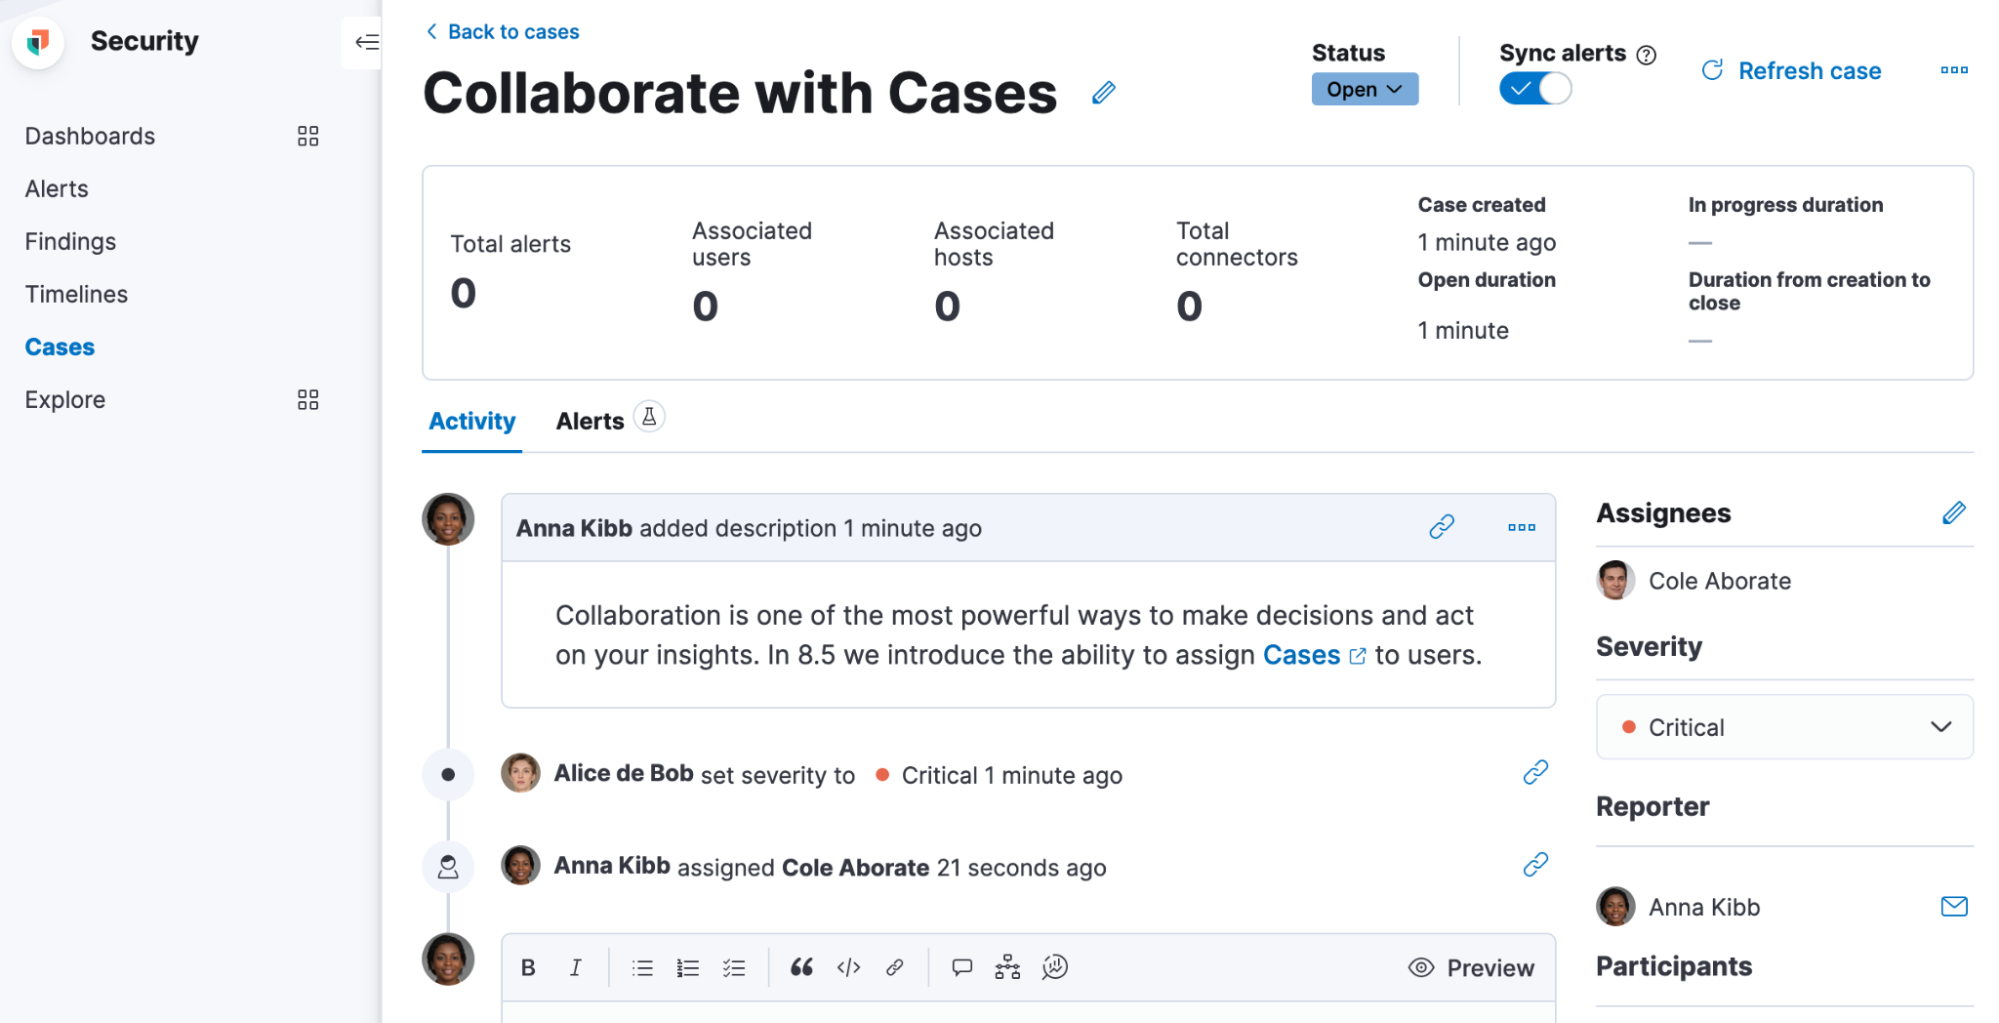
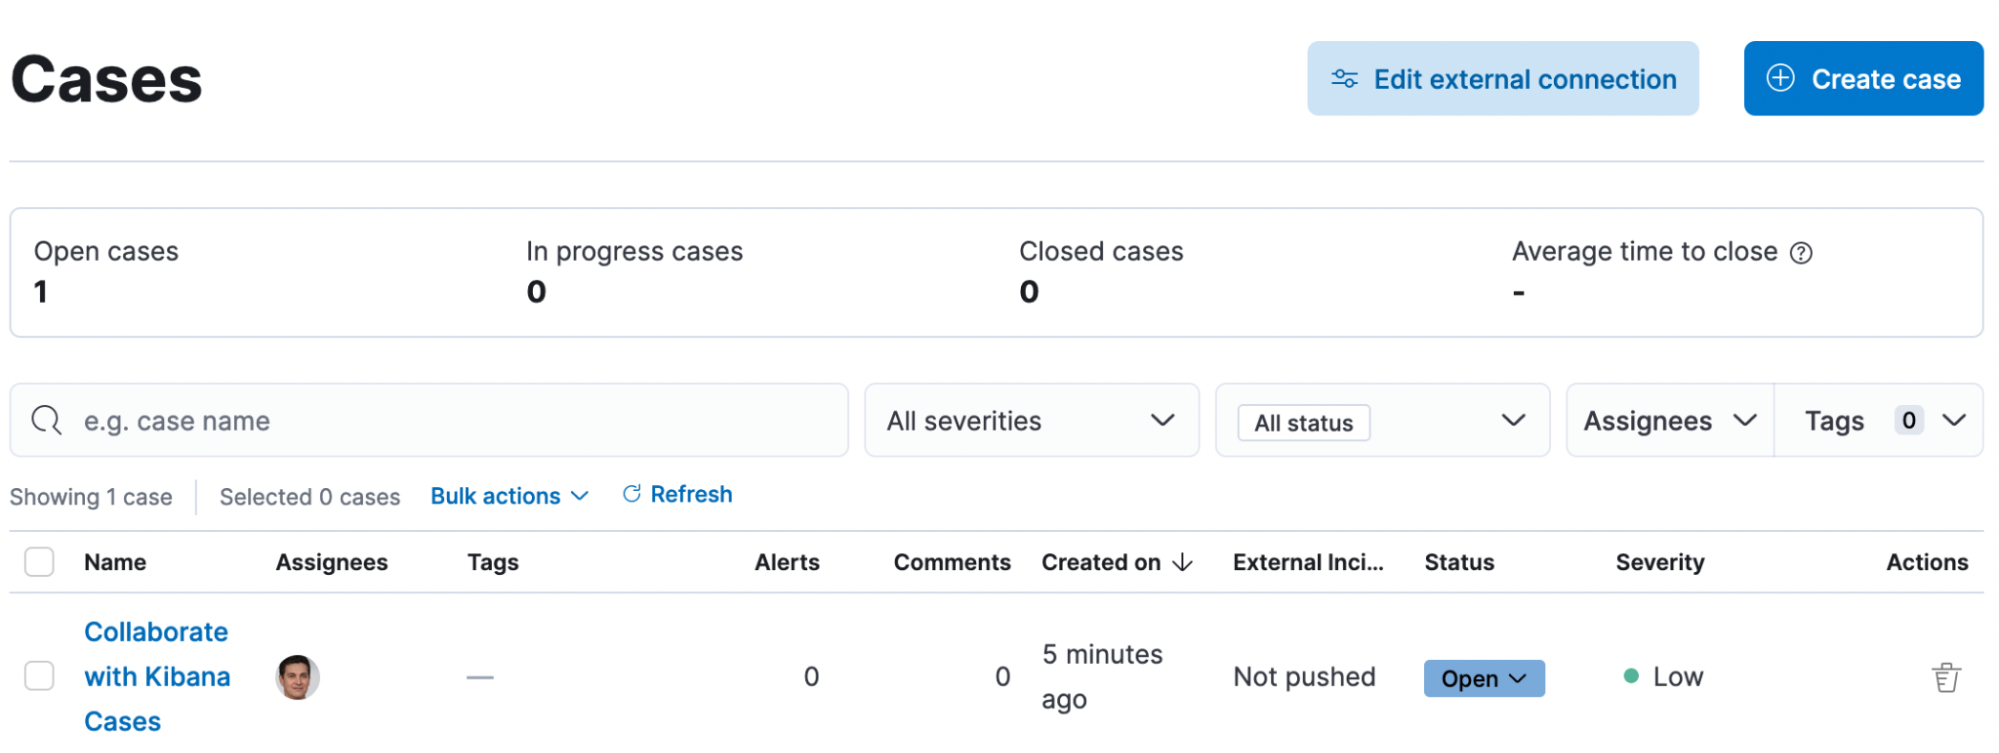
You can assign one or more users (and of course unassign as needed), either while creating a new case or in an existing one through the “assignees” UI component in Elastic Security, Observability, and Stack Management. The UX builds on previous releases, which introduced the ability to customize avatars. Your users and their avatars will show up in the central Cases view that lists all existing Cases in Security, Observability, and Stack Management. On this view, you can easily filter through the Cases assigned to you and all other users.
To facilitate managing case assignees, Kibana 8.5 introduces the ability to search through users from all authentication realms (as long as they have accessed Kibana at least once). When someone first accesses Kibana, a user profile is created and is available in the user search results. This search functionality includes auto-complete, highlighting the matching parts, user avatars, and the user’s email (if one exists).
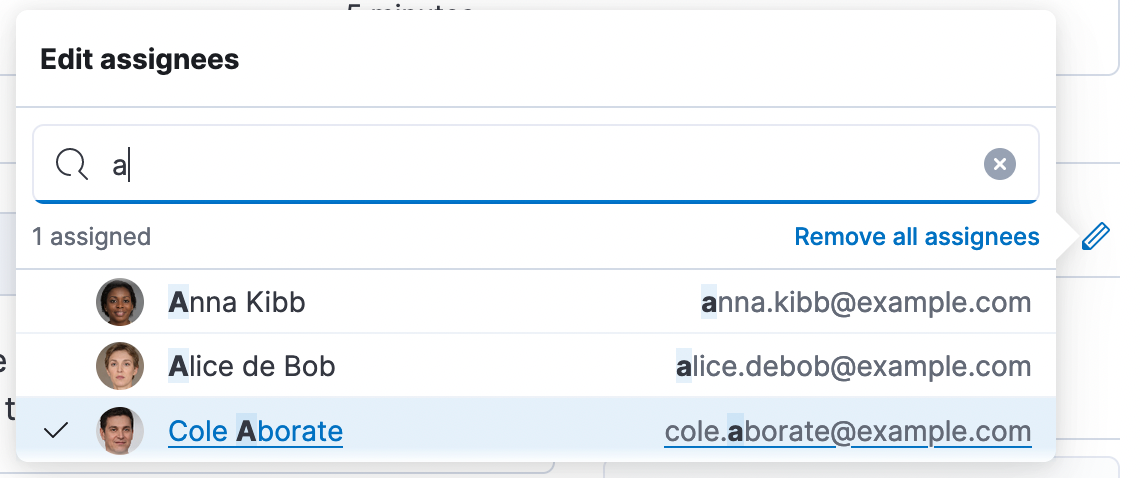
User search also adheres to Kibana RBAC. If one of your team members does not have access to cases within the Space, they will not surface in the results.
A key method of troubleshooting metric performance can be to analyze what events also took place at the same time. Now you can add query-based annotations in Kibana Lens from multiple data sources to your visualizations. This makes it easy to layer on time series events and see the relationship between these annotations and other metrics. Kibana Lens annotations also include better overflow support, additional style options, and a customizable tooltip.
See the forest for the trees in AIOps
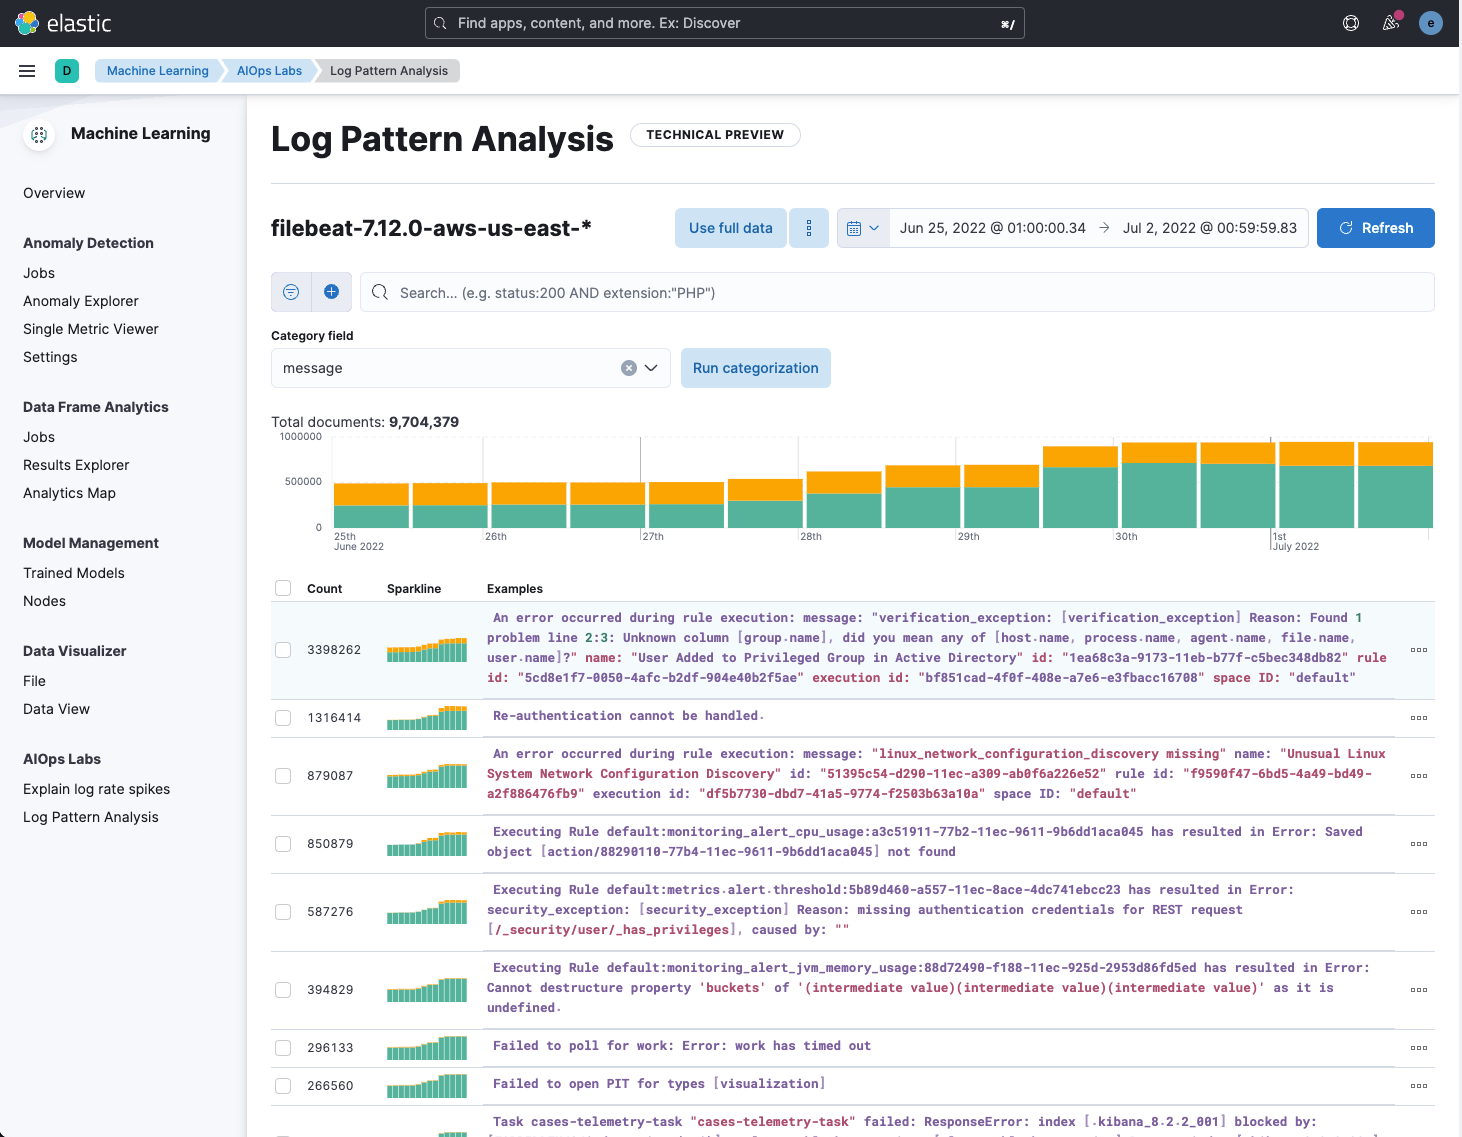
When analyzing logs for the root cause of issues, finding unique messages among a sea of common messages is challenging. Log pattern analysis allows you to select a data view and message field, apply optional filters, and then run on-demand categorization analysis. Similar messages are grouped using the same underlying algorithms as a machine learning categorization job. The distribution of the documents in each category is highlighted on the main chart. You can then open Discover and use one or more of these categories as a filter to view the matching documents to continue your investigation.
In 8.4, we introduced Explain Log Rate Spikes, which allows you to identify statistically significant field-value combinations that contribute to a spike in log rates by making use of the p-value option of the significant terms aggregation. In 8.5, we’re taking this a step further and grouping results that co-occur using an approach based on frequent item sets. This allows you to cut through the noise, especially when searching through redundant individual results, like metadata, that’s associated with the information you’re actually interested in.
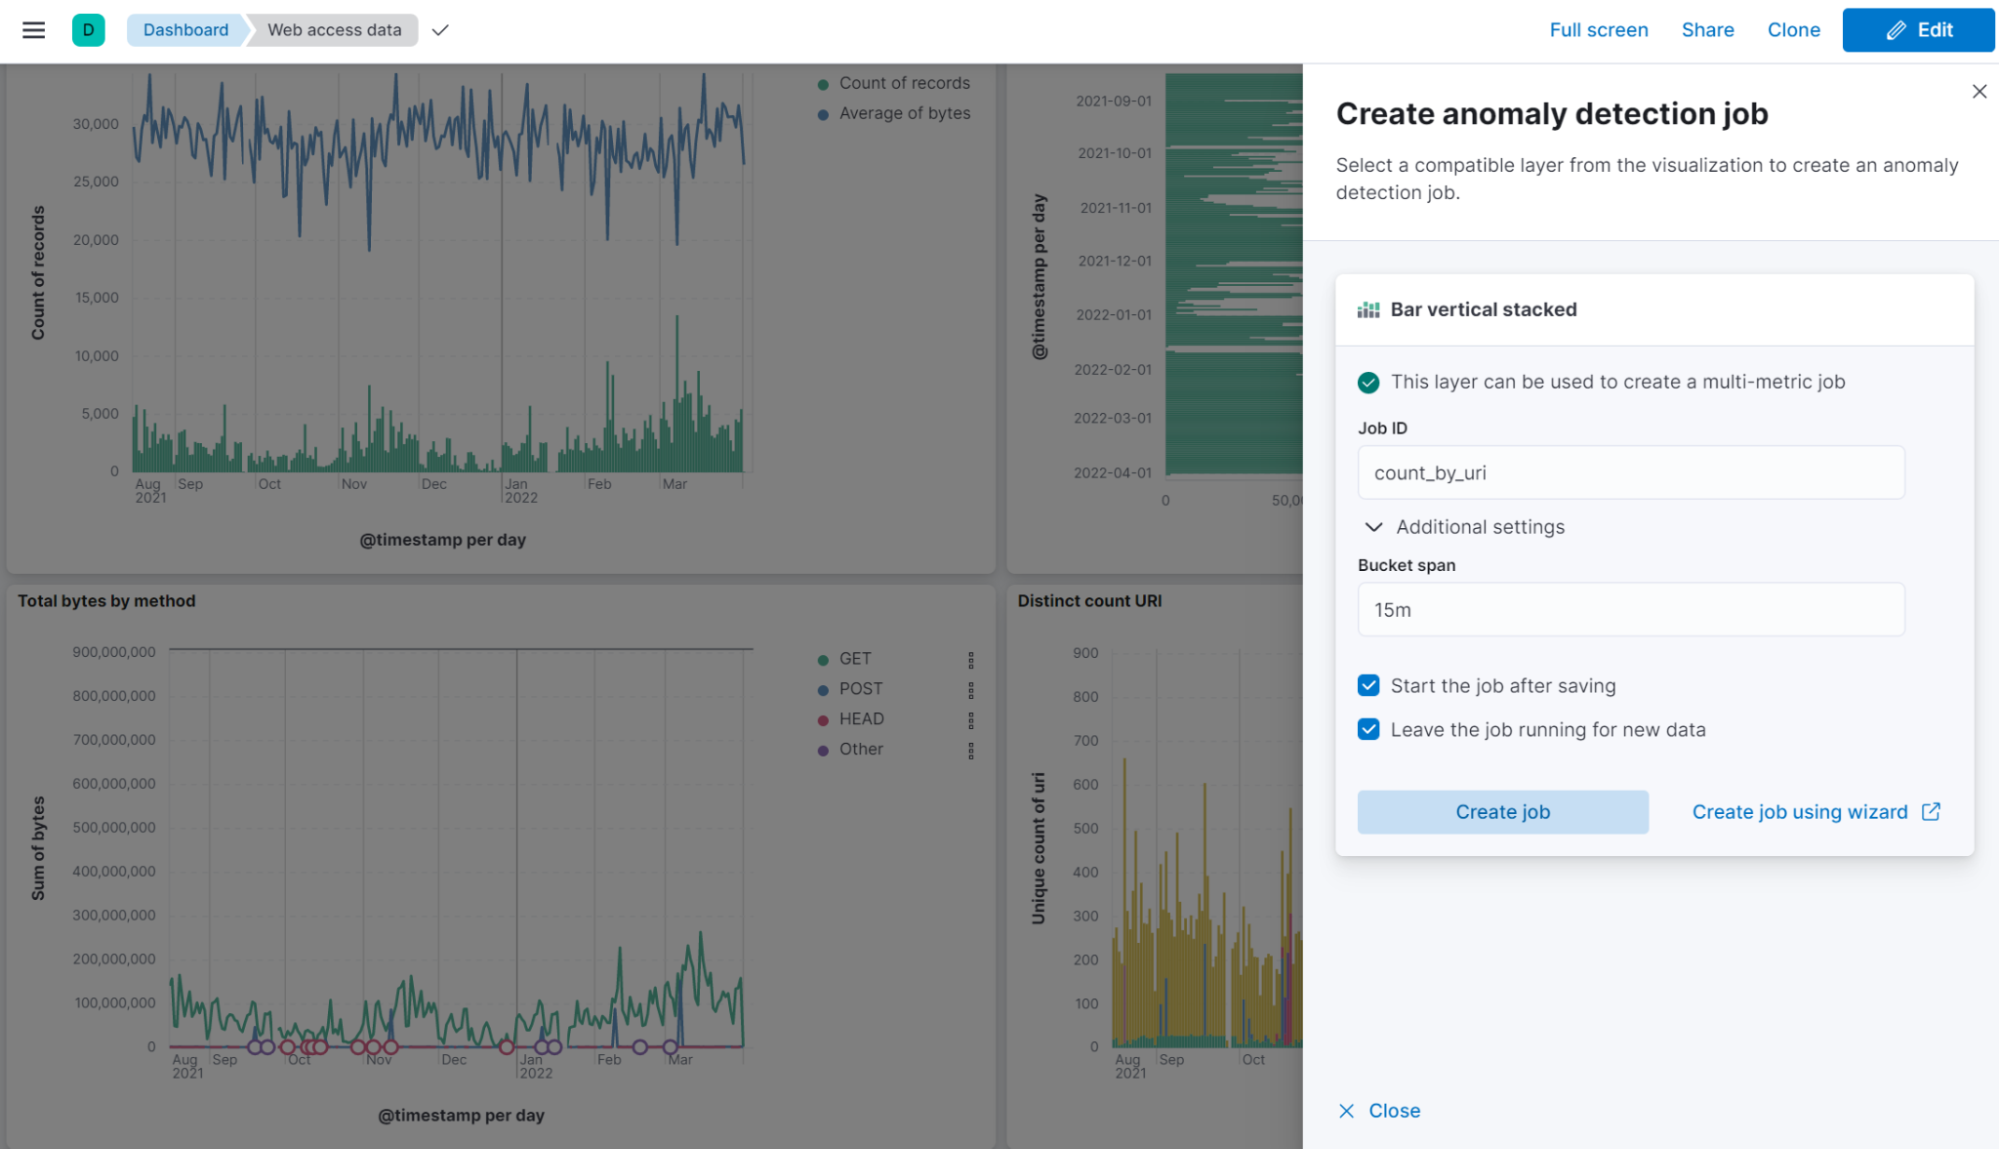
Integrating AIOps more tightly with visualizations helps you start investigating faster. In this release, anomaly detection jobs can now be created directly from the flyout of a Lens visualization within the dashboard app. Enter a job ID and let Elastic take care of the rest. For more advanced configuration, you can still use the full anomaly detection job wizard.
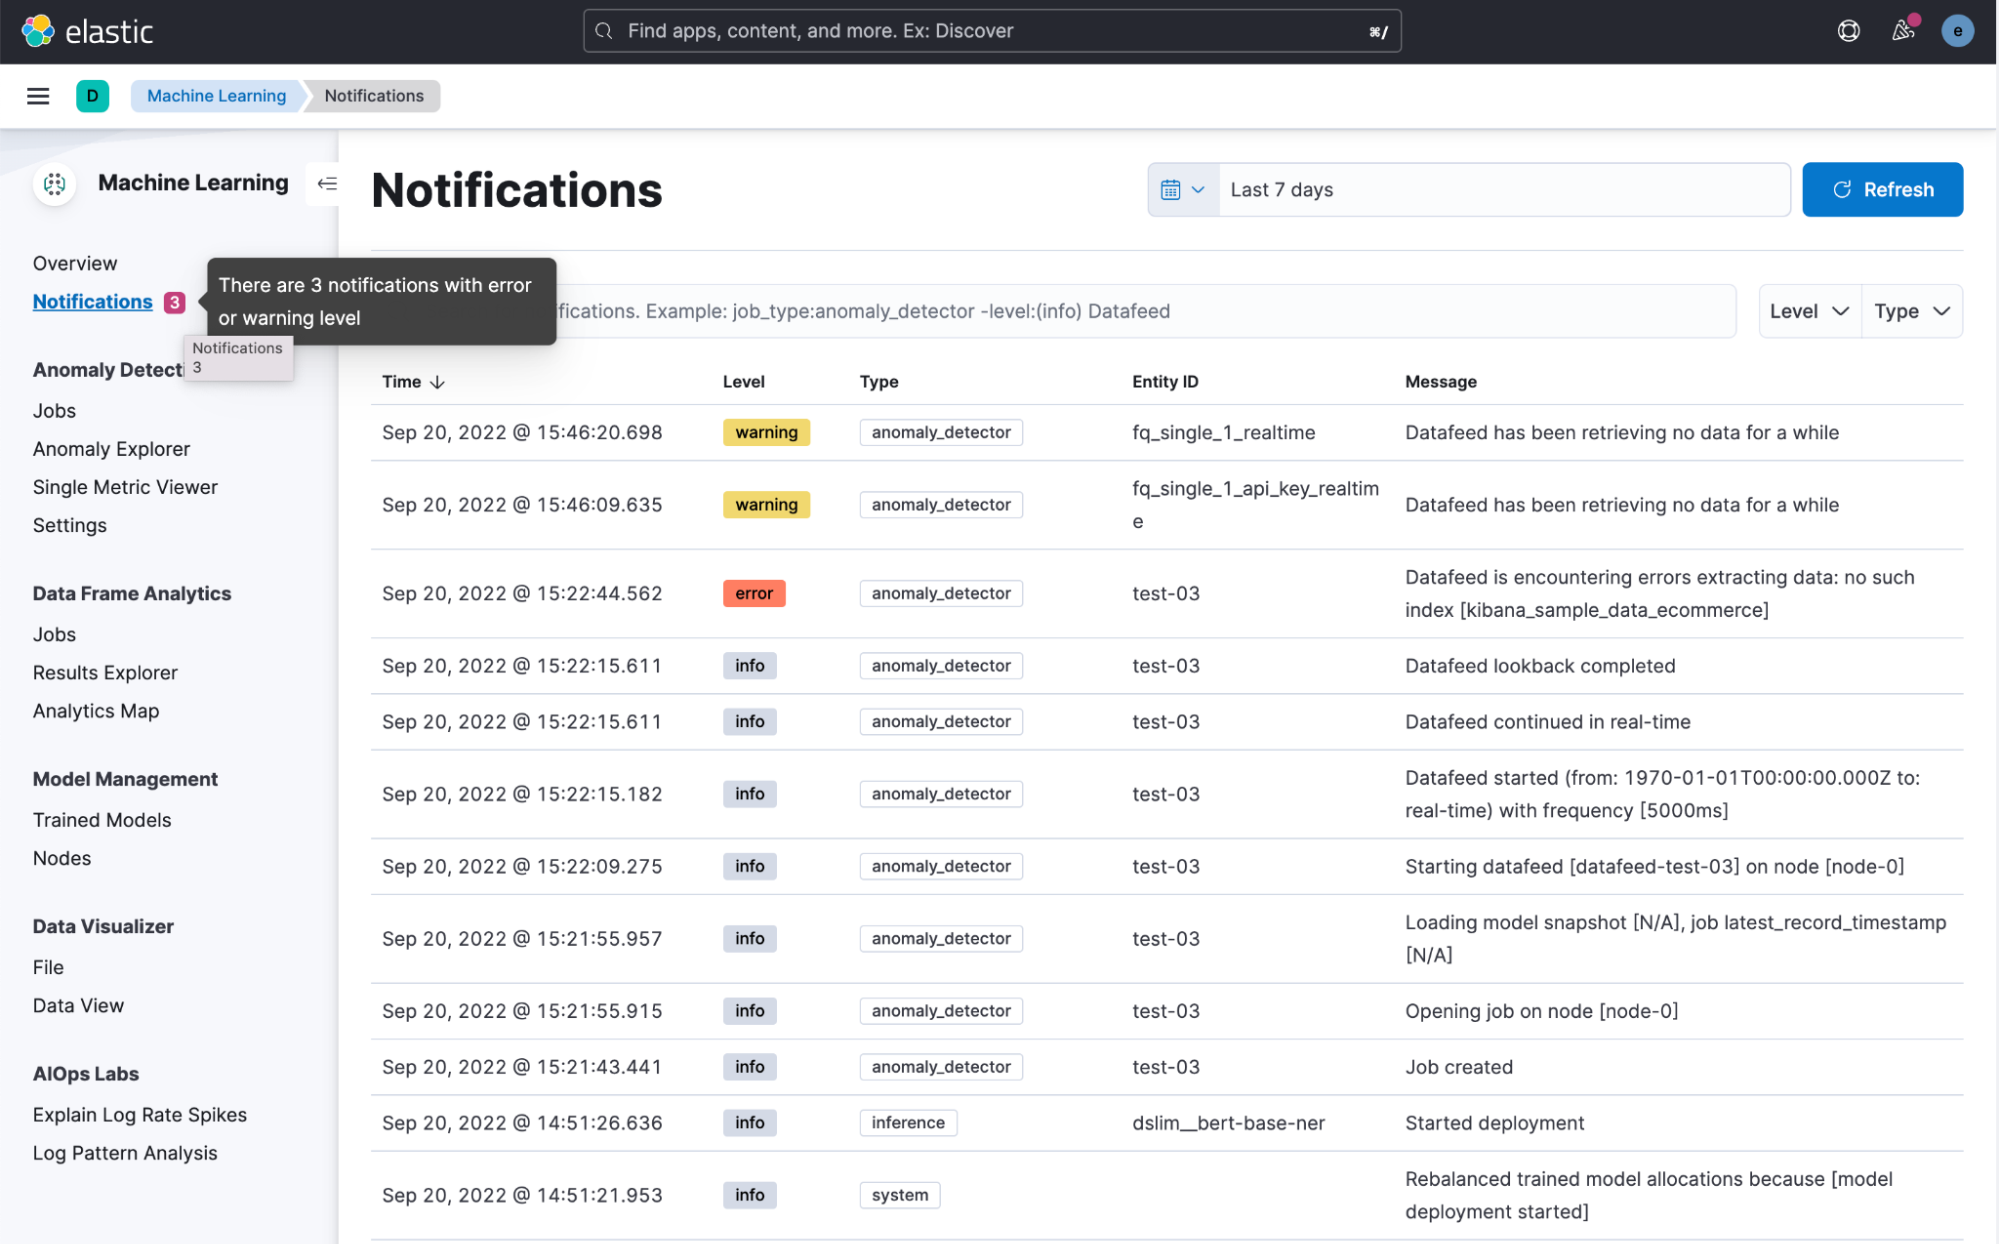
Previously, notifications from Anomaly Detection and Data Frame Analytics jobs were scattered in various places. To help consolidate, we have added a dedicated notifications page to display all ML-related messages, for all ML jobs, in a single view. The new page lets you quickly search for messages across all jobs in the current space, with controls to filter for errors or warnings. A “notifications” indicator has also been added to the side nav, which checks for new notifications in the background, raising awareness of the current state of the ML jobs.
More efficient GET operations
Elasticsearch 8.5 also introduces bloom filters on the _id field of non-data-stream indices. Now, GET operations can more efficiently skip segments that do not contain the requested _id. This also improves the indexing rate in the case when IDs are explicitly provided as part of indexing requests. This is because Elasticsearch needs to look up a previously indexed document with the same ID. In our benchmarks, GET operations were several times faster with this change, and indexing with explicit IDs were between 8% and 30% faster, depending on the cost of indexing.
It is important to note: datasets that are more cost effective to index, due to fewer fields or because of their field types, see the greatest improvement in speed. These bloom filters reside on disk so they do not increase heap requirements for these indices. Storage requirements are only increased by 1.25 bytes per document.
Easily detect and troubleshoot cluster performance issues on Elastic Cloud
Elastic Cloud 8.5 brings to customers a new Health page, allowing you to easily identify and troubleshoot issues affecting your Elasticsearch clusters. When issues are detected, the Health page presents an ordered list of issues, ranked by severity of impact. This allows you to easily identify and address the most critical issues affecting your deployment. Simply click into the issues from the same page to get additional details and guidance to resolve the issue.
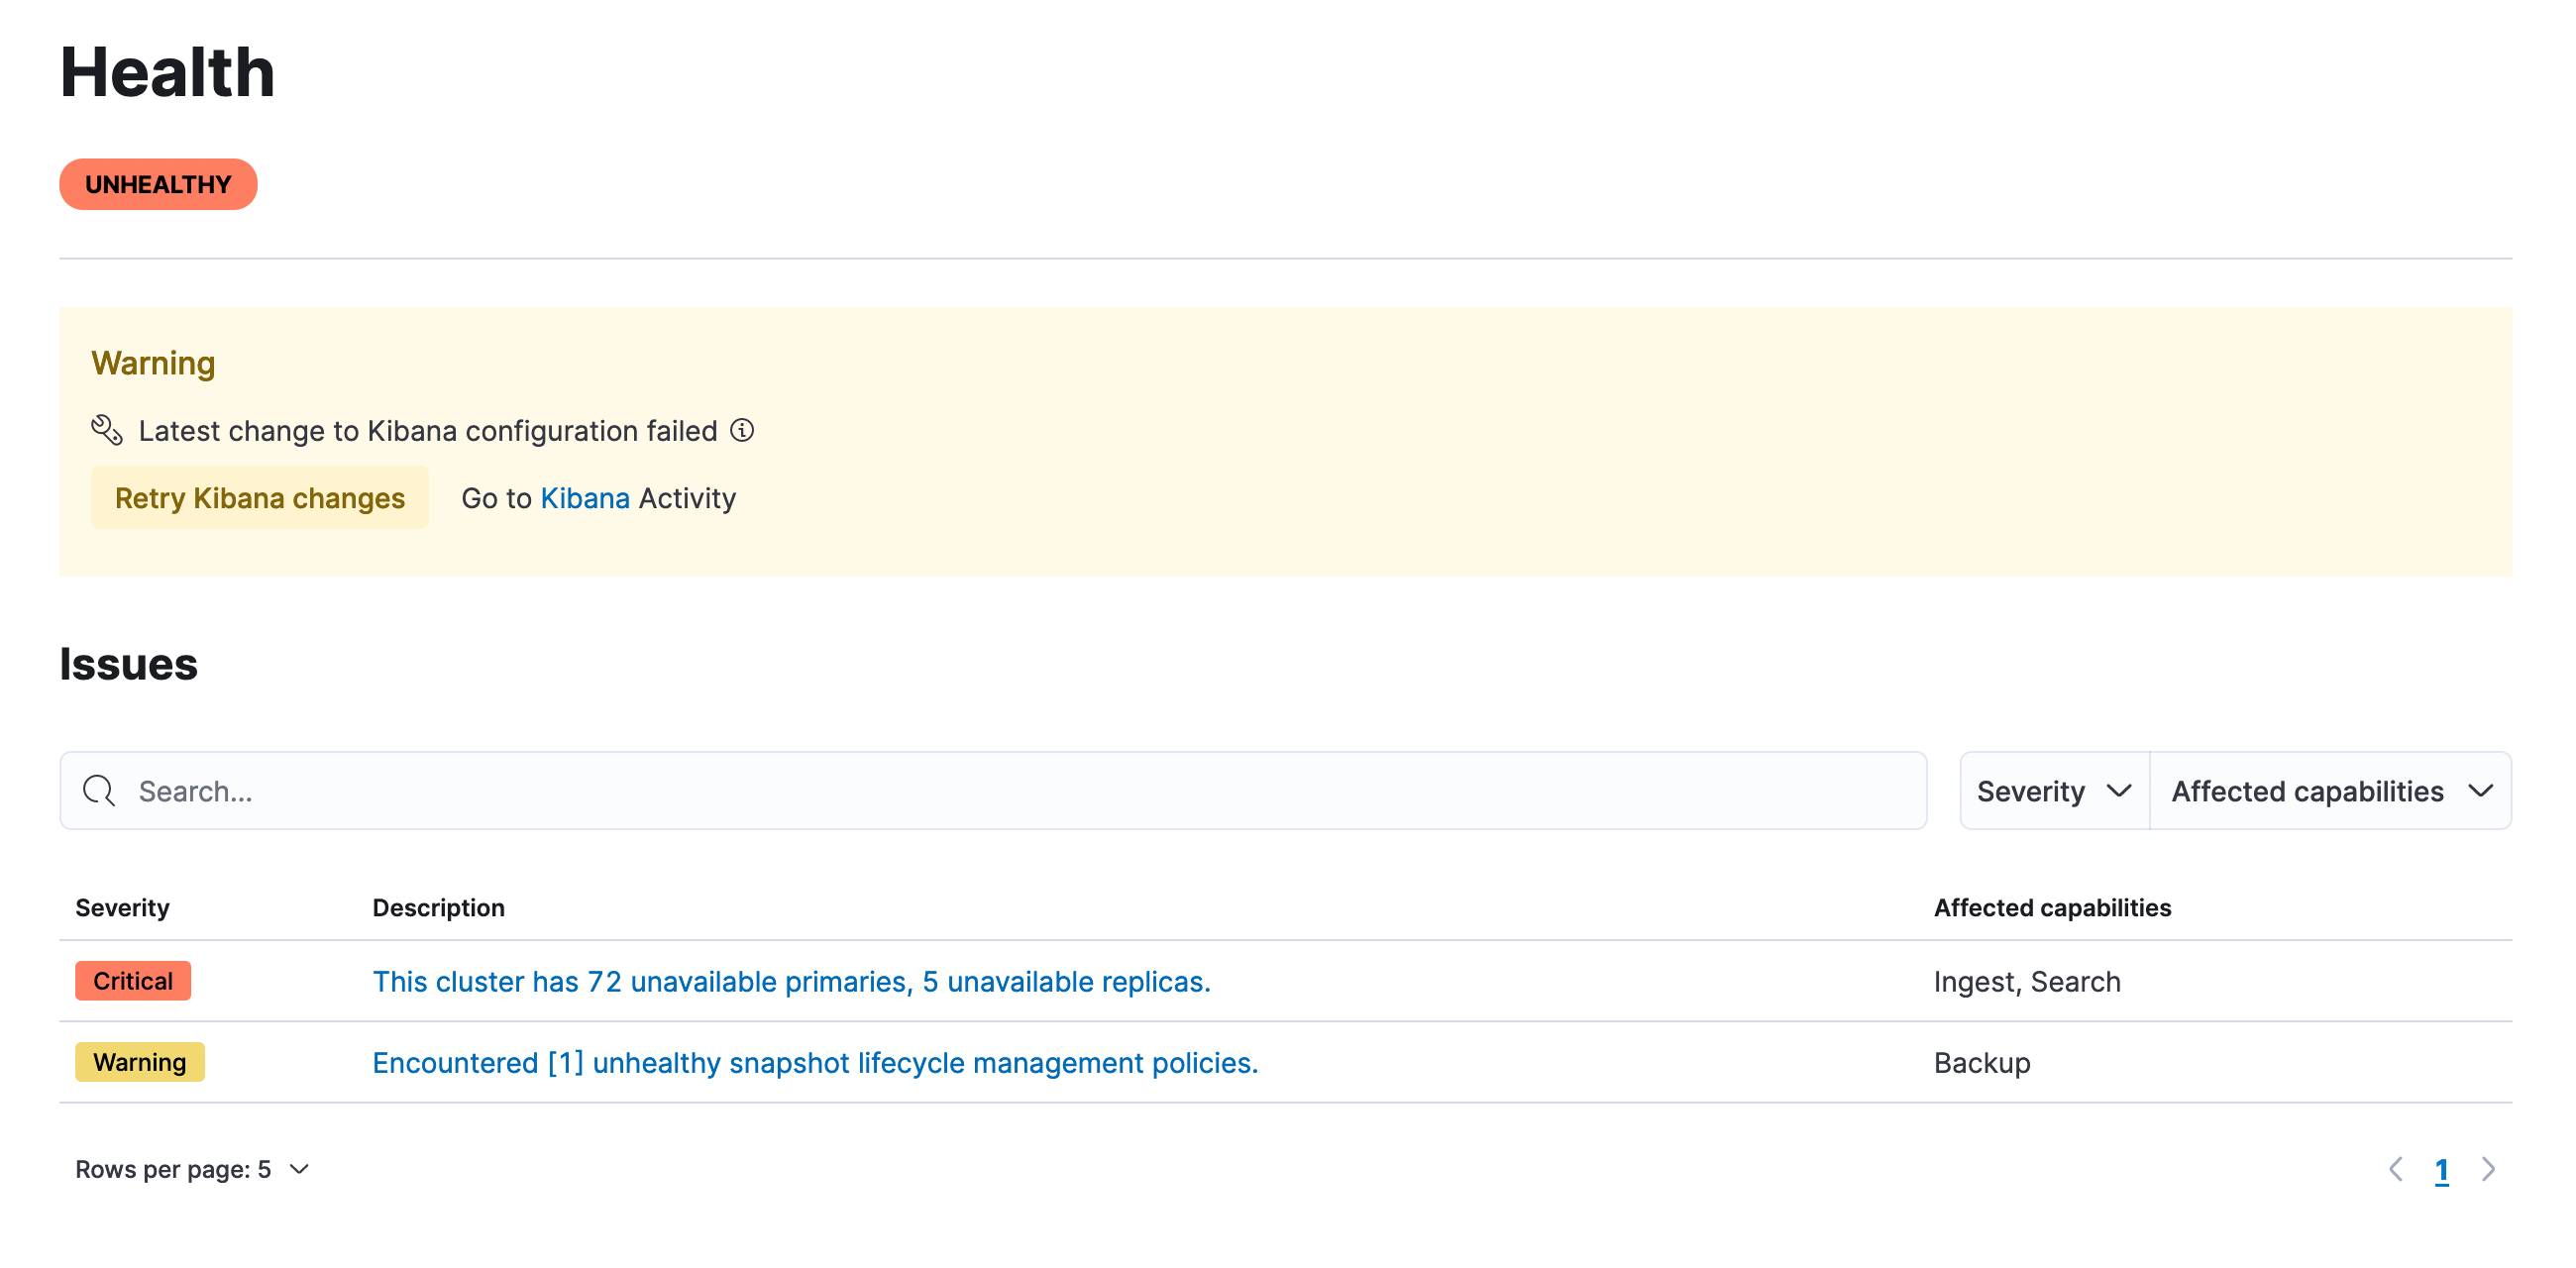
The issues covered on the Health page go beyond simple error reporting. They provide information on the impact and more detailed troubleshooting guidance. This simplifies cluster operations and makes it easy for anyone to identify and address the most critical issues, without requiring deep expertise in Elasticsearch. The Health page covers Elasticsearch issues today and will expand to include other Elastic Cloud components, like Kibana and the APM server, in future releases.
Last but not least: New capabilities for vector search go GA
After a lengthy period of development and testing, we are thrilled to make HNSW based KNN vector similarity generally available. We spent months testing it at scale and have various public one-off and nightly benchmarks monitoring its performance. While in tech preview, we developed several enhancements to the HNSW KNN capability, including filtering, hybrid search (with traditional ranking), and aggregation over HNSW based result sets.
Thank you to our users who provided valuable feedback on the use of vector search in Elasticsearch across various scenarios. It’s a big step and a reason for celebration, but in some ways it is the beginning of the journey rather than the final step. We have an extensive roadmap for vector similarity in Elasticsearch, so stay tuned!
Try 8.5 today
Existing Elastic Cloud customers can access many of these features directly from the Elastic Cloud console. If you’re new to Elastic Cloud, take a look at our Quick Start guides (bite-sized training videos to get you started quickly) or our free fundamentals training courses. You can always get started for free with a free 14-day trial of Elastic Cloud or download the self-managed version of the Elastic Stack for free. Or get started today by signing up via AWS Marketplace, Google Cloud Marketplace, or Microsoft Azure Marketplace.
Read about these capabilities and more in the release notes, and other Elastic Stack highlights in the Elastic 8.5 announcement post.
The release and timing of any features or functionality described in this post remain at Elastic's sole discretion. Any features or functionality not currently available may not be delivered on time or at all.