Elastic Stack alerting now generally available
We are thrilled to announce the general availability of alerting in the Elastic Stack with the release of 7.11. With deep integrations throughout our products and solutions, a laser focus on distinguishing signal from noise, and tie-ins to the third-party platforms you depend on like email, PagerDuty, ServiceNow, and Microsoft Teams, building, using, and acting on alerts in Elastic has never been more powerful. To get hands on with alerting in the Elastic Stack, spin up a free cloud trial of Elasticsearch Service or download 7.11 for your own self-managed deployment. Be sure to also join us for our upcoming alerting webinar where we’ll be offering tips and recommendations for using alerts within the Elastic Stack.
A new vision for alerting in the Elastic Stack
Seventeen months ago we revealed a new vision for the future of alerting in the Elastic Stack. Our goal was to take the years of incredible customer feedback about building, using, and acting on alerts with our original alerting feature, Watcher, and transform those insights into a fundamentally new alerting framework within the Elastic Stack itself. Our guiding principles centered on three critical observations:
- Alerting needs to be everywhere. Elastic use cases and products support unique workflows and ensuring the ability to create powerful alerts means tailoring the experience to address needs both at the moment they happen as well as where in the interface they arise.
- Making sense of alerts is critical. With an increase in alert notifications comes the need to understand their importance and their context in order to evaluate their weight for decision making.
- Alerts need to drive awareness and action. Simply getting a human’s attention isn’t enough. Truly impactful alerting means creating the ability to initiate workflows that can escalate, evaluate, and support issue resolution — especially with third-party platforms outside the Elastic Stack.
A beta that delighted
Eight months after outlining our vision for a new alerting framework in the Elastic Stack we delivered the initial beta within our 7.7 release. The feedback was immediate. Absolute joy at being able to create and customize alerts from directly within solution interfaces like APM and SIEM that streamlined user workflows through a friendly guided UI/UX. Excitement for support of multi-tenancy and the ability to have a centralized interface for managing alerts. Relief that frustrations that had been present with Watcher were listened to and addressed. But overwhelmingly, a plea for even more innovation.
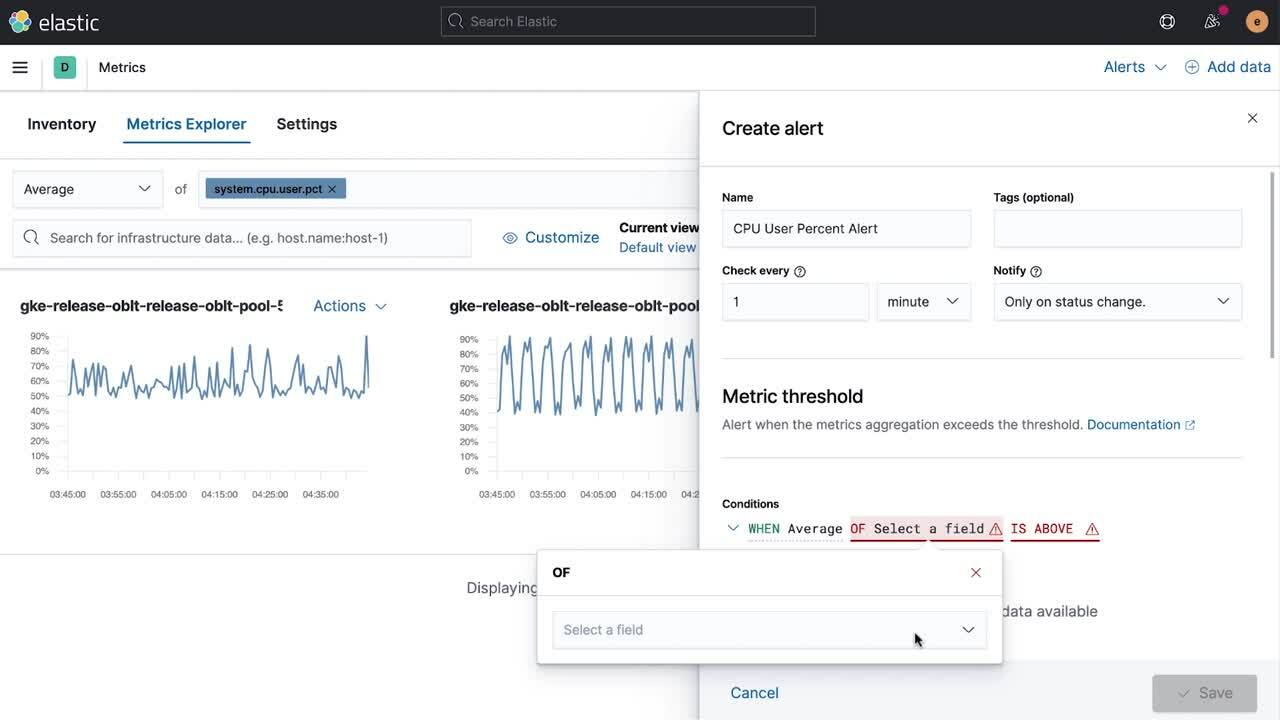
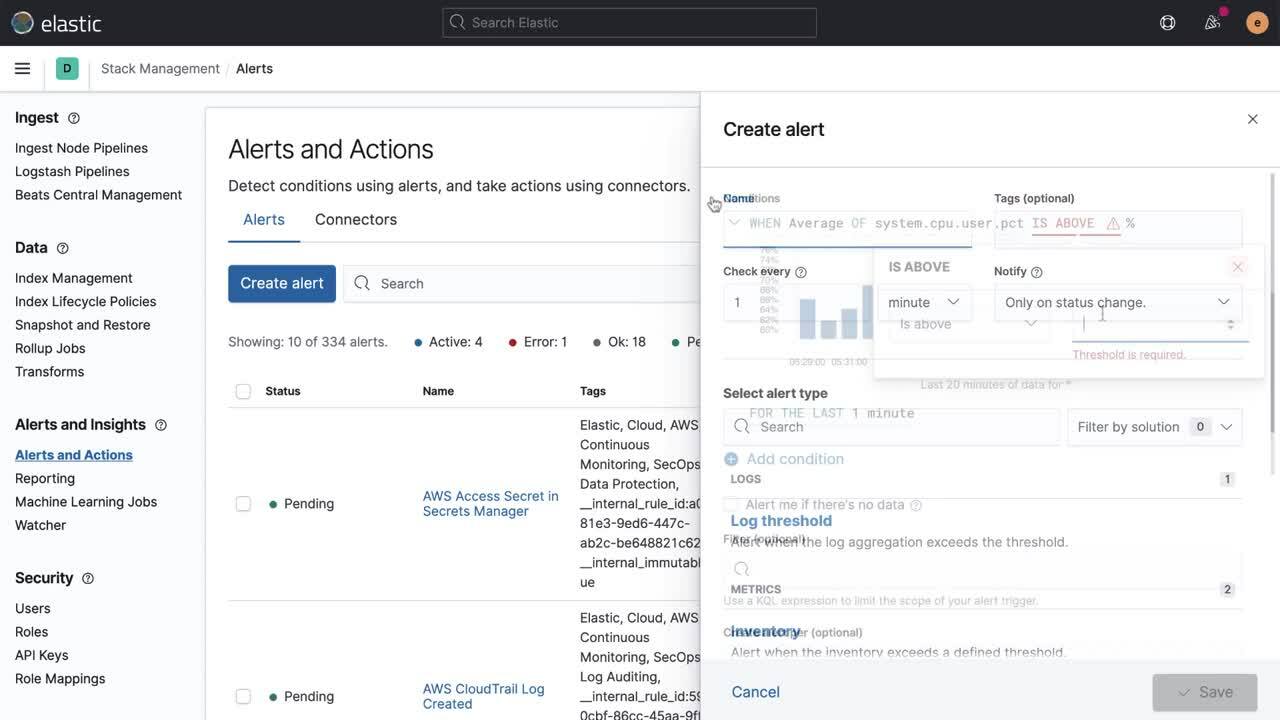
And so we worked to deliver even more robust capabilities into the alerting beta. New third-party connectors to mission-critical platforms like Jira, ServiceNow, and IBM Resilient. Improved interfaces for quickly spotting and managing alerts. The ability for Elastic Stack admins to control alerts with role-based access controls (RBAC). We even introduced alerting capabilities into Elastic Maps for tracking and alerting on entity movements within defined geographic boundaries.
Yet, in the midst of continuing to build bold new features from the ground up, our alerting work remained anchored on one core thing that all Elastic users value: the underlying support of Elasticsearch to power increasingly complex alerting queries at speed and scale.
Out of beta and into your hands
With the release of 7.11 we are truly delighted to be able to bring alerting for the Elastic Stack into general availability and support it for production use cases. Our roadmap for alerting remains very aggressive and this move from beta to GA is simply one of many innovation milestones.
In this release you can see the continued push to make alerts in the Elastic Stack even more impactful with things like user interface improvements around grouping alerts types for quick and easy understanding. 7.11 also takes a big step forward in determining the logic behind when an alert fires with the ability to set triggers around alerting state changes (e.g., trigger a PagerDuty escalation when a threshold is passed, but send an “All Clear” email when the threshold breach is resolved). And finally, we’ve added a brand new third-party alert action integration with Microsoft Teams for communicating alert information where your organization needs it most.
The future of alerting in the Elastic Stack
Just as the release of the alerting beta in May 2020 resulted in a tremendous outpouring of positive feedback and hunger for more capabilities, we expect that this graduation of alerting to general availability will have much the same effect. To help answer some of the questions around “what’s next?” I’d like to share just a brief glimpse of some things we’re looking at in regards to the alerting product roadmap.
- More alerts actions integrations to third-party platforms to help you and your teams respond to incidents faster
- Deeper integrations with analytics applications in the Elastic Stack (alerts in Dashboards and Machine Learning, etc.)
- Further integration with interfaces and workflows for Elastic Observability, Elastic Security, etc.
- More features designed to aid escalation and collaboration in alerting scenarios
- Additional tools to reduce alerting noise and boost signals, such as more the ability to provide richer context in alerts, alert flapping mitigation, and specific analytical views based on alerting data
Get hands-on with alerting for free
See how you can start using alerting in the Elastic Stack today to do everything from monitor your website’s health to ensuring the digital safety of your organization with real-time data flowing into Elasticsearch. Create a free cloud trial of Elasticsearch Service or if you self-manage an Elastic deployment, you can download 7.11 installs here. We welcome your feedback and as always, you can find us on Twitter (@elastic), in the Kibana forum, and in Kibana GitHub repo.
For more details on other Kibana features released as part of 7.11, be sure to check out the main Kibana release blog.