Elastic Observability 8.7: Enhanced observability for synthetic monitoring, serverless functions, and Kubernetes


 Share on Twitter
Share on Twitter

 Share on LinkedIn
Share on LinkedIn

 Share on Facebook
Share on Facebook

 Share by Email
Share by Email

 Print this page
Print
Elastic Observability 8.7 introduces new capabilities that drive efficiency into the management and use of synthetic monitoring and expand visibility into serverless applications and Kubernetes deployments.
These new features allow customers to:
- Simplify the setup and management of synthetic monitors, ensuring reliable and highly performant user experiences
- Extend serverless observability capabilities with support for distributed tracing of Azure Functions
- Use Elastic Agent to quickly and easily monitor Google Kubernetes Engine (GKE) Autopilot clusters.
Observability 8.7 is available now on Elastic Cloud — the only hosted Elasticsearch offering to include all of the new features in this latest release. You can also download the Elastic Stack and our cloud orchestration products, Elastic Cloud Enterprise and Elastic Cloud for Kubernetes, for a self-managed experience.
What else is new in Elastic 8.7? Check out the 8.7 announcement post to learn more >>
Synthetics
We are excited to announce the public beta release of our new synthetic monitoring UI, which is now available for all users in Kibana 8.7 or greater. Our new UI comes with SRE-focused workflows that enable users to set up and monitor critical services with ease, ensuring reliable and performant user experiences. These workflows make triaging alerts super simple, helping teams to quickly identify and resolve issues. Additionally, users can manage monitors as code using Project Monitors, enabling collaboration and reducing the risk of errors.
As part of our ongoing commitment to delivering high-quality monitoring solutions, we are also offering a free public beta of our managed testing service. Try out the new synthetic monitoring UI today and experience the power of advanced monitoring capabilities.
Distributed tracing for Azure Functions
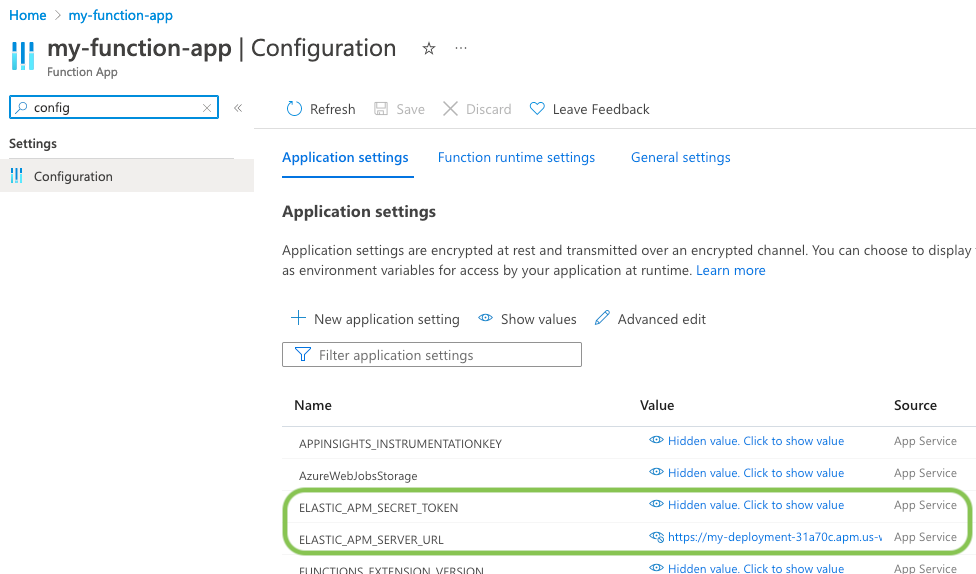
Elastic Observability 8.7 introduces distributed tracing for Azure Functions (available using Elastic APM Agents for .NET, Node.js, and Python). Auto-instrumentation of HTTP requests is supported out of the box.
Onboarding for tracing Azure functions is simple but requires minor changes to the Azure Functions application code. Configuration instructions (using the Elastic .NET Agent as an example) are available here. Additionally, the Elastic APM Server URL and secret token must be defined in the application settings for your Function App in the Azure Portal as shown below:
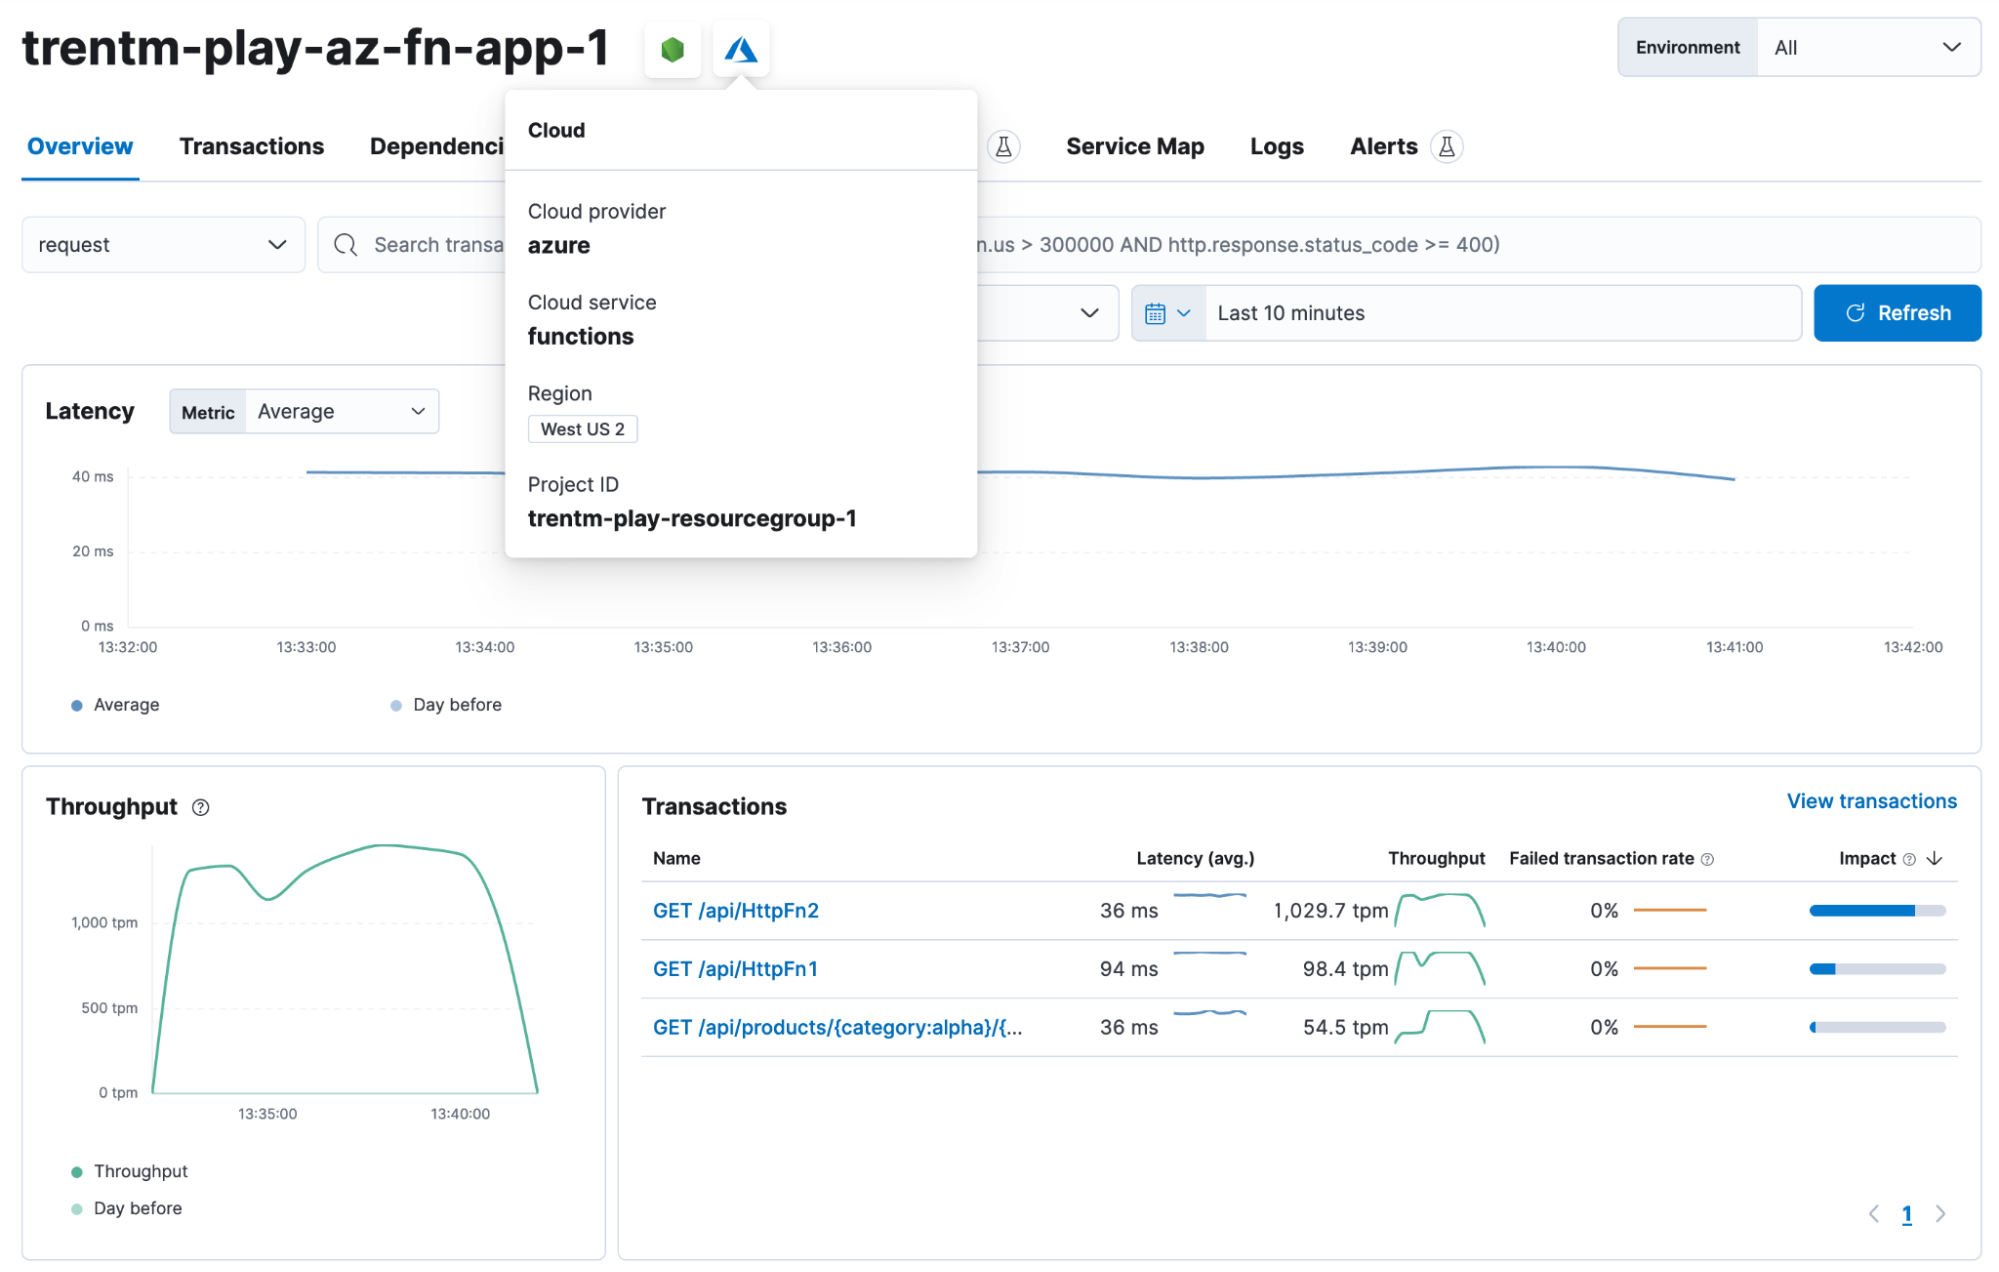
The following screenshot shows the Elastic APM Kibana UI for an instrumented Azure Function App with three HTTP-triggered functions:
GKE Autopilot
Elastic Observability 8.7 adds capabilities for using Elastic Agent to monitor GKE Autopilot clusters. This mode of Kubernetes operation lets Google manage your cluster configuration, scaling, and security, while you focus on building your application.
Elastic has worked with Google to certify Elastic Agent for use with GKE Autopilot and Anthos. Elastic Agent can be deployed on a GKE Autopilot cluster, and Kibana can be used to monitor its behavior with out-of-the-box dashboards.
The changes required from a standard Elastic Agent deployment for the validated method to deploy Elastic Agent in Autopilot are minimal and you can get started on it today with these few steps.
Try it out
Read about these capabilities and more in the release notes.
Existing Elastic Cloud customers can access many of these features directly from the Elastic Cloud console. Not taking advantage of Elastic on cloud? Start a free trial.
The release and timing of any features or functionality described in this post remain at Elastic's sole discretion. Any features or functionality not currently available may not be delivered on time or at all.
Share
- Share on Twitter
Share on Twitter
- Share on LinkedIn
Share on LinkedIn
- Share on Facebook
Share on Facebook
- Share by Email
Share by Email
- Print this page
Print