Elastic on Elastic: Deep dive into our SIEM architecture
Elastic on Elastic
The Elastic Infosec Detections and Analytics team is responsible for building, tuning, and maintaining the security detections used to protect all Elastic systems. Within Elastic we call ourselves Customer Zero and we strive to always use the newest versions of our products.
In this series of blog posts we will provide an overview of our architecture, what data we send to our clusters, how and why we use Cross Cluster Search (CCS) with the Security and Machine Learning (ML) applications, and how we tune, manage and notify analysts for those alerts.
Overview of the Elastic Infosec environment
Many cybersecurity products and security controls are built to support a traditional “Corporate Network” with workstations and servers on a local network, secured by a firewall. When an alert fires and you need to conduct forensics on a host, you physically go to the system to dump memory and image the hard drive. At Elastic we are not a ‘traditional’ company by design, so the Infosec team has to be innovative and flexible to secure Elastic without trying to force the company into a mold ‘in the name of security’. Luckily, the Elastic Stack is the perfect solution for this.
Elastic is a worldwide company that is distributed by design with customers and employees in over 80 countries around the globe. Most of our employees are 100% remote, conducting their daily work from an Elastic owned laptop connected to the internet, via untrusted networks around the world. As an open source company, our source code is on GitHub and our Continuous Integration and software build systems are cloud based and publicly visible to contributors. Successfully monitoring and conducting forensics in this modern, distributed enterprise network requires collecting the right information and having it all available to analysts in a single location.
In addition to our workstations and enterprise systems, we monitor and protect Elastic Cloud which provides Elastic SaaS services currently running over 37,000 Elastic clusters in more than 40 cloud regions hosted in AWS, GCP, Azure, and IBM. Elastic Cloud is a separate elevated privilege environment managed by the Cloud team, but the Elastic Infosec team is responsible for creating, monitoring, and responding to alerts there as well.
Zooming in on Elastic Infosec infrastructure
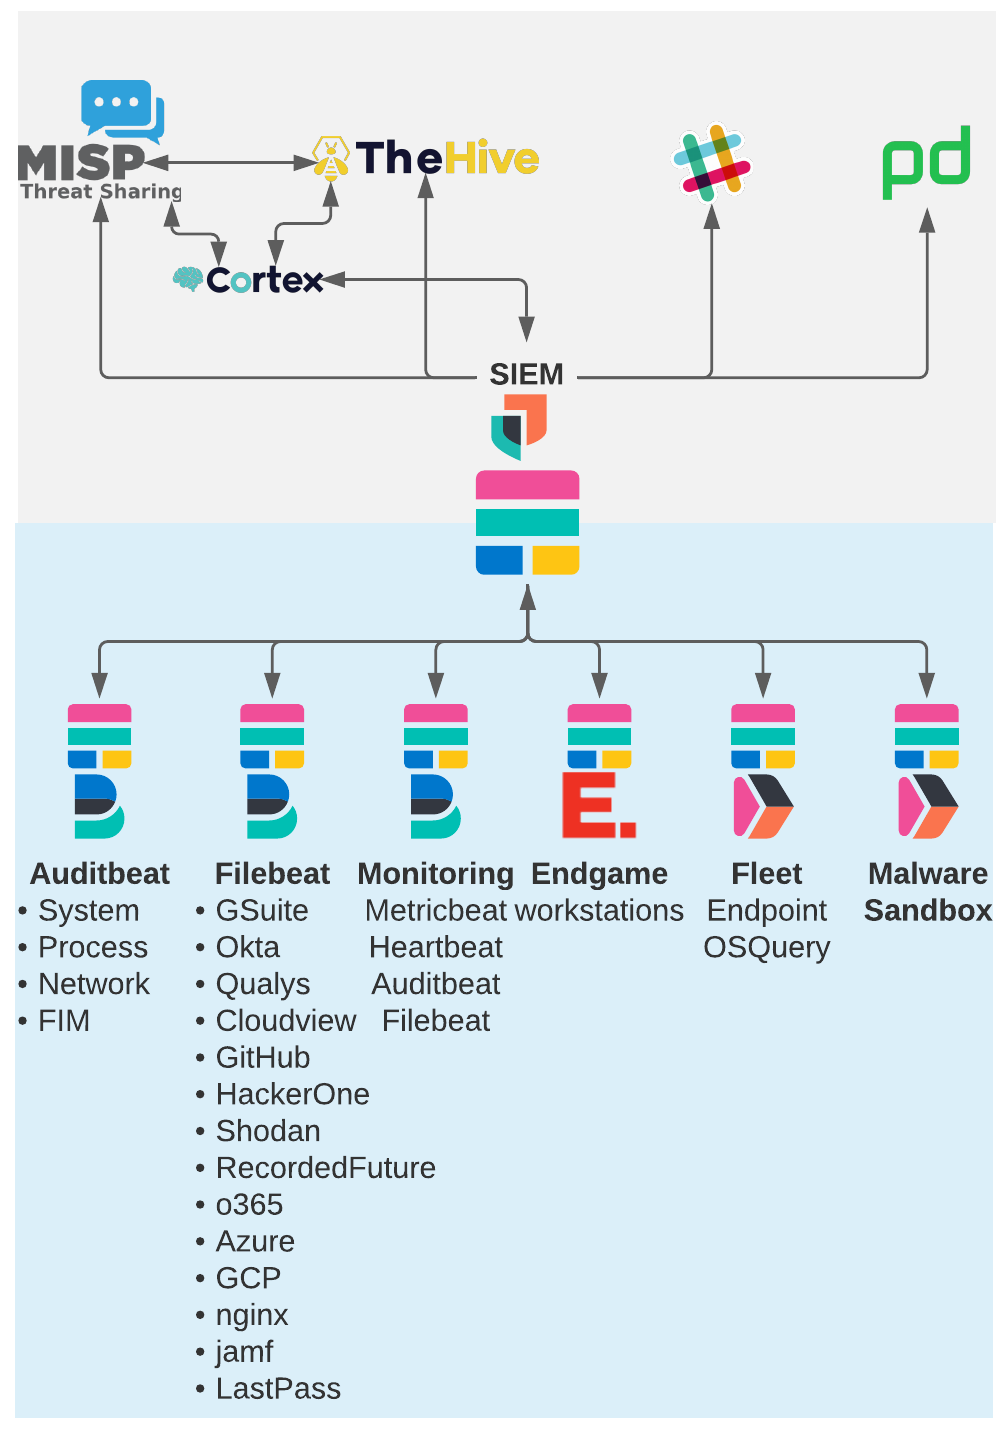
The Infosec’s Security Engineering (SecEng) team builds and maintains our collection of clusters using Elastic Cloud on Kubernetes and Helm to deploy infrastructure and remain up-to-date. SecEng manages seven different clusters; Six ‘data’ clusters with different roles, and a seventh ‘search head’ cluster as our security information and event management (SIEM) that uses CCS to query and alert on the data in all of the other clusters. We use the most recent stack versions and release candidates with real-world data, so stack developers will regularly use our clusters to find and fix problems and to improve the Elastic stack for our customers.
A key to being able to successfully monitor and protect any organization is to collect the right data and to have it searchable in a single location. There is no single data source that has everything you need for Infosec. A common challenge many orgs face is logging and storing the right types of data, but storing each type of data in its own separate location. Sometimes the data has to stay separate due to different sensitivity or privacy levels, often the data sources are owned and maintained by different teams, and sometimes it is due to the costs of transferring data to a single location. With the power of CCS we are able to keep the data stored in separate clusters and still search and alert on that data from a single Kibana interface giving analysts the complete picture.
With all of the information visible in a single location the Analysts can build their Detection, Threat Intel, and Incident Response environments within the Elastic Stack. When investigating an alert we can use Timelines in the Security app to investigate an alert by querying for a value across every index. In addition to the Security App timelines, we also use multiple custom ‘Investigation’ dashboards to quickly display the information we need from all of the various indices.
Critical alert scenario
Imagine a scenario where we receive a critical alert that an employee’s Okta account may be compromised. We can also see that there were some low risk behavioral alerts for that user’s workstation in the last month that were initially dismissed as false alarms but now require a second look. We can use the User Investigation dashboard to search with that user’s email address and quickly review all of their Okta authentication activity, any apps accessed using Okta Single Sign On, any Google Drive files that they accessed or changed, GitHub activity during this time, and any o365 files that were accessed during the time when their account may have been compromised. A dashboard panel displays the JAMF system inventory about the work laptop issued to that user as well as the user’s contact information.
Using the system information we can pivot to the Host Investigation dashboard to see all activity on that system and if it has been compromised as well or just the Okta account. Seeing that there was no logged in user at the time of the alerts lets us know that the system may be compromised and needs to be isolated. The Okta events contain the IP address that was used to log in, we can also search for this IP to see if it has been seen in any of our other data sets such as the cloud services at that time.
Investigations like this can be extremely time consuming if you do not have all of the events available in a single location. Without centralized collection of your events you will need to log into each of the hosted services administration consoles to review the logs within their environment.
Cross Cluster Search for the win
The initial reason we decided to use CCS was that we already had existing clusters containing the data, but we wanted to have all of our data searchable from a single cluster to simplify the management of watchers, dashboards, Machine Learning jobs, and detection engine rules. Instead of migrating all of the data into a single cluster we decided to use CCS. Before CCS, we had to maintain all of those objects and configurations in multiple clusters, often duplicating work across clusters.
When investigating an alert we previously had to open multiple browser tabs to view the various data sources about the event. Now, when we investigate an alert we can create a case and timeline in the Security App that contains every event related to the case. For example, if we see an alert for strange activity on a server in the auditbeat data and the event contains an IP address we can query for that IP within a Timeline on all indices and quickly see if that IP was seen on any of our other services such as the nginx proxy data, Okta, GitHub, Cloud provider logs, Endgame workstation events and more. Thanks to ECS the fields have a standard format across all of the index patterns so a query for source.ip will return documents from any index with a match.
In addition to these initial reasons, we have found many more advantages to this setup. Below are some of the many advantages we’ve found to using Cross Cluster Search for security.
- Storing different types of data in separate clusters means we don’t have a single point of failure for all of our data. When upgrading a cluster, all of the other clusters are available to use.
- We can grant developers access to test and troubleshoot on a specific data cluster without granting them access to all of the data used by Infosec.
- Data from Observability and APM clusters is often very useful to security analysts during an investigation. Rather than duplicating all of the data, we can add the remote clusters to our CCS configuration.
- Analysts can be given elevated privileges to build and manage alerts and indices on the SIEM cluster with read-only access to the original data on the remote cluster. This gives analysts full capabilities in Kibana while protecting the integrity of the original data for audit and regulatory purposes.
- Upgrading the primary ‘search-head’ Elastic cluster to a new version will grant you access to all of the new Kibana features, even if the other clusters have not been upgraded yet. This takes a lot of stress out of upgrading your production SIEM early and often because it lets you test out the newest features without risking an outage to the clusters that contain the actual data.
- As of 7.13, Fleet users must have superuser privileges on the cluster. We can keep the number of Fleet administrators very small on the fleet cluster while granting all other users read-only privileges to the events collected by the Fleet cluster.
Customer Zero continued
In this post we walked through an overview of how Elastic’s Infosec team uses the many capabilities of the Elastic stack to gather data from many different data sources in order to provide Analysts with incredible visibility into security related events.
Be sure to check back for our second part of this series which will dive into the types of searchable data in the Elastic SIEM and how you can help your teams simplify and streamline their efforts.