Elastic on Elastic Series: Data collected to the Infosec SIEM
The Elastic Infosec Detections and Analytics team is responsible for building, tuning, and maintaining the security detections used to protect all Elastic systems. Within Elastic we call ourselves Customer Zero and we strive to always use the newest versions of our products.
In this series of blog posts we will provide an overview of our architecture, what data we send to our clusters, how and why we use Cross Cluster Search with the Security and Machine Learning (ML) applications, and how we tune, manage and notify analysts for those alerts.
In the previous blog post we provided an overview of our internal Elastic infrastructure that we use in Infosec and how we use Cross Cluster Search to connect multiple clusters into a single interface for Security Analysts. In this blog post we will go into more detail about the specific types of data we collect.
Types of data searchable in our SIEM
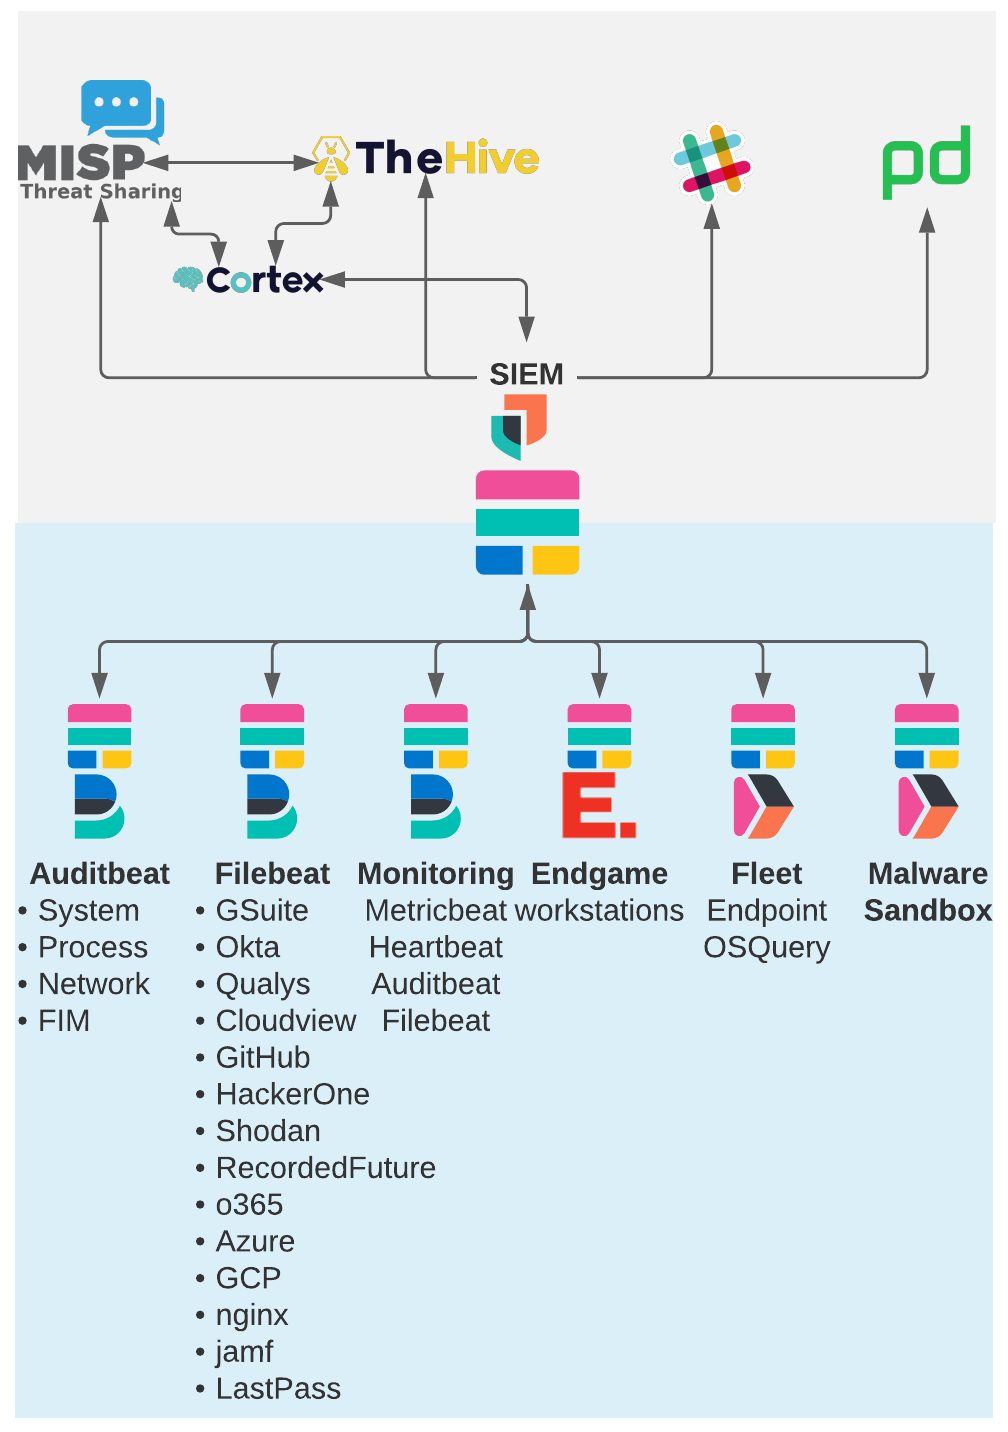
Auditbeat Cluster
We use Auditbeat to monitor activity on all of our Linux servers and containers. We use the auditd and System Module to collect process execution, logins, network connections, system information, and the File Integrity Module for monitoring of critical files. We use several processors in the auditbeat config to filter and enhance the data as we as it's collected.
- We use drop_event processors to filter out known good events from being logged. This lets us keep our costs down when centrally logging events from cloud systems. The drop_event process lets you write complex filters to remove your noisiest events before they ever logged.
- add_process_metadata is used to add the parent process information to process events. Many of the Security app detections use parent-child process relationships to identify strange behavior so having this processor is critical.
- add_cloud_metadata adds the cloud information to each event making it easier to identify which cloud provider, region, and account a system belongs to.
- add_docker_metadata to add container ID, name, and labels to the event.
- include_fields lets you add custom fields to a config. We use it to add custom ‘config.version’ and ‘team’ fields to the events so we can easily identify the owner of the system and any systems using an older version of the auditbeat config.
Filebeat Cluster
Our Filebeat cluster is where we use Filebeat to collect logs from the many third party systems we use at Elastic. Some of the third party services have built in Filebeat modules that make it very easy to to configure and collect the events in ECS formatting. The following built in Filebeat modules are being used:
- Okta Module collects events from the Okta API and it is used for many of our detections and investigations. We use Okta for Single Sign On to many applications in Elastic so having these logs is critical to identifying who accessed what.
- Office 365 Module is useful for security to monitor access to documents, and Azure AD authentication.
- Nginx module collects access logs from the proxies in front of our critical web services. This can be very useful for tracking access or alerting on strange activity and web attacks.
- Google Workspace module collects events from Gmail, Google Drive, and other Google services
- Google Cloud Module to build alerts and investigate activity in GCP
- AWS Module to build alerts and investigate activity in AWS
- Azure Module to build alerts and investigate activity in Azure
Sometimes a built-in Filebeat module doesn’t exist so the SecEng team will have to build custom scripts and configurations for Filebeat to collect the information we need. The following logs are being collected in this way:
- Qualys - a script retrieves the results from our Qualys scans from the service and then converts the results from XML to json where it is then ingested by Filebeat. In addition to visualizing and alerting for Vulnerability Management, the Qualys data can be used to enrich other events. For example, if we see an alert for an exploit, and according to Qualys the host is vulnerable to that exploit we can elevate the priority of the investigation.
- Github - The Github events API is used to collect events about activity in all Elastic Owned repositories.
- HackerOne - Submitted reports from our bug bounty program.
- Shodan - The Shodan API is used to gather information for our Threat Intel team tracking exposure of Elastic clusters.
- RecordedFuture - Threat Intel feeds ingested for enriching events.
- Jamf - Inventory information about our Fleet of Mac systems. This makes it easier to find the registered owner of the system.
- LastPass - Activity from our corporate LastPass subscription.
Monitoring Cluster
A Monitoring Cluster cluster is used to collect monitoring information from all of the other clusters. This information is used to audit activity on the other clusters and our Endgame SMPs as well as to monitor the performance on those clusters. Metricbeat, Filebeat, and Auditbeat logs from all of the other clusters are stored on this cluster.
Endgame Cluster
We use Endgame to secure all of the workstations used by Elasticians around the globe. In addition to being amazing at preventing attacks, Endgame can easily be configured to stream events to an Elastic cluster where we can use the machine learning and detection engine capabilities as well. Streaming the events to our SIEM lets us see the entire picture of activity on Elastic systems with the workstation events in the same dashboards and visualizations as the Okta SSO, Google Workspace, and other events.
Fleet Cluster
Our fleet cluster is where we manage the Elastic Agent and its new integrations such as Endpoint Security and OSquery. With Fleet you can deploy Elastic Agent to systems to collect observability data and have the ability to deploy and remove integrations to the Elastic Agents to collect additional data as needed.
Because we are using Endgame for endpoint protection on our workstations we are not yet using the Endpoint Security fleet integration at scale. As the Endpoint Security integration reaches feature parity with Endgame we will be migrating our systems off of Endgame and onto Endpoint Security. We cannot deploy Endgame and Endpoint Security to the same systems at the same time because they are not compatible with each other. All of the other Elastic Agent integrations can be used with Endgame.
The primary Fleet integration we use at this time is the OSQuery Manager integration. The OSQuery Manager lets us schedule and run live OSQuery queries to actively gather information from our fleet of systems. OSQuery is an open source project that enables analysts to directly query their systems to gather information such as running processes, installed applications, disk encryption status, named pipes, installed Chrome extensions, and over 250 other types of queries. For a more in depth dive on how we use OSquery Manager at Elastic we presented this Webcast with the SANS institute: https://www.sans.org/webcasts/operationalize-osque...Malware Sandbox
This cluster is another Fleet server but this one is used only for deploying Elastic Agent to analyst VMs to instrument them as a Malware Analysis Sandbox. Rather than having each analyst maintain their own cluster for this the SecEng team created a single managed cluster that all of us can use to manage log collection from our Sandbox VMs. The ability to manage Fleet and to add and remove agents and policies dynamically requires Super User privileges on the cluster so this activity needs to be a separate cluster from the production clusters. With CCS All of the analysts can see the logs from this cluster which means we can have one Analyst detonate and analyze the malware on their sandbox but everyone has access to the events that were created. These events can then be added to a case and we can use the indicators of compromise from the sandbox to quickly search through our live data for any evidence of compromise.
Customer Zero continued
In this post we walked through the types of searchable data in a single Elastic SIEM interface and how we use that data for Security Detection, Incident Response, Threat Hunting, Threat Intelligence, Compliance Auditing, and Vulnerability Management.
Be sure to check back for our Third part of this series which will show you how we configure the Security app and Detection Rules to work with Cross Cluster Search.