Elastic Infrastructure GA Released
We are excited to announce general availability of Elastic Infrastructure, a turnkey solution for monitoring infrastructure metrics using the Elastic Stack. To experience it, spin up the latest version of the Elastic Stack in Elasticsearch Service (on Elastic Cloud) or download and run it locally.
Elastic Infrastructure works in concert with Metricbeat, an open source shipper for metrics data, to provide an easy way to see a high-level view of hosts and containers in the context of key metrics coming from these infrastructure components. Users can group these entities by key fields and then drill down into metrics, logs, and APM traces in the context of the infrastructure component they select.
We released the Infrastructure app in 6.5 as beta, and based on the feedback from you, we’ve been hard at work to improve it. Thank you to all the users that have tried out the product and engaged with us on Discuss and Github.
Below we describe some of the key improvements we made on the road to GA.
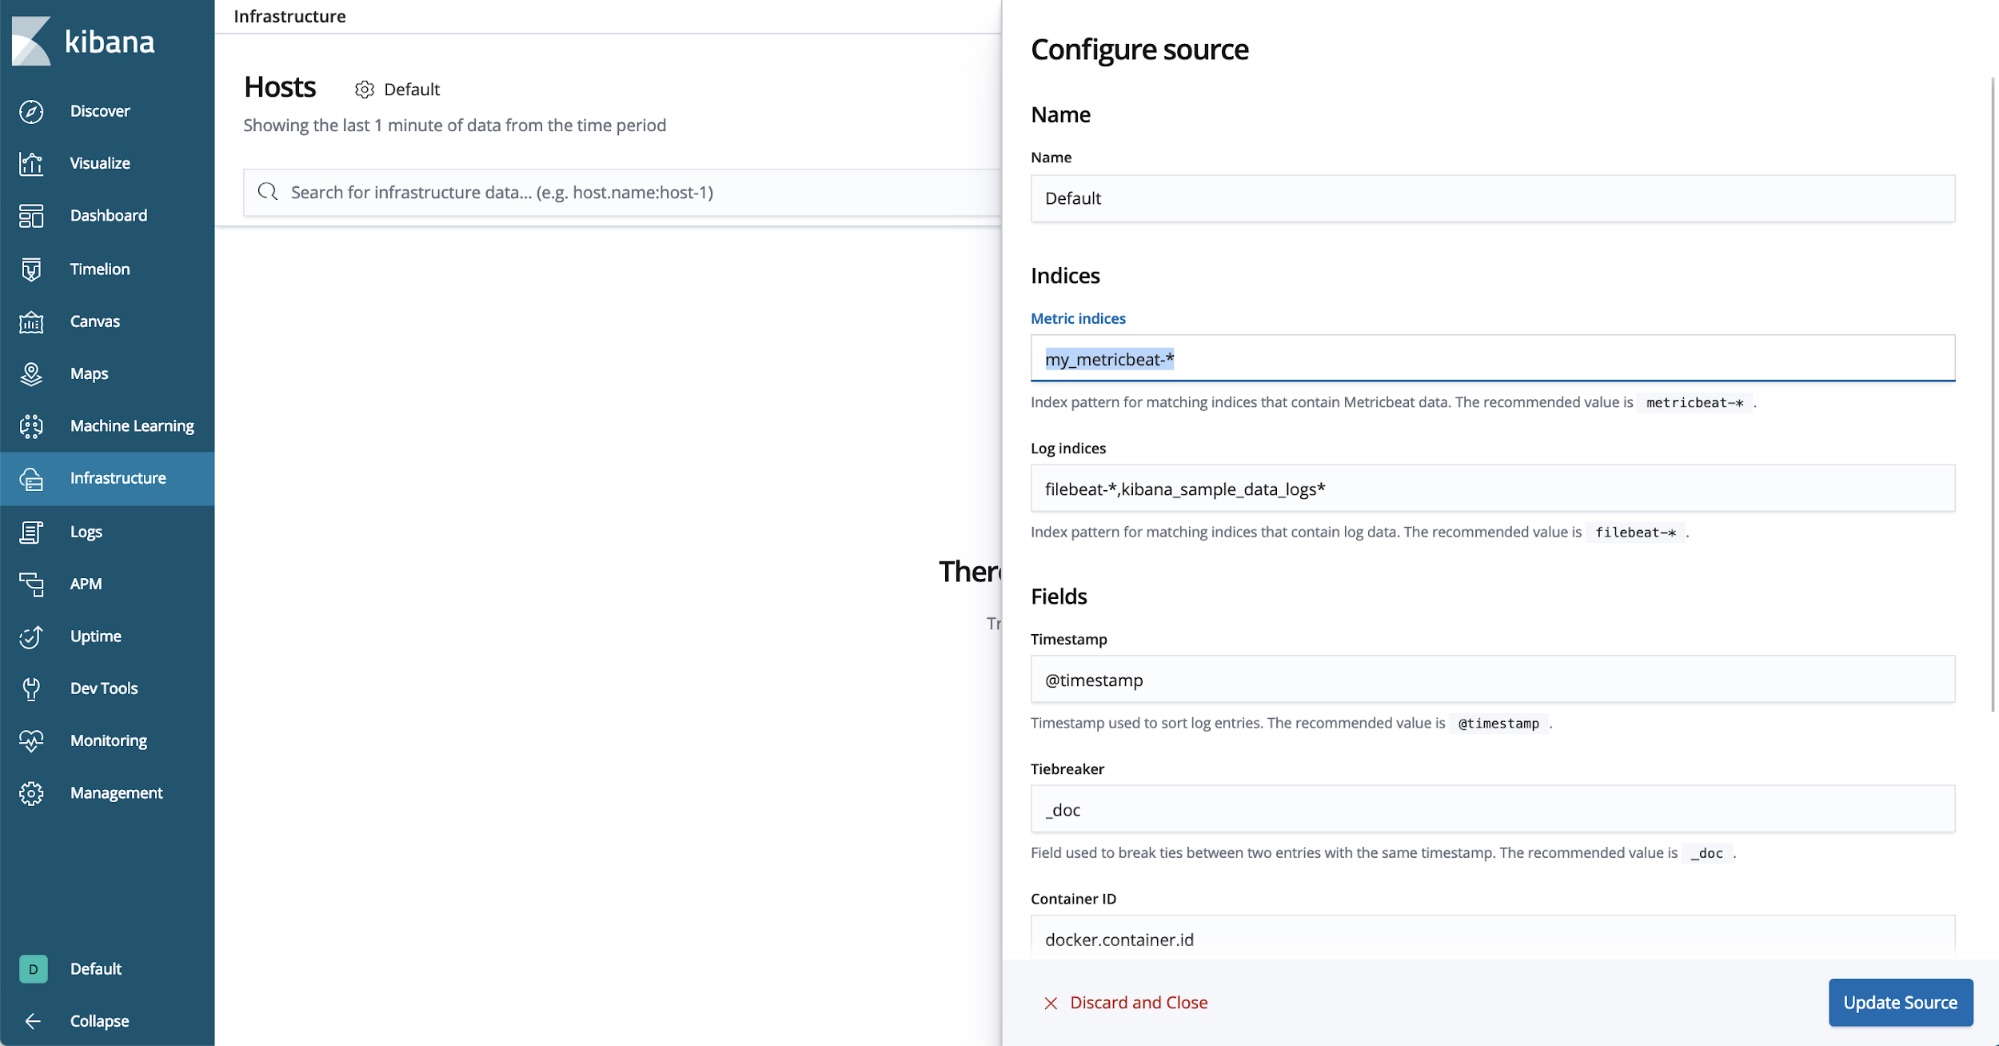
Source Configuration UI
The Infrastructure UI works out of the box with Metricbeat default index and field names. If you change those defaults, it was previously possible to specify custom index names in kibana.yml. The 6.7 release makes that process easier by adding an in-context flyout for configuring these settings from within the Infrastructure application.
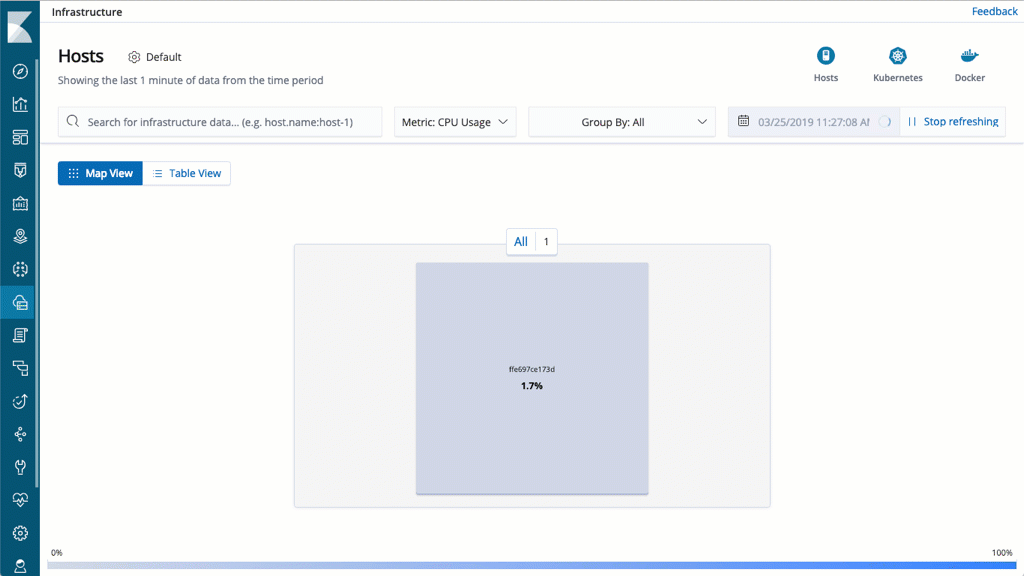
Neutral color gradient
The traditional red-yellow-green color scheme for indicating the range of metric values represented in the Map view works for many scenarios. But in some cases, the metric you are plotting is not necessarily good or bad, so a neutral color gradient makes more sense.
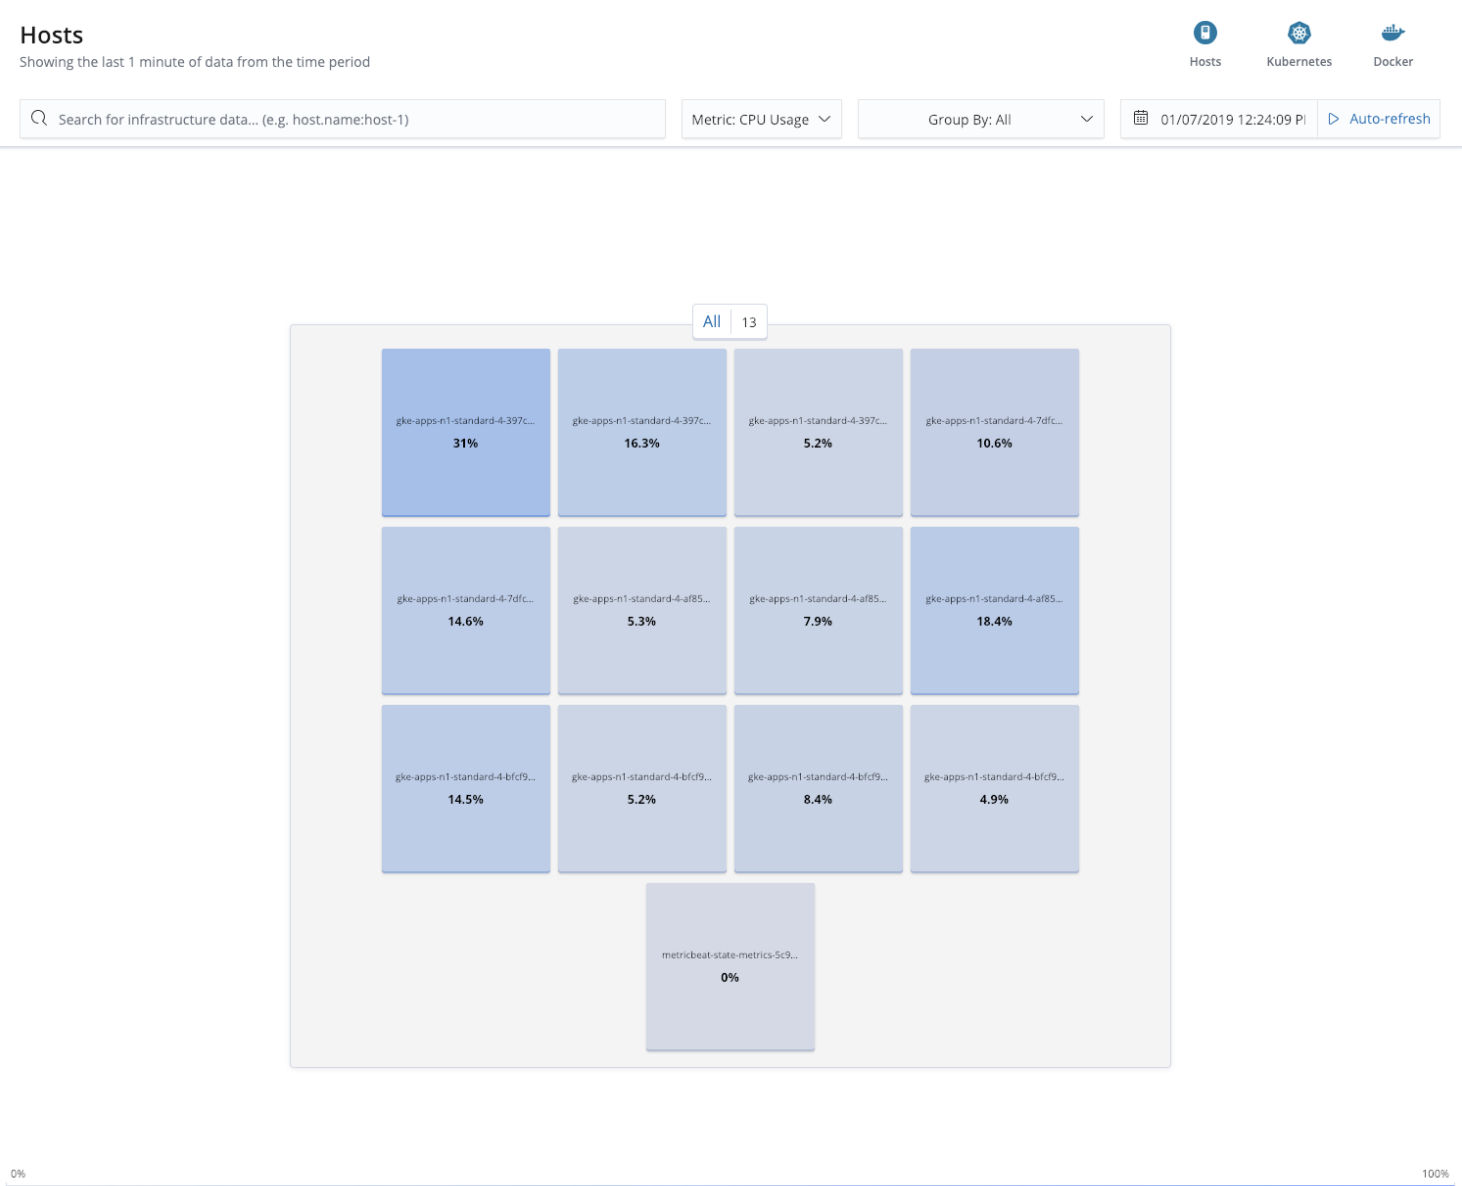
Group by any field
When looking at infrastructure, grouping by custom fields and tags is as important as having sensible defaults. Now you can easily group your servers or containers in the Map view by ad hoc fields, and have those fields appear in the drop-down for easy access in the future.
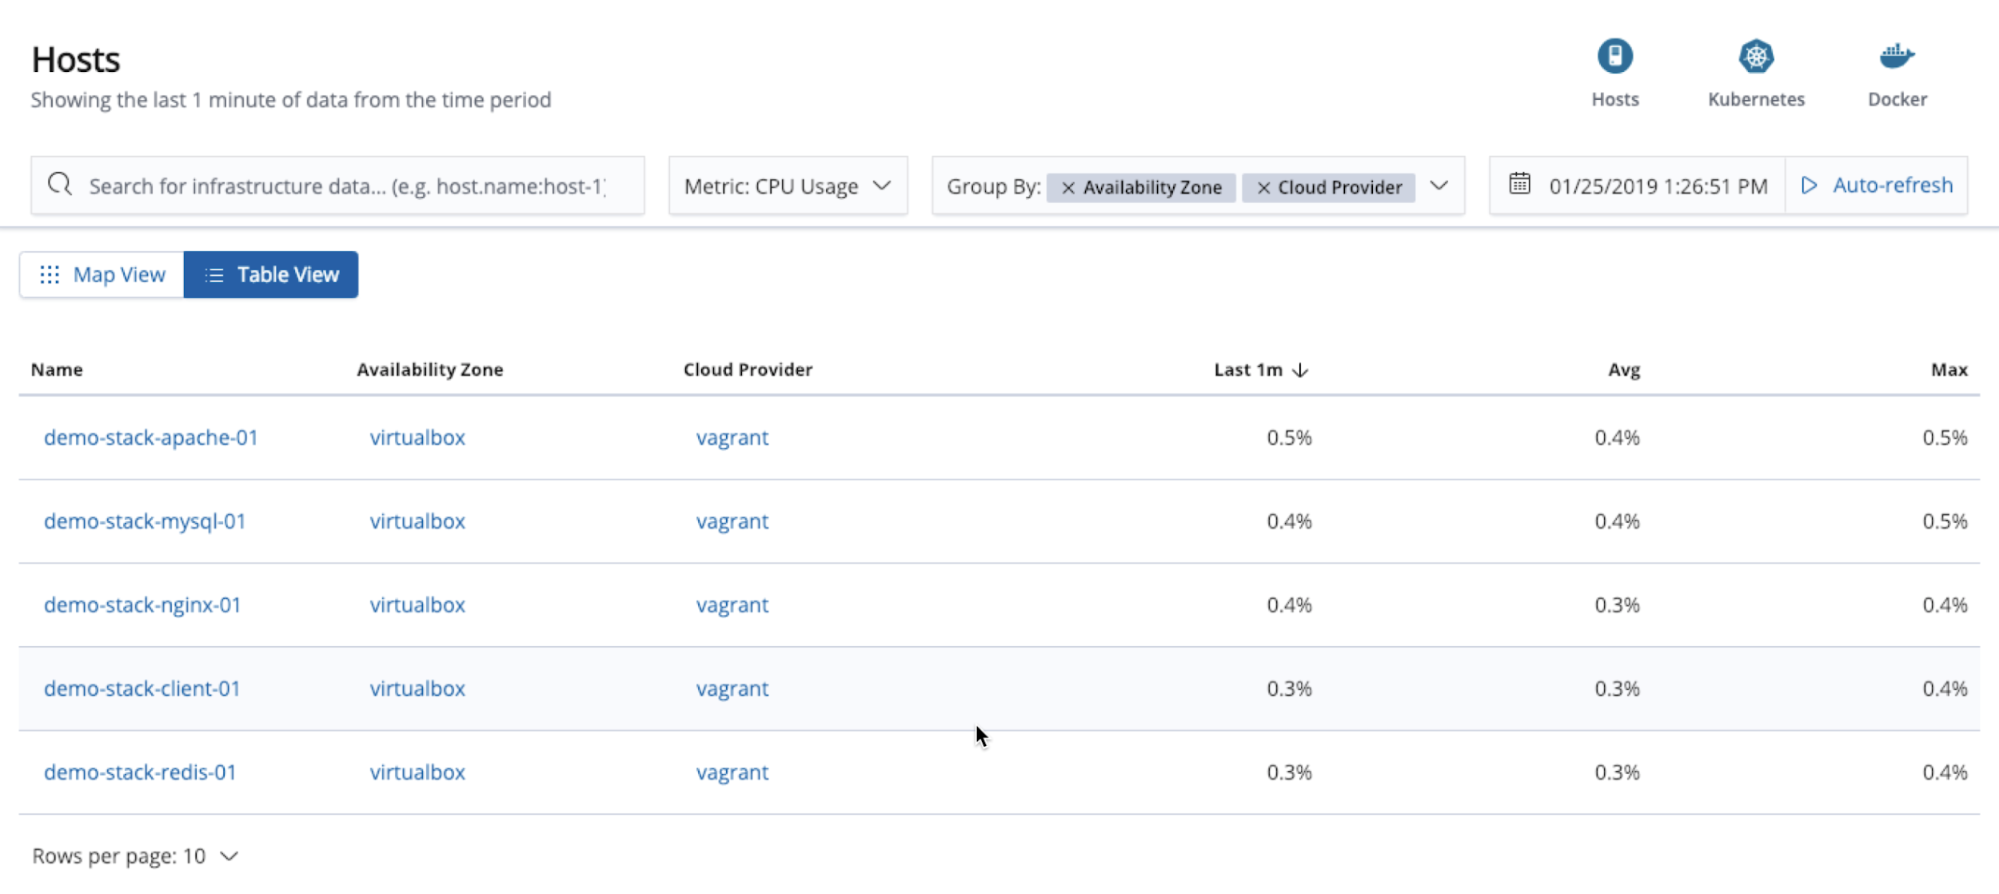
Infrastructure table view
The Map view is great, but sometimes you just want to see a table and sort your infrastructure components by key attributes. To do that, switch over to the Table view with just one click, without losing context.
Newly supported metrics data types
Demand for turnkey metrics collection using the Elastic Stack continues to grow. In 6.7 we added support for MariaDB and Percona as part of our MySQL database module.
In addition to that, we’ve been hard at work to bring many of the existing Metricbeat modules to general availability. Among these are a number of modules from the Kubernetes ecosystem -- Traefik, etcd, Envoy Proxy -- as well as modules for Windows, RabbitMQ, Couchbase, golang, php_fpm, Memcached, and ceph.
See summary table below and read details at individual module pages in the Metricbeat documentation:
|
Module |
Status |
|
MariaDB support in MySQL module |
New in 6.7 |
|
envoyproxy, traefik, etcd |
Moved to GA |
|
Aerospike, Ceph, Couchbase, Golang, Memcached, Munin, PHP_FPM, RabbitMQ, uwsgi, Windows |
Moved to GA |
Observability using the Elastic Stack
The 6.7 release also brings general availability of the Logs and Uptime solutions. In addition to APM, these solutions are a part of the broader ‘observability’ story using the Elastic Stack.
What’s next
To experience Elastic Infrastructure, spin up the latest version of the Elastic Stack in Elastic Cloud Elasticsearch Service or download and run it locally.
This GA release means you can use this solution in production, but that does not mean that we are done! We are going to continue evolving and improving Elastic Infrastructure. Please do not hesitate to engage with us on Discuss with questions and feedback.