Kubernetes Observability
Monitor Kubernetes with Elastic, diagnose what broke, and see how much error budget it burned.
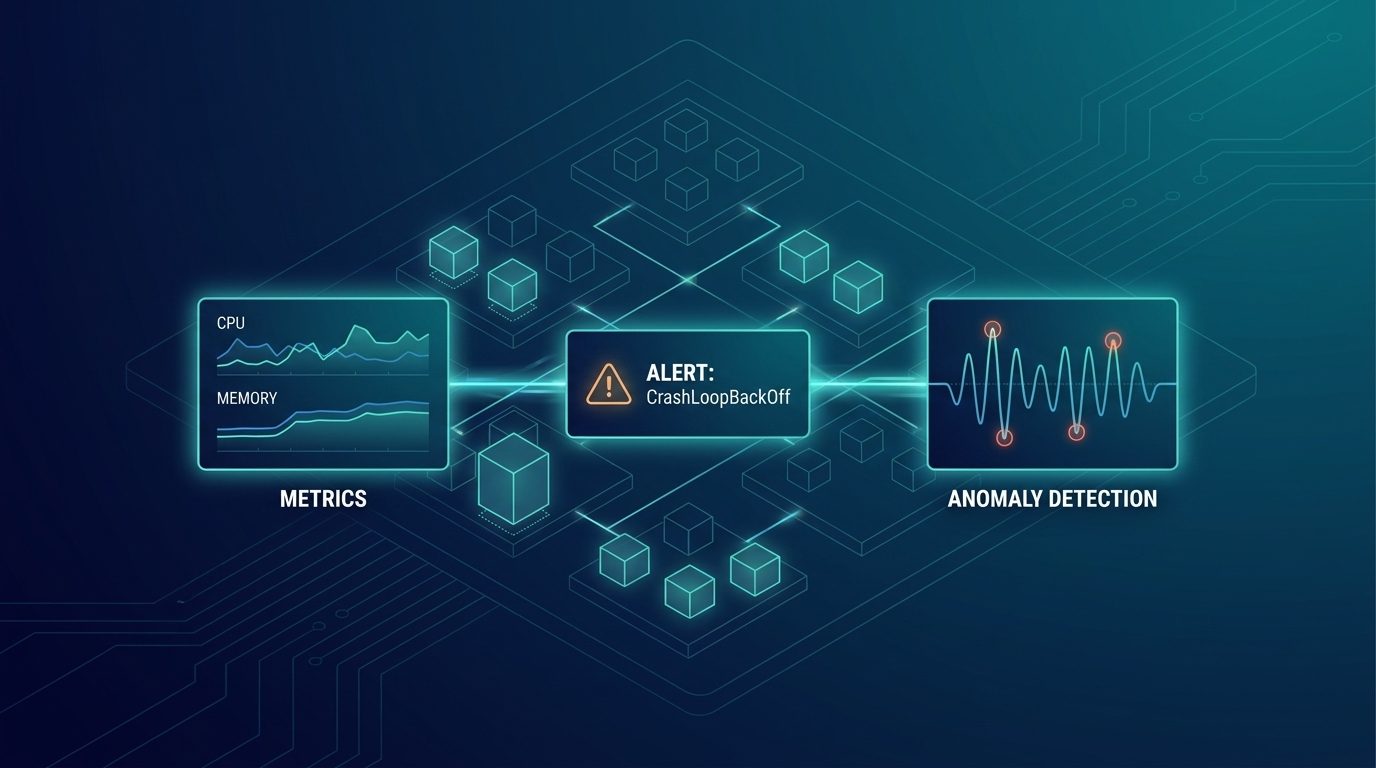
Kubernetes Observability from alert to root cause: Dashboards, Alerts, and Anomaly Detection with Elastic
Kubernetes observability with Elastic includes dashboards, alert rules, and ML anomaly detection for alerts with root-cause context.
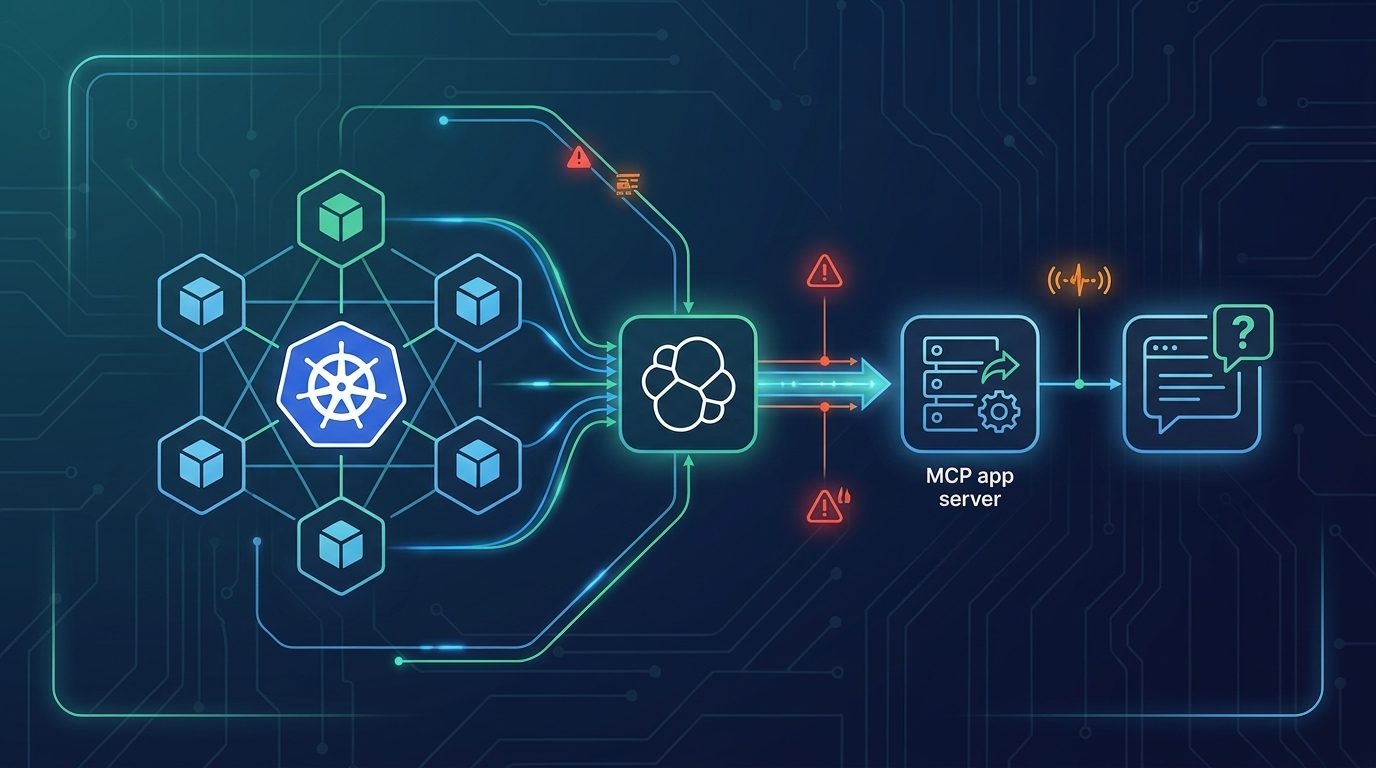
Agentic Powered Kubernetes Investigations with Elastic Observability and MCP
See how Elastic's Agentic powered Kubernetes observability uses MCP App, agent skills to let agents investigate clusters, detect anomalies, and automate root cause analysis.
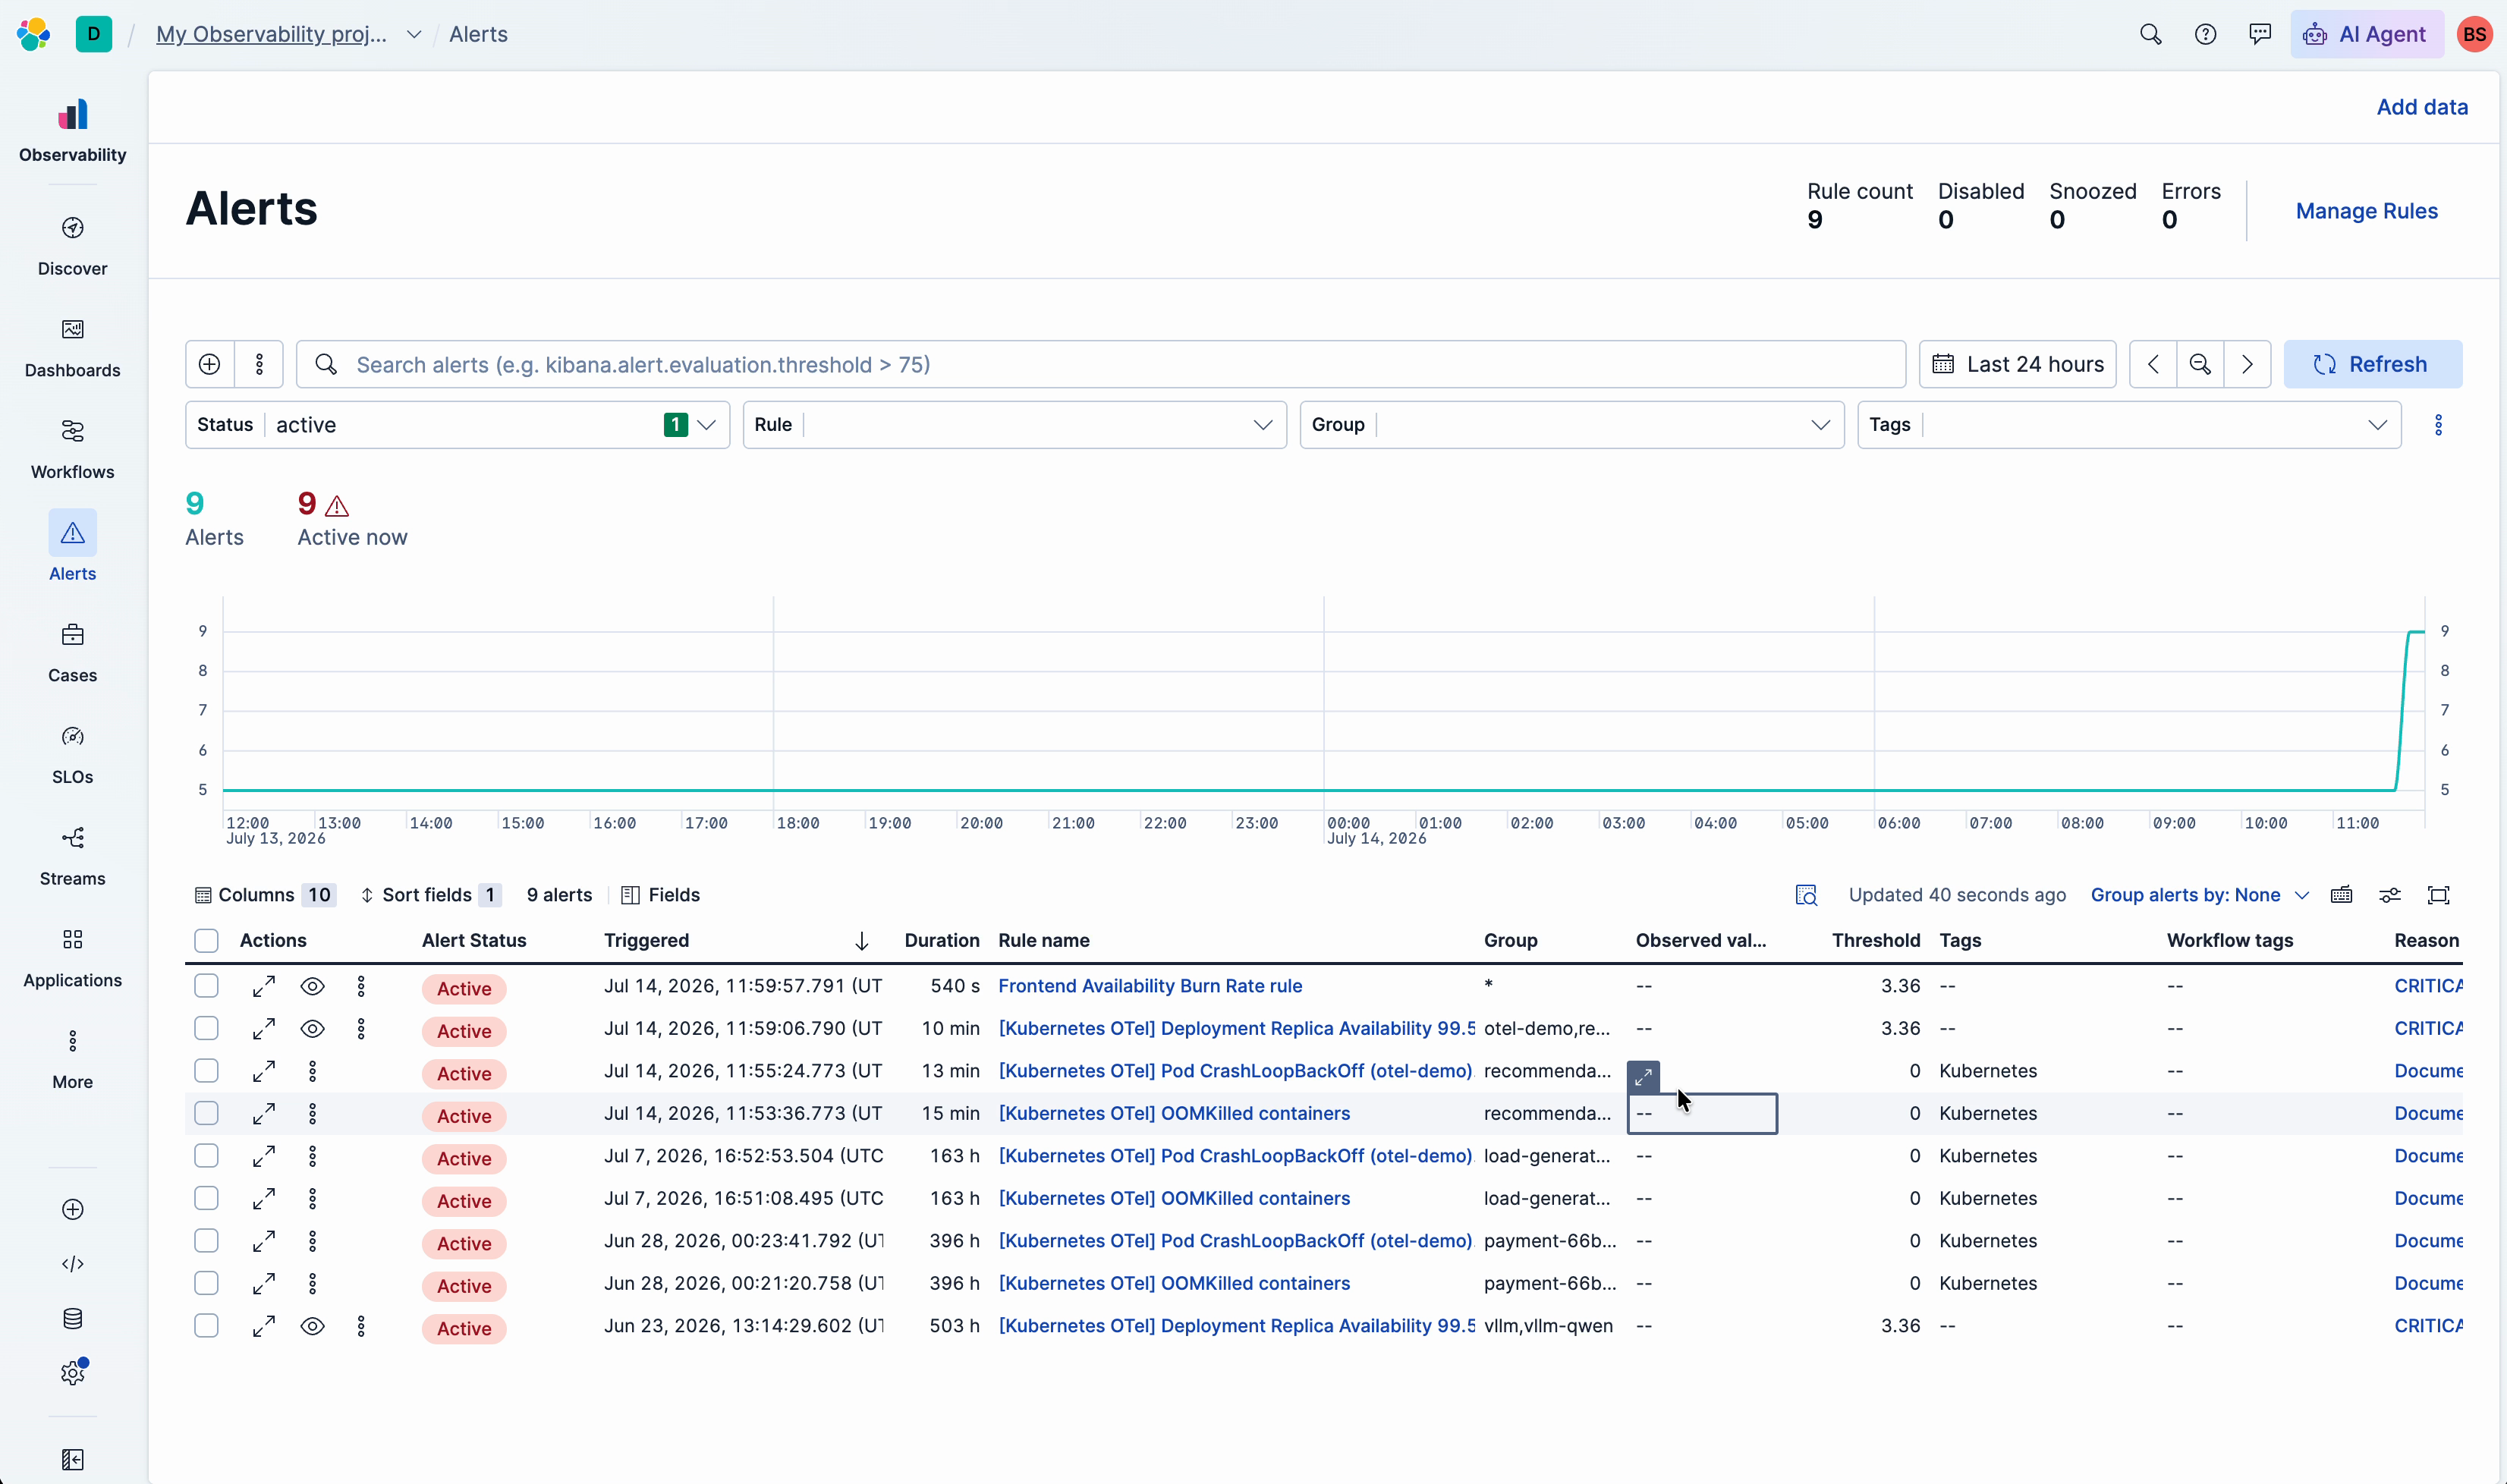
CrashLoopBackOff to root cause in seconds: automating the 20-minute Kubernetes investigation with Elastic Observability
Elastic's Kubernetes Experience fires alongside the CrashLoopBackOff alert and delivers a root-cause hypothesis with evidence before you even open it.

Kubernetes observability: SLO templates that turn alerts into error budgets
Two bad rollouts burned 88% of a 30-day error budget while the SLI still read 99.56%. This post adds four SLO templates that bring burn-rate tracking to the OTel-based alert rules from Part 1, no new instrumentation required.