Elastic 9.4: Workflows GA, Agent Builder updates, and Prometheus/PromQL support


 Share on Twitter
Share on Twitter

 Share on LinkedIn
Share on LinkedIn

 Share on Facebook
Share on Facebook

 Share by Email
Share by Email

 Print this page
Print
Today, we are pleased to announce the general availability of Elastic 9.4 as the latest version of the Elasticsearch Platform. In addition to including new features that help developers with context engineering, application and infrastructure monitoring, and AI-powered security operations, Elastic 9.4 introduces a broad set of capabilities in Elastic Search & AI, Elastic Observability, and Elastic Security.
So, what’s new in Elastic 9.4?
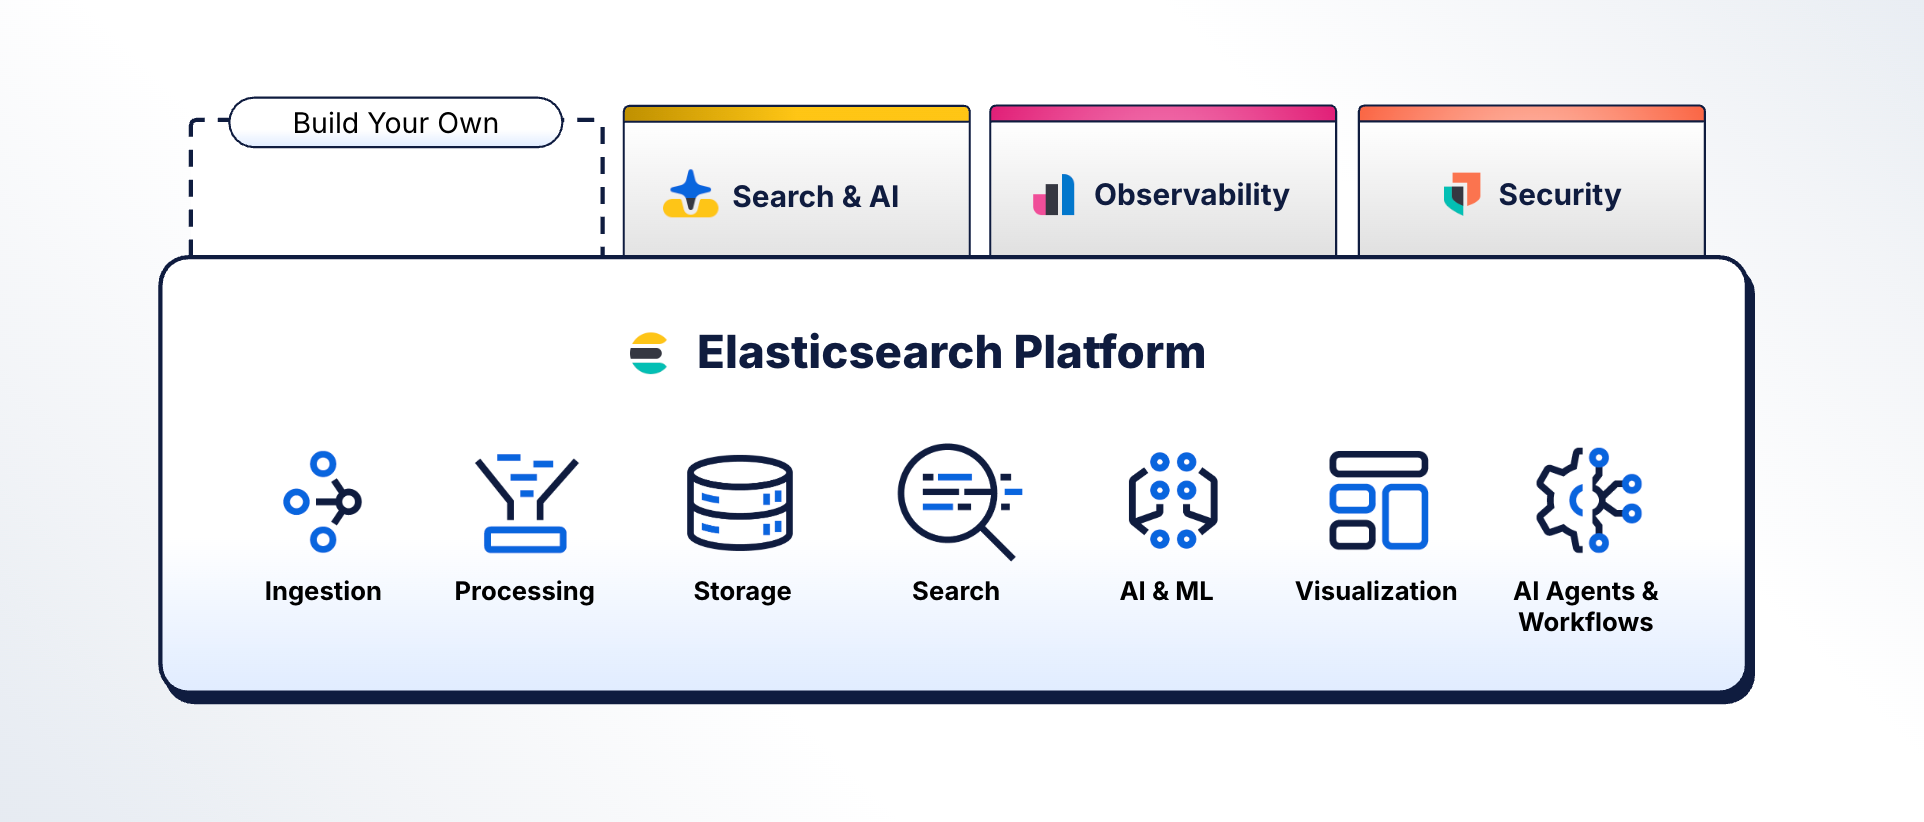
Elastic 9.4 is a reflection of where the Elasticsearch Platform is headed. At the center of this release are significant advancements with respect to Elastic’s role as the context and retrieval layer for AI, a thread that runs through each of the following highlights:
Elastic Agent Builder has been extended to optimize context with a set of new primitives that control how agents gather context, use it efficiently, and act on it. With Elastic 9.4, Agent Builder features new support for Skills, Attachments, Connectors, and Plugins.
Native Prometheus and PromQL support combined with significant Elasticsearch TSDB efficiency improvements (2.6x more efficient than Prometheus) and the general availability of time-series ES|QL position Elastic Observability as a compelling alternative to Prometheus and Grafana. These best-in-class metrics capabilities build on 15 years of log analytics leadership, creating a unified platform for logs and metrics to help accelerate issue resolution.
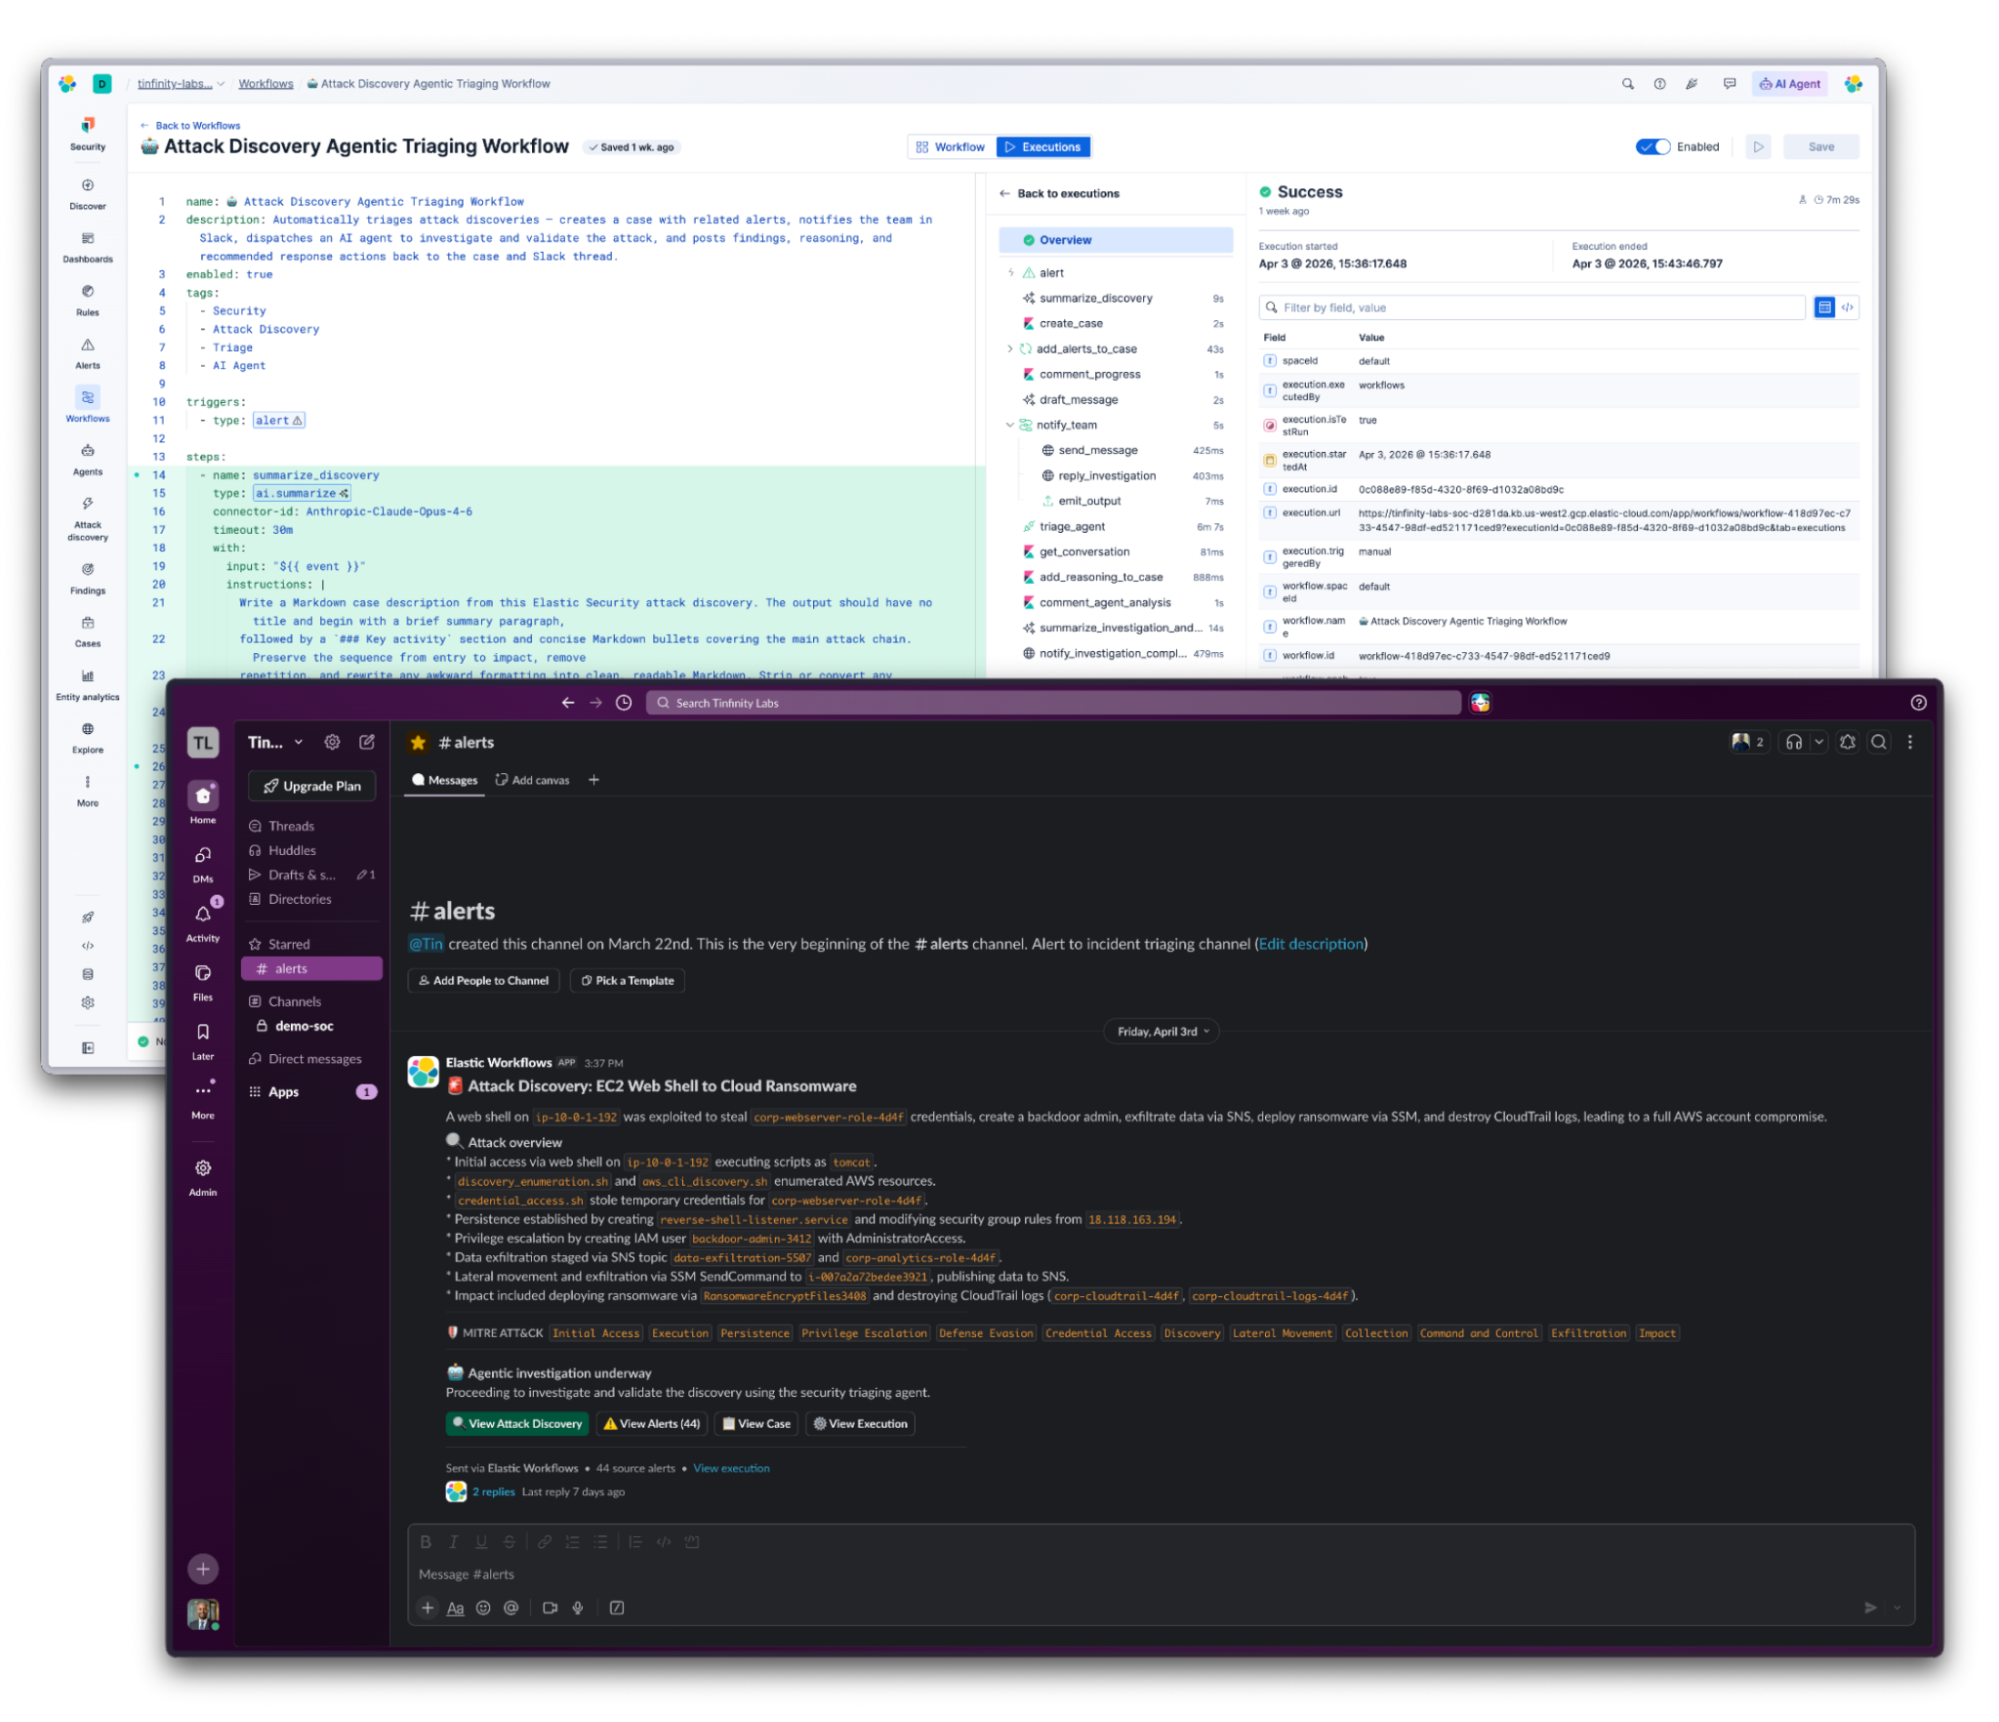
Elastic Workflows is now generally available. It combines both scripted automation and agentic reasoning enabling AI agents to act on their findings. For Elastic Security customers in particular, Workflows brings native automation directly into Elastic Security, automating triage, enrichment, response, and case management where their security data already lives.
Elastic Security also delivers four new Entity Analytics capabilities in 9.4: Precision Entity Identification, Entity Resolution, Dynamic Watchlists, and Entity-Driven Hunting Leads. Together, these capabilities give analysts one authoritative record per person — with aggregated risk, organizational context, and proactive hunting leads built in — and give AI agents that reason over security data more accurate context to work from.
The Elasticsearch Platform delivers four additional advances: DiskBBQ, Elasticsearch’s best vector indexing and search algorithm, has been updated for improved performance; GPU-accelerated vector indexing powered by NVIDIA cuVS graduates to general availability (delivering up to a 12x improvement in indexing throughput); ES|QL can now query, filter, and aggregate on any field present in ingested data even without an explicit mapping; and both Elasticsearch and Kibana receive full-stack FIPS 140-3 compliance.
Read about these and additional highlights by solution below.
The Elasticsearch Platform
Elastic 9.4 delivers an Elasticsearch Platform that has grown more capable across four dimensions: automation and orchestration, query language expressiveness, AI-native analyst experiences, and the governance and compliance infrastructure that enterprise deployments require.
Automation and orchestration
Elastic Workflows is now generally available. Workflows is the automation and orchestration layer that connects Elastic to the broader operational world, enabling teams to trigger actions in external systems, coordinate multistep processes, and close the loop between what the platform detects and what it actually does about it. Teams building with Agent Builder will find Workflows to be its natural companion: Agent Builder defines what an agent knows and can reason over; Workflows defines what it does when it acts.
ES|QL → A best-in-class query language
ES|QL, Elastic’s premier piped query language, continues to advance in 9.4, adding five new capabilities, all in technical preview, including:
Subqueries enable analysts to run and combine independent pipelines in a single statement, eliminating the need to stitch results across multiple queries by hand.
Approximate Queries trade a small degree of aggregation precision for dramatically faster response times on large datasets with confidence signals so that analysts always know how much to trust the result.
Logical Views enable teams to define complex query logic once and reuse it as a named data source across dashboards, alerts, and ad-hoc queries.
JSON Function Extraction pulls specific elements from any JSON-mapped field or raw _source document using standard path notation — no reindexing or pipeline changes required.
Access to All Ingested Fields eliminates the "ignorance cliff." Fields that were missed at mapping time are no longer permanently inaccessible, giving teams full query coverage over everything they've ingested.
AI-native Kibana
With Elastic 9.4, Kibana is becoming increasingly AI-native. AI-Powered Dashboard Creation (technical preview) enables analysts to describe what they want to see in natural language and watch Kibana build it iteratively, in conversation, with no manual configuration. In addition, Dashboards as Code (technical preview) gives platform teams the complementary capability: dashboards managed as version-controlled and code-reviewable assets deployed through CI/CD pipelines, replacing the fragile (and now “old school”) saved-object export/import workflow entirely. Together, these new features represent Kibana's continued evolution toward a more intelligent, collaborative workspace.
Operate with confidence
Elastic 9.4 also delivers a meaningful set of advances for the operators and compliance teams responsible for keeping the platform healthy, auditable, and secure. Notable enhancements — all generally available — include:
Query activity in Kibana gives administrators instant visibility into every long-running query with its origin and the ability to cancel it in a single click.
Query Logs extends the audit trail to every query across DSL, ES|QL, EQL, and SQL, capturing latency, request origin, and full query body with no configuration required.
Per-user authentication for Kibana Connectors replaces shared service account credentials with individual user identity, giving compliance teams accurate, trustworthy audit trails across integrations.
FIPS 140-3 Compliance, now generally available for both Elasticsearch and Kibana, delivers full-stack coverage ahead of the September 2026 deadline with a clean upgrade path and no data migration required.
Find more details in the blogs linked above and in the Elasticsearch Platform 9.4 release notes.
Search & AI
Elastic 9.4 gives developers building AI agents with Elasticsearch more of what production demands: tighter control over what agents know and how they act, deeper visibility into how they perform, and better economics for the vector workloads underneath them.

Agent Builder enhancements
With Elastic 9.4, Agent Builder has been extended to optimize context with a set of interlocking capabilities and enhancements that control how agents acquire context, use it efficiently, and act on what they find. New capabilities and enhancements include:
Skills, which act as instructional guides that teach the agent how to complete specific tasks and are loaded only when needed
In-chat interaction (and preview) with Kibana objects like dashboards, workflows, ES|QL queries — enabling chat-based creation, refinement, and analysis
A new semantic metadata layer across Elastic and all connected sources like Drive and SharePoint that acts as a discovery backbone for these objects, giving agents rich understanding of data to optimize reasoning
Improved context management with query result offloading, compaction, and summarization that delivers better performance and cost-efficiency for long, multi-turn interactions
In sum, users are now able to create more reliable, lower-cost, and higher-performing agents.
VectorDB enhancements
DiskBBQ, Elastic’s best vector indexing and search algorithm, has improved in Elasticsearch 9.4. Among the many enhancements, query latency has improved by at least 3x for queries with restrictive filters and the performance of vector comparisons improved (thanks to the now extensive use of native code), impacting both indexing and search. In addition, it is now possible to use BBQ to quantize to vectors with elements of two, four, and seven bits, enabling better recall when a single bit is insufficient. Together, these updates will help to ensure an optimal balance of speed and cost-efficiency for your production AI workloads.
GPU-accelerated vector indexing, released as technical preview in Elastic 9.3, is now generally available. By integrating NVIDIA cuVS, an open source library for GPU-accelerated vector search and data clustering, into Elasticsearch, self-managed Elastic customers can expect to see up to a 12x improvement in indexing throughput and 7x faster force merging.
Developer onboarding assistant
A new conversational assistant guides developers from idea to working search implementation in Cursor, Claude Code, and Kibana. It asks what you're building, understands your data, recommends the right approach, walks through mapping and indexing, and generates a working implementation — proactively surfacing Elasticsearch concepts at every step. For teams building their first search application or prototyping a new use case, this replaces hours of documentation reading with minutes of guided building.
Dynamic LLM connectors and Inference Management
New LLM models are now available as connectors between stack releases. Alongside this, Elastic 9.4 establishes a single, authoritative Inference Management experience within the Elastic ecosystem, resulting in one place to manage inference endpoints, models, and connectors across all of your Search & AI workflows.
Find more details in the blog linked above and in the Search & AI 9.4 release notes.
Elastic Observability
AI workloads, Kubernetes sprawl, and microservice proliferation have pushed metrics volumes from millions of time series events into the hundreds of millions. SREs now correlate across more high-cardinality signals, more services, and more ephemeral infrastructure than ever with less time to do it. The existing tools make it worse: On Datadog, custom metrics drive the bill up to 52% on average, so teams strip out high-cardinality labels to stay in budget, then go hunting for those exact labels mid-incident. On Prometheus and Grafana, cardinality still degrades performance, logs and metrics live in separate backends, and correlating a single timestamp means pivoting between two query languages. Either way, teams end up blind at exactly the wrong moment.
Elastic Observability 9.4 brings metrics up to the same standard teams already rely on for logs. Elasticsearch is now the fastest place to run them: 30x faster than Prometheus, 2.6x more storage-efficient, and less than 50% the cost of Datadog with no cardinality limits and no custom metric penalties. Native PromQL support in Kibana means existing queries, dashboards, and alert rules work without modification.
9.4 also introduces the first agentic investigation capabilities in Elastic Observability. Kubernetes is first with an AI-driven workflow that helps SREs identify root cause before they even open a dashboard.
Best-in-class metrics experience
Elastic 9.4 is the start of a whole new era of using Elasticsearch for metrics. Faster storage at scale supports a production-ready time-series query language and native Prometheus and PromQL. Together, these capabilities give SREs and observability teams a single platform for logs, metrics, and traces with no toolchain migration required. Notable enhancements include:
Elasticsearch TSDB performance improvements, now generally available, deliver both a significant storage requirements reduction (2.6x more efficient than Prometheus) and ingestion throughput gains. When combined with query performance improvements (30x faster than Prometheus and Mimir), it becomes easy to see how users can now ingest more data, retain data longer, and query data faster — all without proportional hardware spend. Long story short, Elasticsearch TSDB is production-ready for mission-critical observability workloads.
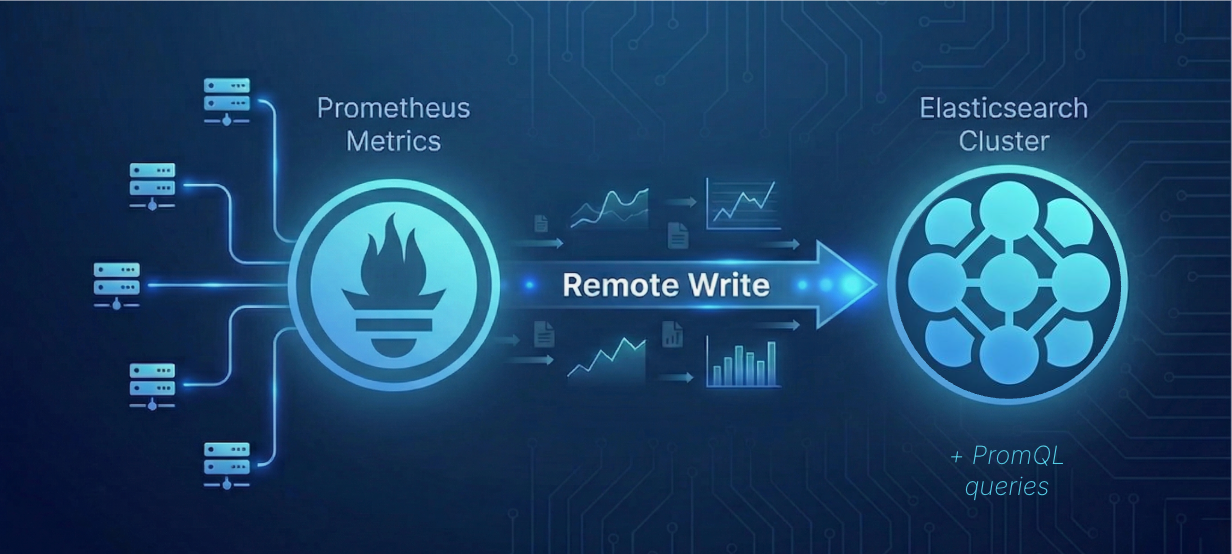
Native Prometheus and PromQL support, available now as a technical preview, enables you to ship Prometheus metrics directly to Elasticsearch and execute PromQL queries directly in Kibana. Use the patterns you already know in combination with ES|QL, a single piped query language for logs, metrics, and traces.
ES|QL time-series support, now generally available, enables you to perform time-series analysis at scale with expanded aggregation functions (e.g., rate, changes, cumulative, trange, and clamp) and full time-range filtering. It’s now in a fully supported foundation for building critical monitoring, alerting, and reporting workflows across both logs and metrics without switching languages or tools mid-workflow.

Agentic Kubernetes observability
Elastic Observability is releasing an agentic Kubernetes observability experience that automatically goes from alert to root cause:
Kubernetes based agentic investigation workflows in Kibana that trigger on an alert and return a structured root cause hypothesis with evidence and next steps before the engineer opens a single dashboard.
A new Kubernetes observability MCP app brings Kubernetes-specific skills directly into Claude, VS Code, and other MCP-compatible AI hosts with more MCP apps on the way.
A set of out-of-the-box dashboards, SLOs, and ML jobs provide additional ad-hoc analysis if needed.
Agent Skills for observability
Agent Skills are open source packages that give your AI coding agent native Elastic Observability expertise, so it can run real observability workflows within Elastic. This release covers five core workflows SREs and developers run daily:
Instrument applications with OpenTelemetry
Search logs
Manage SLOs
Assess service health
Monitor LLM applications
These tasks require familiarity with specific APIs, index patterns, and Kibana workflows. For domain knowledge that's easy to get wrong and time-consuming to repeat across every service and environment, Agent Skills package that knowledge into reusable units for consistent and accurate execution.
In addition, You can find all skill packages in the Agent Skills repo and start building today.
Managed OTLP endpoint now generally available on Elastic Cloud
And, in case you missed it, the managed OTLP endpoint is now generally available on Elastic Cloud Hosted, giving teams a simple path to send OpenTelemetry data — logs, metrics, and traces — directly into Elastic. There is no need to deploy or operate collectors for basic ingestion, reducing management overhead. This lowers the friction of adopting OpenTelemetry, speeds data onboarding, and cuts the maintenance cost of a self-managed collector layer.
Find more details in the blogs linked above and in the Elastic Observability 9.4 release notes.
Elastic Security
Elastic 9.4 advances security across five dimensions: native workflow automation that eliminates the need for a standalone SOAR tool; data management and compliance capabilities that make that automation trustworthy; purpose-built AI agent skills that bring multistep SOC intelligence to alert triage, hunting, and investigation; a new approach to entity analytics that resolves identity noise at the architecture level; and expanded endpoint forensics depth for investigation and response teams.
Native automation for the Agentic SOC
Elastic Workflows is now generally available for Enterprise customers, bringing native automation directly into Elastic Security, the agentic security operations platform that already includes unified SIEM and XDR. Security teams can now automate the defined tasks across every alert, investigation, and case — enrichment, triage, response, notification, and case creation — where their security data already lives.
Enhancing data management and compliance
Building on the Elastic Workflows news, automation is only trustworthy when the underlying data is complete and access is properly governed. Elastic 9.4 addresses both via:
Granular detection and alert permissions, now generally available, enables security teams to configure separate access controls for detection rules and alerts, ensuring junior analysts can triage and update alerts without modifying core detection rule logic.
- SIEM Readiness: Visibility Health and Data Coverage, available as a technical preview, delivers a centralized, continuously updated health view inside Elastic Security. It evaluates Coverage, Quality, Continuity, and Retention across five log categories (Endpoint, Identity, Network, Cloud, and Application/SaaS), so teams always know if their data is in the right shape to support active detections.
Agent Skills for security users
Elastic 9.4 introduces five purpose-built skills to the Elastic AI Agent, giving it deep domain expertise across the SOC workflows that matter most: alert triage, detection rule authoring, entity investigation, threat hunting, and anomaly analysis. Two platform skills, dashboard management and graph creation, are also available to the Elastic AI Agent alongside the security-specific ones. Workflow authoring ships as an experimental capability in 9.4. The Elastic AI Agent can invoke multiple skills in sequence, moving from threat hunting to detection tuning to workflow creation within a single investigation. More security skills are in development, including detection emulation, binary analysis, and alert deduplication.
Identify the entity behind the attack with entity analytics (not just the signal)
Elastic 9.4 solves identity noise at the data model level with entity analytics — not with more dashboards, but with four new generally available capabilities that give analysts one authoritative record per person with aggregated risk and context:
Precision Entity Identification unifies disparate logs into high-confidence, verified identity profiles for users, hosts, and services, governed automatically at the platform level, not by the analyst.
Entity Resolution consolidates fragmented digital accounts — Okta, Entra, Active Directory — into a single unified record per employee.
Dynamic Watchlists inject risk-score multipliers for high-value entities — executives, privileged admins, users in notice periods, or any “crown jewel” designation your team defines, making organizational context a first-class input to risk scoring.
Entity-Driven Hunting Leads shifts hunting from reactive to proactive by surfacing risk-based leads tailored to your environment's actual behavioral patterns with narrative context, not a blank page.
Deeper forensics, faster response
Elastic 9.4 extends the depth and reach of endpoint investigation from remote script execution to cross-platform memory forensics to redesigned Osquery workflows via four new generally available features:
Runscript Response Action and Script Library enables analysts to execute scripts remotely on endpoints directly from the Response Console or as an automated rule action backed by a centralized library of reusable, standardized scripts, enabling consistent remediation, custom forensic triage, and MSSP-scale operations.
Memory Dump Response Action for Linux extends cross-platform memory forensics to Linux, enabling acquisition of process memory across major operating systems from within Elastic Security without external tooling for fileless malware, memory-resident attacks, and runtime artifact extraction.
Osquery enhancements deliver a completely redesigned experience with a unified history page, enhanced result views, and advanced search and filtering, closing usability gaps and improving analyst efficiency at scale.
Jumplists Osquery Table Extension and Forensic Query Packs provide prebuilt queries targeting Browser History, Amcache, and Jumplists, giving teams ready-to-run forensic artifacts for reconstructing user activity timelines and attacker behavior.
Find more details about these features in the Elastic Security 9.4 release notes.
In case you missed it …
A lot happens at Elastic in between releases, and the space between Elastic 9.3 and Elastic 9.4 was no exception. For readers who may have missed some of the big news, here’s a short list of things to know and read:
Elastic AutoOps is now free! Elastic AutoOps brings diagnostics and operational insights directly to your environment, transforming the way you manage Elasticsearch, now with no additional cost.
Cross-project search is now available as a technical preview. Query across multiple Elastic Cloud Serverless projects simultaneously from a single interface without collapsing project-level isolation or security boundaries.
Unified API keys for Elastic Cloud Serverless and Elasticsearch are now available. Use one API key to manage both infrastructure and data queries across projects with fine-grained permission controls intact.
New ARM-based hardware profiles deliver better price-performance — up to 40% better on storage optimized workloads with Graviton4 and up to 25% better on CPU-intensive workloads with Axion.
Elastic Cloud Serverless expansion continues: With recent additions across Azure, AWS, and Google Cloud, Elastic Cloud Serverless is now available in 29 regions worldwide.
Start here now
With a raft of impactful, new, and enhanced platform features like Agent Builder and Workflows, significant advances in our time series capabilities, and so much more, Elastic 9.4 is ready to help you and your organization transform data into answers, actions, and outcomes.
So … what are you waiting for? Elastic 9.4 is now available on Elastic Cloud — the hosted Elasticsearch service that includes all of the new features in this latest release.
The release and timing of any features or functionality described in this post remain at Elastic's sole discretion. Any features or functionality not currently available may not be delivered on time or at all.
In this blog post, we may have used or referred to third party generative AI tools, which are owned and operated by their respective owners. Elastic does not have any control over the third party tools and we have no responsibility or liability for their content, operation or use, nor for any loss or damage that may arise from your use of such tools. Please exercise caution when using AI tools with personal, sensitive or confidential information. Any data you submit may be used for AI training or other purposes. There is no guarantee that information you provide will be kept secure or confidential. You should familiarize yourself with the privacy practices and terms of use of any generative AI tools prior to use.
Elastic, Elasticsearch, and associated marks are trademarks, logos or registered trademarks of Elasticsearch B.V. in the United States and other countries. All other company and product names are trademarks, logos or registered trademarks of their respective owners.
Share
- Share on Twitter
Share on Twitter
- Share on LinkedIn
Share on LinkedIn
- Share on Facebook
Share on Facebook
- Share by Email
Share by Email
- Print this page
Print