What is PromQL (Prometheus Query Language)?
What is PromQL (Prometheus Query Language)?
PromQL (Prometheus Query Language) is a functional query language designed for time series metrics and optimized for rate calculations, aggregations over time windows, and alert expressions. Elasticsearch supports native PromQL; existing Prometheus queries, Grafana dashboards, and alerting rules work in Elastic with minimal changes.
PromQL is built into Prometheus, the open source monitoring system, and it is also supported by Prometheus-compatible back ends and by dashboard tools such as Grafana. Engineers use it to build dashboards, define alert conditions, and investigate metrics during an incident.
How PromQL works
Prometheus is a time series database: It stores every metric as a stream of timestamped values and identifies each stream by a metric name and a set of labels, which are key-value pairs such as job="api" or status="500". A PromQL query selects series by name and labels and then says what to do with their values over a time range.
The simplest query is a selector: a metric name, plus optional label matchers inside braces. For example, this is a sample query that picks every http_requests_total series from the api job whose status code starts with a 5:
http_requests_total{job="api", status=~"5.."}
Label matchers support four operators: = for an exact match, != for its opposite, =~ for a regular expression match, and !~ for a regular expression that must not match.
In Kubernetes environments, metrics usually carry labels such as namespace, pod, and container, so the same matchers can narrow a query to one namespace or a single pod. For example, container_cpu_usage_seconds_total{namespace="checkout"} selects the CPU time counters of every container in the checkout namespace.
What a selector returns depends on its expression type, and the two main types are:
- Instant vector: One sample per series, all at a single point in time. The selector above returns the most recent sample of each matching series.
- Range vector: A window of samples per series. Add a duration in square brackets, and the same selector returns everything recorded during that window.
PromQL has a third expression type, the scalar: a single number with no labels, such as 0.95, or the threshold you compare a series against in an alert condition.
Durations use units such as s (seconds), m (minutes), h (hours), and d (days); in the following sample query, [5m] selects the last five minutes.
http_requests_total{job="api"}[5m]
An instant vector can be graphed or compared against a threshold. A range vector is passed to a function, which reduces each window to one value per series. The following query calculates the average per-second rate of HTTP requests for the "api" job, measured over the last 5 minutes:
rate(http_requests_total{job="api"}[5m])
PromQL is a functional language: Every expression returns a value that another expression can take as input, so queries are built by nesting one expression inside another.
Prometheus metric types
Every Prometheus metric has one of four metric types, and the type determines which functions give a meaningful result:
- Counter: A running total that only goes up or resets to zero when the process restarts, such as the number of requests served, and you query it with rate()
- Gauge: A current value that can go up or down, such as memory in use or queue length, which you read directly or average over time
- Histogram: Counts observations, such as request durations, into buckets and records their sum and count, so histogram_quantile() can estimate percentiles from it
- Summary: Calculates quantiles such as the 95th percentile inside the application, and those quantiles can't be combined across instances
Essential PromQL functions
Six functions and aggregation operators cover most dashboards and alerts.
rate()
rate() calculates the per-second average rate of increase of a counter over a time window. A counter is a metric that only increases, such as the total number of requests served, so its rate of increase is usually more useful than its raw value. rate() also corrects for counter resets, so a process restart doesn't show up as a negative spike.
rate(http_requests_total[5m])
irate()
irate() calculates the instant rate: the per-second increase between only the last two samples in the window. The Prometheus documentation recommends it for graphing volatile, fast-moving counters and rate() for alerts.
irate(http_requests_total[5m])
sum()
sum() adds values across series, which is how you aggregate across instances. Add by to keep the labels you name, or without to drop them. Take the rate() first and the sum() second so that counter resets are still corrected.
sum by (job) (rate(http_requests_total[5m]))
avg()
avg() returns the average value across series, with the same by and without modifiers. This example returns the average idle fraction across the CPU cores of each host:
avg by (instance) (rate(node_cpu_seconds_total{mode="idle"}[5m]))topk()
topk() keeps the k series with the highest values and discards the rest. It is commonly used in dashboards that show the largest consumers of a resource. This example returns the five pods using the most CPU:
topk(5, sum by (pod) (rate(container_cpu_usage_seconds_total[5m])))
histogram_quantile()
histogram_quantile() estimates a percentile from a histogram, one of the four Prometheus metric types. A classic histogram counts observations into buckets and exposes each bucket as a _bucket counter with a le ("less than or equal to") label for its upper bound.
histogram_quantile(0.95, sum by (le) (rate(http_request_duration_seconds_bucket[5m])))
The query calculates the rate of each bucket, sums the rates across instances while keeping the le label, and then estimates the 95th percentile from that distribution. The answer is interpolated inside one bucket, so its accuracy depends on the bucket boundaries.
The six functions at a glance:
| Function | What it does | Use it for |
|---|---|---|
| rate() | Per-second average increase of a counter over a window | Request and error rates, alerts |
| irate() | Per-second increase between the last two samples in a window | Graphs of fast-moving counters |
| sum() | Adds values across series | Totals per job, service, or cluster |
| avg() | Averages values across series | Typical load across instances |
| topk() | Keeps the k series with the highest values | The largest consumers of a resource |
| histogram_quantile() | Estimates a percentile from histogram buckets | Latency percentiles, such as p95 and p99 |
PromQL vs. ES|QL: When to use each
Use PromQL when you query Prometheus metrics; it is the standard language for them, and rates, aggregations, and alert conditions stay short. Use ES|QL once those metrics are in Elasticsearch, stored alongside your logs and traces, when you want to ask questions that combine metrics with the rest of your data.
PromQL works with one kind of data, numbers recorded over time, and identifies each series by its labels, such as job="api". Because it focuses on metrics, everyday tasks stay short. Calculating a rate, averaging over a time window, or writing an alert condition usually fits on a line or two. Years of use have also built up a large library of community dashboards and alert rules written in PromQL. When it needs to combine data, PromQL matches sets of metrics on the labels they share.
ES|QL — Elastic's native pipe-based query language — supports metrics, logs, and traces in a single query, with richer analytics than PromQL's metric-only data model. That means one language for every signal. A query starts from a source command (FROM for logs and traces, or TS for time series) and pipes its results through commands that filter, aggregate, and sort them. LOOKUP JOIN joins the results with a lookup index, and ENRICH adds fields from reference data.
- Use PromQL when the question is about metrics alone and the answer is a rate, a ratio, a percentile, or a threshold, and for the dashboards and alert rules you already have.
- Use ES|QL when the question crosses signals, when you need to join metrics with reference data such as service ownership, or when you want to rank and reshape results as a table.
In Elasticsearch, you don't have to choose between them. Teams migrating to Elastic can run both PromQL for existing Prometheus queries and ES|QL for new cross-signal queries. The two can also be combined. In Elasticsearch, the result of a PromQL expression can be processed by ES|QL commands in the same query:
PROMQL index=metrics-* error_rate=(sum by (service) (rate(http_requests_total{status=~"5..."}[5m])))
| LOOKUP JOIN service_registry ON service
| WHERE error_rate > 0.15
| SORT error_rate DESC
Elasticsearch also supports SQL for teams with existing SQL skills, so analysts can query the same data without learning a new language first.
Native PromQL support in Elasticsearch
Since Elasticsearch 9.5, PromQL support is generally available and built into the server, with no plugin or sidecar. It is also generally available on Elastic Cloud Serverless. It comes in two forms.
The first is a Prometheus-compatible HTTP API. Elasticsearch exposes the Prometheus query and metadata endpoints under a /_prometheus/ path, so Grafana and other Prometheus-compatible tools connect to it directly. In Grafana, you add Elasticsearch as an ordinary Prometheus data source.
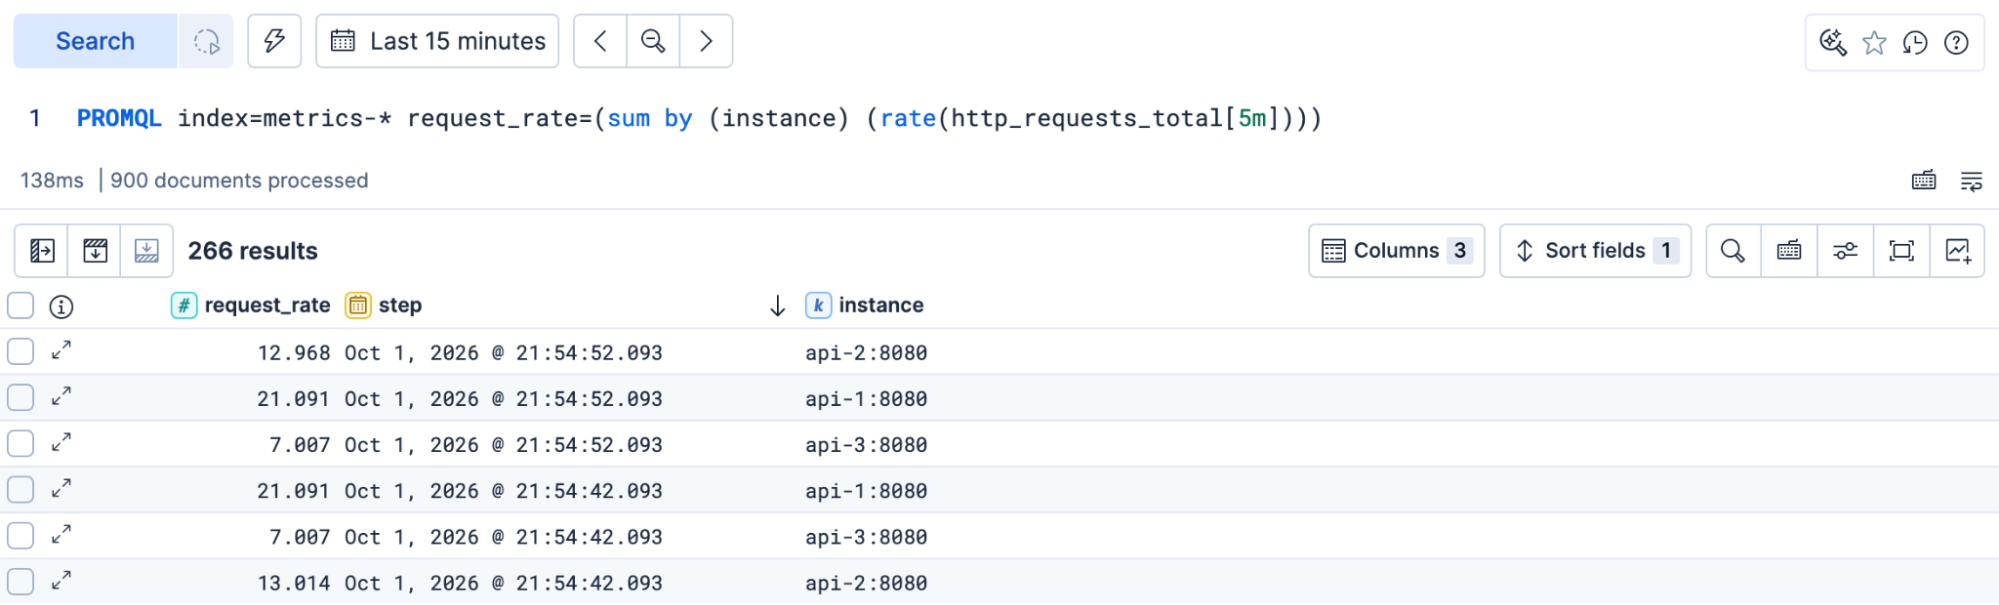
The second is the PROMQL source command in ES|QL, which runs wherever ES|QL runs in Kibana: Discover, dashboard panels, and alert rules.
PROMQL index=metrics-* request_rate=(sum by (instance) (rate(http_requests_total[5m])))
The command returns its result as a table that other ES|QL commands can process. In Kibana, the time picker sets the time range, so the query doesn't need start and end parameters.
Both forms share one engine, which parses the PromQL expression into an ES|QL query plan. PromQL queries in Elasticsearch run against Time Series Data Streams — the columnar storage format optimized for metric data. A time series data stream (TSDS) is the type of data stream built for metrics, and it stores every field in its own column. PromQL therefore works on any metrics held there, whether they arrived from Prometheus, OpenTelemetry, or the Bulk API.
One ingestion path is Prometheus Remote Write — the standard protocol for sending Prometheus metrics to a remote back end, supported natively by Elasticsearch. You add Elasticsearch as a remote_write destination, and Prometheus keeps scraping exactly as before.
Because the support is native, existing PromQL queries, dashboards, and alert rules carry over, and most PromQL queries run without rewrites. For query speed and storage efficiency, see the Elasticsearch metrics benchmarks.
Migrating from Prometheus: Keep your PromQL
A migration from Prometheus has two considerations: how metrics are ingested and how they are queried. With native PromQL support, most existing queries don't need to change.
For ingestion, the first route is Prometheus Remote Write, which takes one block of configuration:
remote_write:
  - url: "https://YOUR_ES_ENDPOINT/_prometheus/api/v1/write"
    authorization:
      type: ApiKey
      credentials: YOUR_API_KEY
Your scrape configs, service discovery, and exporters stay as they are. Prometheus continues to answer local queries while Elasticsearch receives the same samples, so both systems can run side by side during the migration. The second route is EDOT (Elastic Distribution of OpenTelemetry): The EDOT Collector can scrape the same Prometheus endpoints and send the metrics to Elastic alongside logs and traces, which suits teams that are standardizing on OpenTelemetry.
For querying, there are two options:
- Keep Grafana. Point its Prometheus data source at Elasticsearch, and the existing dashboards run their PromQL against Elastic. Alert rules that Grafana evaluates through that data source can keep running the same way.
- Move to Kibana. Paste PromQL into an ES|QL panel behind the PROMQL command, or use Elastic's Observability Migration Platform, which converts Grafana and Datadog dashboards and alert rules into Kibana equivalents and reports what needs review.
Alert rules can be migrated, too. In Kibana, an alert rule takes a PROMQL query and a WHERE condition, so the expression from a Prometheus alerting rule usually carries over as written, and the migration platform can convert Grafana alert rules for you. Recording rules keep working where they run today: If Prometheus remains your scraper, it keeps computing them and ships the results through remote write.
Before you cut over, the Elasticsearch metrics benchmarks show what to expect from query speed and storage. PromQL in Elasticsearch is part of Elastic Observability, which unifies metrics, logs, and traces in a single platform.