How we perform continuous performance testing on Enterprise Search


 Share on Twitter
Share on Twitter

 Share on LinkedIn
Share on LinkedIn

 Share on Facebook
Share on Facebook

 Share by Email
Share by Email

 Print this page
Print
Elastic Enterprise Search is a product that uses the power of Elasticsearch over datasets — so that data will always be accessible, no matter its location. Enterprise Search leverages Kibana and Elasticsearch to let you index all your data.
Enterprise Search is composed of two distinct sets of features: App Search and Workplace Search. App Search provides APIs and dashboard controls for building powerful search experiences. Workplace Search connects to third-party services to index data so that you can have a unified search experience.
Technically speaking, the Enterprise Search stack is a Ruby On Rails application that uses Elasticsearch as its database and leverages the Kibana User Interface (UI). Historically, the application had a UI, but most of it has been merged into Kibana (plugin in 7.15.)
The clever bits that drive the indexing and searching of the data and a bit of UI to glue everything together remain in the Ruby on Rails application.
When we talk about performance for Enterprise Search, it’s about our ability to make that intermediate layer as fast and lean as possible.
The Elasticsearch team has done excellent work to make sure Elasticsearch itself is fast, and the benchmarks page is the tip of the iceberg of that work. The Kibana team is also doing a great deal of work to provide fast and smooth interfaces. There’s an issue on Github that summarizes the ongoing efforts.
On our side, we’ve also been busy making sure our code is fast. While we've utilized many techniques for tuning purposes in the past, we're evolving to have a centralized tool and strategy to gain even greater insights into the solution’s performance. We expect this strategy to pay off in the long run as we pull learnings from these benchmarks to pay forward the performance gains to our customers.
Tracking performance continuously
The goal of tracking our performance every day is not to compare our solution with other similar applications on the market. It is to see how its intrinsic performance evolves.
We want to be able to :
- Alert developers when a product becomes suddenly slower after a code change
- Compare the performance of two versions of the code
- See how our products would perform with the latest version of dependency Foo
- Build a performance baseline and detect some trends (are we getting slower over time?)
A high-level view of the system
Our performance regression framework uses Jenkins, Docker, and Kibana. It operates daily and collects metrics over time.
The framework is designed around the idea that any developer can build and provide a testing scenario to run. Developers building and maintaining Enterprise Search features have all the knowledge and insights to create performance tests.
The framework performs the following tasks every day:
- List all active scenarios to run.
- For each scenario:
- Deploy our latest snapshot (or a specific revision) from scratch on a dedicated server
- Deploy other backend services when required
- Run the scenario thirteen times.
- One time for warming up JRuby’s Just-In-Time (JIT) compiler,
- twelve times in a row
- Collect the metrics for the twelve cycles
- Tear down the stack
- Aggregate all metrics and send them to our Kibana Dashboard Elasticsearch Instance
- Trigger alerts when a potential performance regression is detected
The scenario is in charge of preparing the stack if needed – by importing data or doing some setup work.
Each piece of software that is getting deployed by Jenkins is a Docker image. That includes our stack, the performance test client, and any other required backends.
Using Docker images everywhere gives us the ability to stay platform/language agnostic. For instance, if a developer wants to add a new scenario, they can write a client that performs it with any tool they want, as long as they provide a Docker image that runs it against a provided endpoint.
The Jenkins pipeline we use to orchestrate the work is pretty simple. It’s based on Jenkins’ ability to declare nested nodes. The pipeline below is a simplified/summarized version of our actual pipeline.
def benchmark = [
  [
        label: 'Crawler Wide',
        name: 'perftest.crawler.wide',
        docker: 'perftest-crawler',
        backend: 'static-websites-benchmark-wide:latest',
        alert_fields: ['crawl_duration_msec:2.2']
  ],
  [
        label: 'AppSearch',
        name: 'perftest.appsearch.readwrite',
        docker: 'app-search-benchmark',
        alert_fields: ['searching_duration_ms', 'indexing_duration_ms']
  ]
]

def alertMetrics = []
benchmark.each { bench ->
  bench.alert_fields.each { field ->
    alertMetrics.push("${bench.name}:${field}")
  }
}

pipeline {
  ...
  benchmark.each { scenario ->
    stage(scenario.label) {
      script {
        node('BACKEND_NODE') {
          def backendIp = grabWorkerIP('Controlled Backend')
          sh("docker run --name static ${scenario.backend}")

              node('STACK_NODE') {
             def stackIp = grabWorkerIP('Perf Stack')
             sh 'start-stack.sh'

             node('CLIENT_NODE') {
               sh "run-test.sh ${scenario.name} ${scenario.docker}"
               sh 'send-results.sh'
             }
             sh 'stop-stack.sh'
           }
           sh 'docker stop static'
       }
     }

     stage('Detect Changes') {
        steps {
            script {
             sh "detect-changes.sh ${alertMetrics} ${alertDays}"
            }
           }
    }
  }
}The benchmark array defines a list of scenarios, each composed of a few fields:
- label: the Jenkins stage label
- name: the Elasticsearch index that will be used to store results
- docker: the Docker image containing the test to run
- backend: the Docker image deployed as a backend
- alert_fields: The fields that will be looked at by the alerting system, with an optional threshold for the t-score when the 1.5 default is not suited.
In that example, for Crawler Wide, the backend image is a static website we use as a target during the test.
If you are curious about what the Web Crawler is, check out its documentation: Web crawler | Elastic App Search Documentation [7.15]
Jenkins nested nodes are an exquisite and straightforward way to orchestrate a deployment from scratch without synchronization headaches. For instance, the “start-stack.sh” script blocks until the deployed stack is up and running and looks healthy, and then the next node block is executed. In practice, the client node will only be running once the stack node is ready, and the stack node only once the backend node is ready.
The IPs of each node are shared through simple variables across the layers to communicate with each other. Simple yet highly effective.
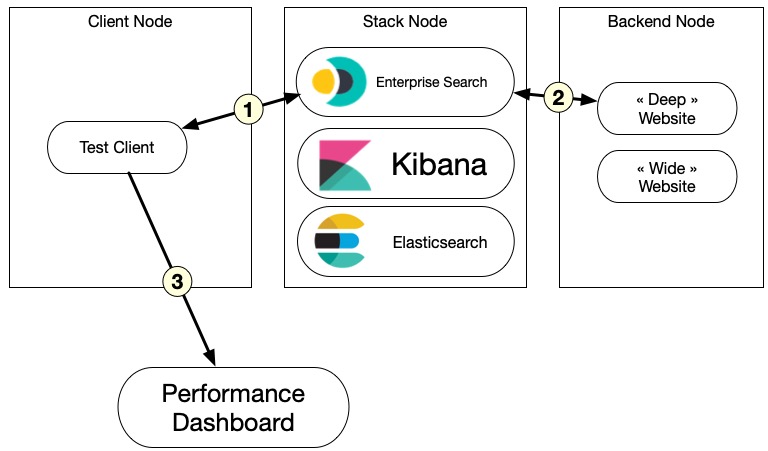
Once the test is done, results are sent to an Elasticsearch instance deployed on a dedicated cloud instance that collects the data over time. We have a Kibana instance running on top of it and some dashboards to display the results.
In the chart below, you can see the whole deployment when a performance job is running.
This setup is heavily inspired by the APM team’s work for orchestrating multiple node tests in Jenkins. See, for instance, this end-to-end test pipeline.
Measure performance accurately
There’s a myriad of options when it comes to measuring performance.
For a web application, the simplest and most effective way is to build “user journeys” scenarios, run them using HTTP clients, and collect in-app metrics. We exercise the application like a real user would do and observe how the stack performs.
Those scenarios are also called “macro-benchmarks” because they interact with the application through its interfaces, unlike a “micro-benchmark” that would pick a portion of the code and run it in total isolation.
We already have a few scenarios for Enterprise Search that can run against a stack, but developers perform them manually, often on their laptops, and their results are not comparable.
The goal of the performance regression framework is to provide a way to run those scenarios in the same environment and to collect metrics we can compare.
Technically speaking, those scenarios use HTTP clients, and in most cases, HTTP API calls are enough to exercise specific features, like crawling an external website. We can do a lot through API calls in App Search and Workplace Search.
In the example below (extract), we use the Python Enterprise Search client to run a crawl job against the Swiftype website and wait for it to finish.
import time
from elastic_enterprise_search import AppSearch

ENDPOINT = "http://localhost:3002"
MAX_TEST_TIME = 60 * 10
SLEEP_BETWEEN_CHECKS = 10
AUTH = "elastic", "changeme"
HTTP_BACKEND = "https://swiftype.com"

def benchmark(website=HTTP_BACKEND):
    client = AppSearch(ENDPOINT, http_auth=AUTH, request_timeout=120)
        engine_name = "bench-stack"
    existing = client.list_engines()

    if engine_name not in [r["name"] for r in existing["results"]]:
            client.create_engine(engine_name=engine_name, language="en")

        client.create_crawler_domain(engine_name=engine_name,
                                  body={"name": website})

    crawl_id = client.create_crawler_crawl_request(
                          engine_name=engine_name)["id"]

    start = time.time()
    while time.time() - start < MAX_TEST_TIME:
          time.sleep(SLEEP_BETWEEN_CHECKS)
      crawl = client.get_crawler_crawl_request(engine_name, crawl_id)
          status = crawl["status"]

          if status != "success":
            print(
             f"Status: {status} -- Idling for SLEEP_BETWEEN_CHECKS}s"
            )
          else:
            return

    print("Test timed out")
    raise Exception


if __name__ == "__main__":
benchmark()The script also grabs metrics (not shown in the example) and is executed inside a Docker container.
You can find our API references for 7.15 here:
- Workplace Search API Reference | Workplace Search Guide [7.15]
- API Reference | Elastic App Search Documentation [7.15]
The metrics are dumped into a JSON file artifact, that is injected into the performance dashboard Elasticsearch instance. In the example below, we collect four metrics relevant to the crawling operation and send those payload directly to Elasticsearch in the same index:
[
  {
    "crawl_duration_msec": 77002,
    "crawling_time_msec": 342,
    "avg_response_time_msec": 0.34097706879361916,
    "pages_visited": 1003,
    "website": "http://168.119.1.22:8282",
    "git_sha": "d3c67a96313836ed5dcd0f8057c2c3a4cae259e1",
    "crawl_id": "61b18a4605c57e586dfe9899",
    "cycle": 2,
    "run_id": "a25cc3a3-9fbf-4583-83d9-6c7e6e249587"
  },
  // … more data here for each cycle ...
  {
    "crawl_duration_msec": 74173,
    "crawling_time_msec": 18,
    "avg_response_time_msec": 0.01794616151545364,
    "pages_visited": 1003,
    "website": "http://168.119.1.22:8282",
    "git_sha": "d3c67a96313836ed5dcd0f8057c2c3a4cae259e1",
    "crawl_id": "61b18e3305c57e6d0601c894",
    "cycle": 13,
    "run_id": "a25cc3a3-9fbf-4583-83d9-6c7e6e249587"
  }
]Running through the HTML UI is also something we might need to do. If JavaScript is involved, it means that the client needs to run through a browser or a browser-like interface. A tool like Cypress can be used to simulate a user clicking around.
The biggest limitation we are facing when doing performance testing is to make sure we control all the backends that are called by the stack -- so we don’t test the performance of a third-party but our own stack. For Workplace Search, it means that we need to control and run ourselves any data source that might be called during the test, including any authentication.
Signal-to-noise ratio
As mentioned earlier, each scenario is executed thirteen times in a row. This repetition is done to minimize any noise that may occur and get better metrics. The sample size (thirteen) depends on the observed population distribution, the frequency of outliers, and the type of algorithm we use to detect changes.
In our case, we’re using the Student’s T-test algorithm (explained later). To tweak the size of the sample, we usually start with a value around thirty and lower it until the percentage of outliers per sample is getting too big.
Doing the same performance test several times has a cost, so reducing the number of cycles helps to reduce the costs. But we want to make sure we get a clean signal. For instance, when sending out alerts to developers, if we detect that the stack is slower, we want to avoid false positives as much as possible.
The first run is dumped, as it is used only to warm up our stack. Since we deploy our Ruby on Rails application using JRuby, we need to make sure the JIT is warmed up for the scenario code path. The twelve subsequent runs will collect a series of metrics we’re sending back to our dashboard.
The performance dashboard displays both the median of the twelve values and the breakdown, and the alerting system that will be presented a bit after uses all twelve values to detect changes.
But using (one + twelve) cycles is not enough to reduce noise. We also need to make sure we control all the infrastructure that is used to run the test.
Our Continuous Integration system is based on Jenkins, and we have the ability to pick different kinds of workers to perform some tasks. Some of them are running on Amazon Web Services (AWS) or Google Cloud Compute (GCP), and we also have some on real hardware.
Running a performance test on virtual machines (VM) deployed at AWS or GCP is problematic because you don’t guarantee that it will run under the same conditions every time. The network bandwidth can vary a lot, and the hardware might be shared with other instances. This variability makes it difficult to trust the results unless a lot of work is done in tweaking the VM instances. And that tweaking will need a constant rework, making it hard to get a stable environment. That’s why it’s better to use real hardware we fully control.
And even if the servers we use all have the same specifications, it’s best to use sticky deployments. That is, we deploy our stack on the exact same server every time we run our tests to make sure there’s no difference in hardware and system-level software between two runs.
But even with all these precautions, sometimes detected changes are due to execution environment changes, so we need to be careful with our interpretation.
What do we measure?
Finding good metrics to measure during a performance test is hard. The apparent metrics for a web application are to measure how long it takes for the server to build a response, but while it’s good to have, it doesn’t provide many insights.
Another approach is to isolate what will take time to run in the application, and that does not depend on a third party we don’t control.
In App Search, the Web Crawler is a straightforward use case for performance metrics because we can measure how long it takes to convert web pages content into indexed content in Elasticsearch.
The time it takes to fetch a web page body is not that important, but everything else that happens once the Web Crawler collects the page content is worth measuring.
How efficient is it to follow the graph of pages? Is it becoming slower over time? Do we have website structures that are slower to process than others?
To try to answer those questions, we have generated two static websites that provide different structures:
- “Deep”: a root page linked to two pages. Then each page links to two new pages until we have 1000 pages. We also add ten random interlinks on each page.
- “Wide”: a root page linked to 1000 pages. We also add ten random interlinks on each page.
Those websites are deployed in the backend node and served statically from an Nginx inside a Docker container since we don’t want to depend on a third-party backend during a performance test and always need to serve the same content.
In the graph below, we display the total duration of the crawling for the “Deep” website for all twelve runs (2 to 13, since the first one is dropped)
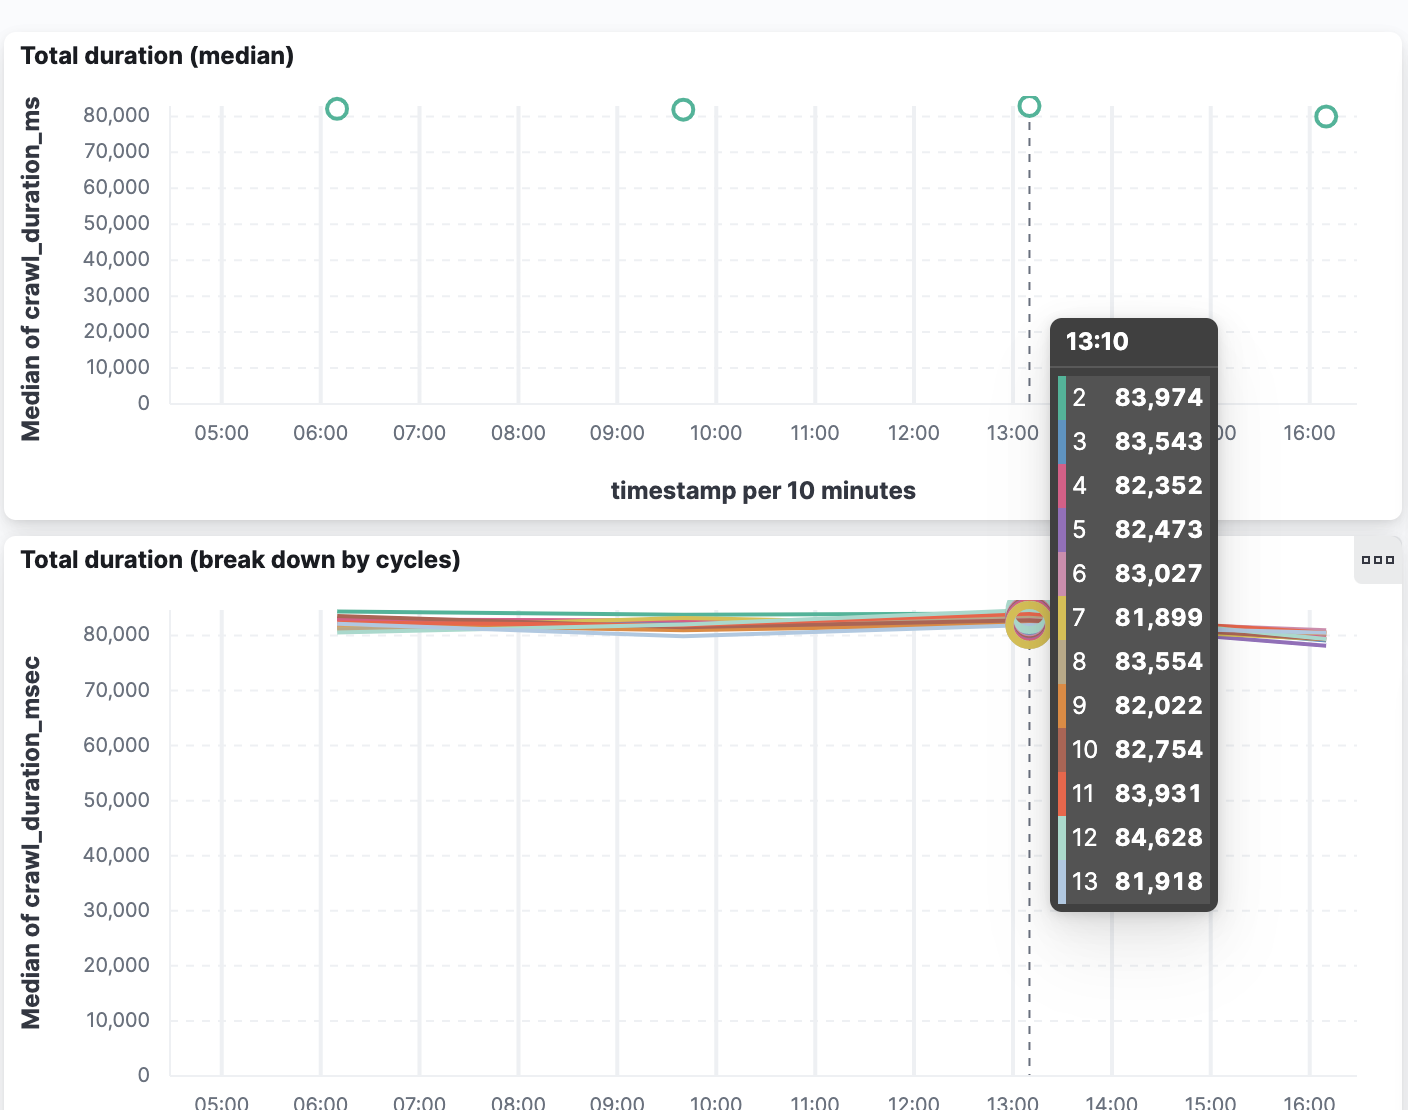
Each run takes around 80 seconds, and that duration has been very stable, meaning that we have a baseline we can use to detect a performance regression (or progression!)
How do we detect regression?
To detect a performance regression when we run our scenario, we need to make sure we take into account these facts:
- we may have a few outliers
- we may have noise, despite all the precautions
- we don’t know anything about the scale
For instance, the crawler test took between 81 and 85 seconds in the previous run, but no automated algorithm can tell if it’s fast or slow or if the 4 seconds variation is “normal.” The goal of the detection process is just to flag that something has changed and let a human interpret the results.
This empirical decision can be made by comparing a run with previous runs and looking at the history. Did the crawler take 80 seconds on average, like yesterday and the day before? Was it slower for one day and then back to 80 seconds? Did it get up to 90 seconds, and that change seems permanent?
To detect a change between series that are supposed to be similar, we can use the Student’s T-test algorithm. There are other algorithms that can be used to compare a series of metrics, but the Student T-test is pretty reliable. It’s a statistical method of testing hypotheses about the mean of a small sample drawn from a normally distributed population when the population standard deviation is unknown (definition taken from https://www.britannica.com/science/Students-t-test). T-scores are computed between series to determine how different they are. The lower the value is, the closer the two series are.
Elasticsearch can return T-test scores using its aggregations API, see T-test aggregation | Elasticsearch Guide [7.15]
The T-score value is a number that tends to zero when the two series are similar. For our performance tests, we need to try and test it against a series of stable runs that are considered to be our baseline to determine what value to use as a detection threshold. For the Crawler test case, 2.2 is a suitable threshold.
If the T-score is higher, the two series are considered different, and a change is detected.
But we don’t want to alert developers right away when we detect that change. It could be a transient value, and the performances could be back to normal the day after. We want to make sure that what we’ve detected sticks and is a real trend.
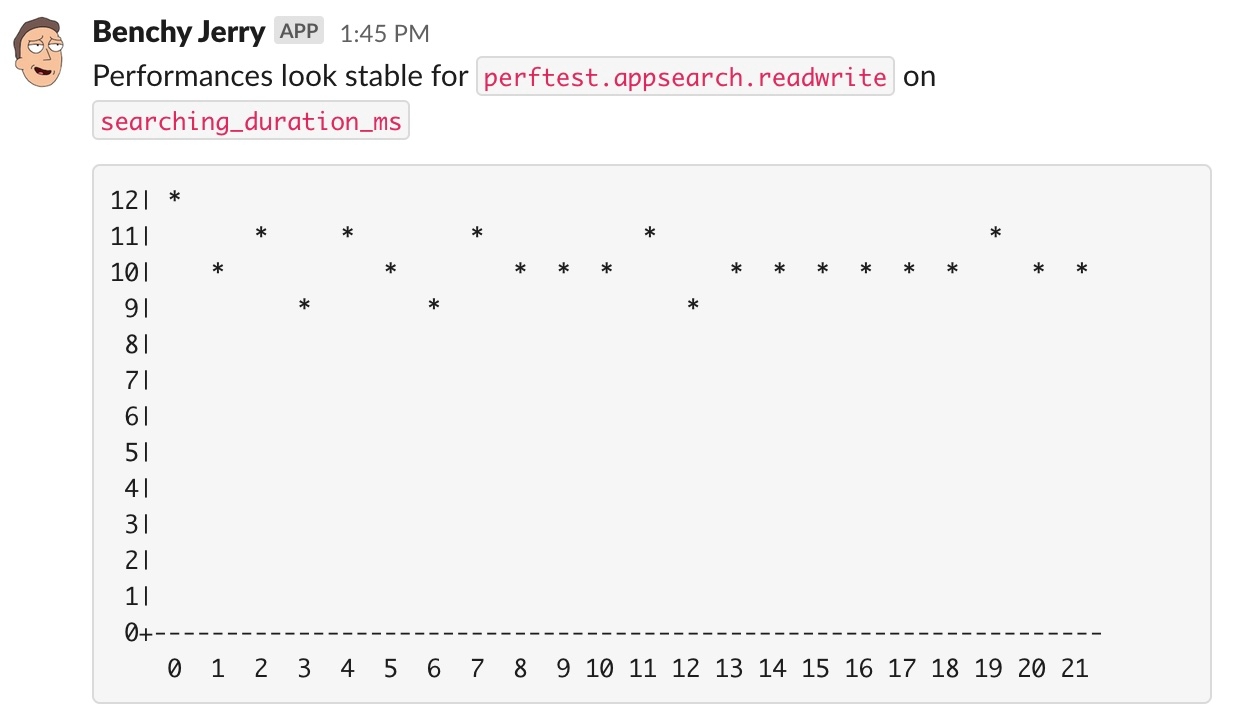
This is why our alerting system performs this test in a sliding window of several days. We will send an alert to Slack only if the change sticks for a few days.
In the screenshot below, you can see a Slack alert displaying the last few days for some metrics we track, and the framework made the decision that things were stable, even if some T-score went over the threshold here and there. It did not stick.
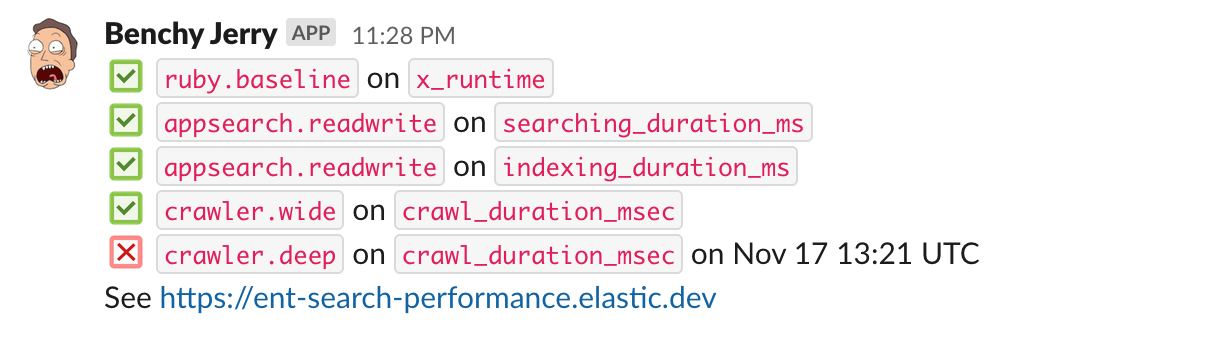
In the next screenshot, the tool gives a daily summary, and points one scenario that had a performance regression detected
Make it actionable
Building a performance framework like this is pretty useless if it’s just feeding a dashboard no one ever looks at. The Slack alerts are one way to catch the developer’s attention when something’s odd, but we need to go further.
We need to provide a plan of action and make sure it’s easy to follow. We need to make sure the developers don’t waste time chasing the problem, or worse, pursuing a false positive.
Before jumping on a performance regression, we need to ask ourselves:
- Can we trust that the execution environment is the same?
- Did we change a dependency or something that could explain the change?
- Is the scenario doing what we think it's doing?
If there’s still a suspicion, the next phase is to detect the change that triggered the problem.
For this, we need:
- The list of all commits done in the codebase since the previous run, so we can bisect
- A way to study the code execution when the script runs, all the way down to function calls
Bisecting changesets means running the performance test revision by revision until we detect which revision is responsible. This is tedious work that needs and can be automated.
Studying code execution, on the other hand, is where we need developers’ insights. And we have a fantastic tool to do it. The Application Performance Monitoring (APM) with Elasticsearch allows us to trace the execution times down to the Ruby functions!
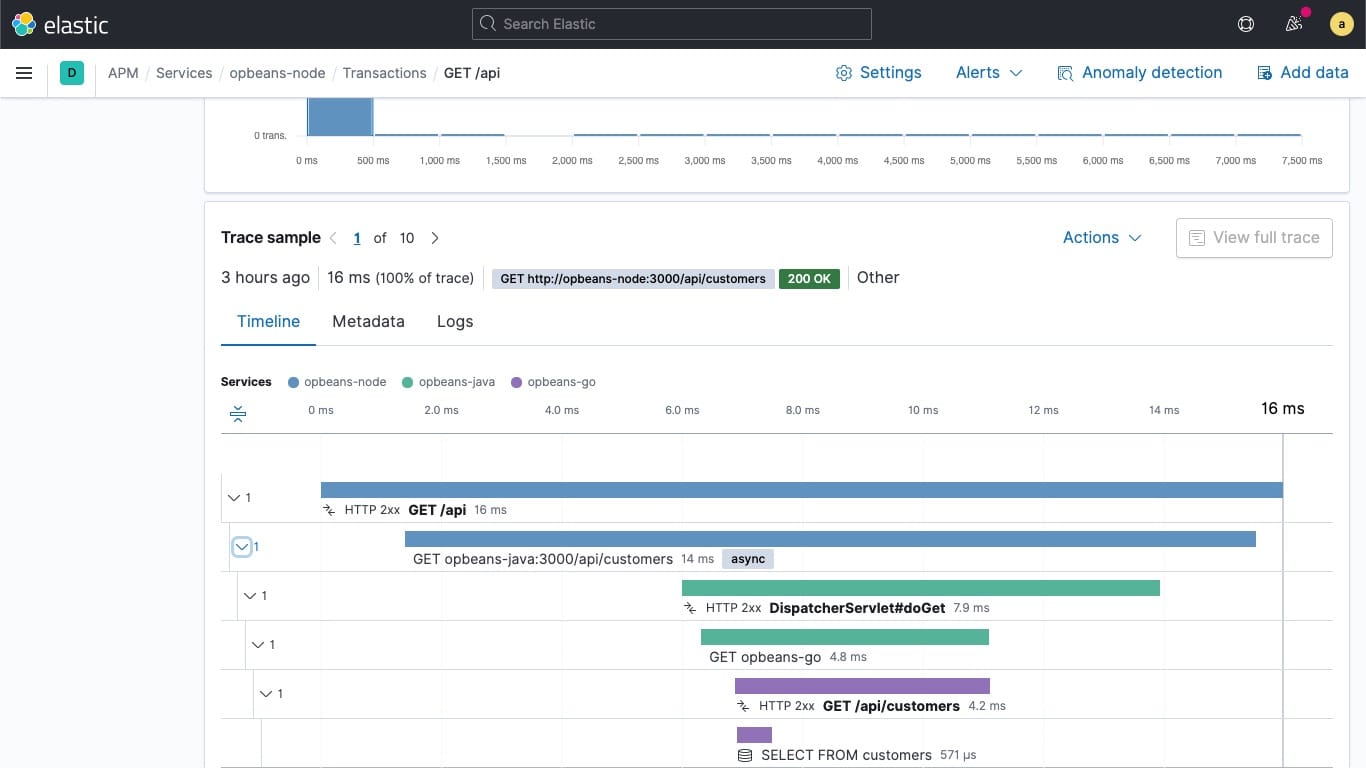
The tracing, however, has a cost. We need to run the stack with a special APM agent that adds some execution overhead. But we can perform an APM-enabled run of the performance test only when we need to investigate a specific revision and send the collected data to the same Elasticsearch instance we use for the performance dashboard.
To summarize, we can make the framework actionable by:
- Automatically bisecting changes when a regression is detected
- Run a new performance test with APM enabled
- Alert developers with a link to the APM dashboard for investigation
What’s next
The project is not finished yet, but most of the base features are already working and producing metrics we can watch. The alerting system is up and running, sending Slack alerts. But everything needs to mature for a few weeks before we can rely on the tool.
In terms of implementation, the following steps are being added :
- Automatic bisection, to speed up the detection of the faulty change
- APM integration for deep-dive analysis
- A diff view so we can compare two runs side-by-side.
And once this is done, there are other cool features we can add to the top of this tool, like the ability for a developer to execute a benchmark against a Pull Request (PR). For this feature, we’re planning to add a “Benchmark” label in Github to let the system know that the next time it runs, it should pick that PR and compare its performances with the main branch of the project.
Thanks to Jenkins, Elasticsearch, Kibana, and APM, we built a performance regression framework pretty quickly for Enterprise Search.
And thanks a lot to Serena Chou, Maryna Cherniavska, Carlos Delgado, Artem Shelkovnikov, Quin Hoxie, and Victor Martinez Rubio for helping me proofread, correct and make this post better.
Share
- Share on Twitter
Share on Twitter
- Share on LinkedIn
Share on LinkedIn
- Share on Facebook
Share on Facebook
- Share by Email
Share by Email
- Print this page
Print