Observability updates in Elastic Stack 7.4.0
We are excited to share that the 7.4 release of the Elastic Stack delivers on a number of important initiatives around observability — the shift to combine multiple sources of data with the goal of achieving unified visibility and faster issue resolution in increasingly complex application delivery environments.
Logs, metrics, and APM are important sources of data from applications and infrastructure, and are often referred to as three “pillars of observability.” The Elastic Stack combines these data sources in a single datastore with consistent semantics around data analytics, anomaly detection, and alerting, and a simple licensing model that does not charge per data ingest, per host, or per agent. New features in 7.4 add depth in each pillar of observability, and extend the turnkey experience of this solution to more enterprise environments.
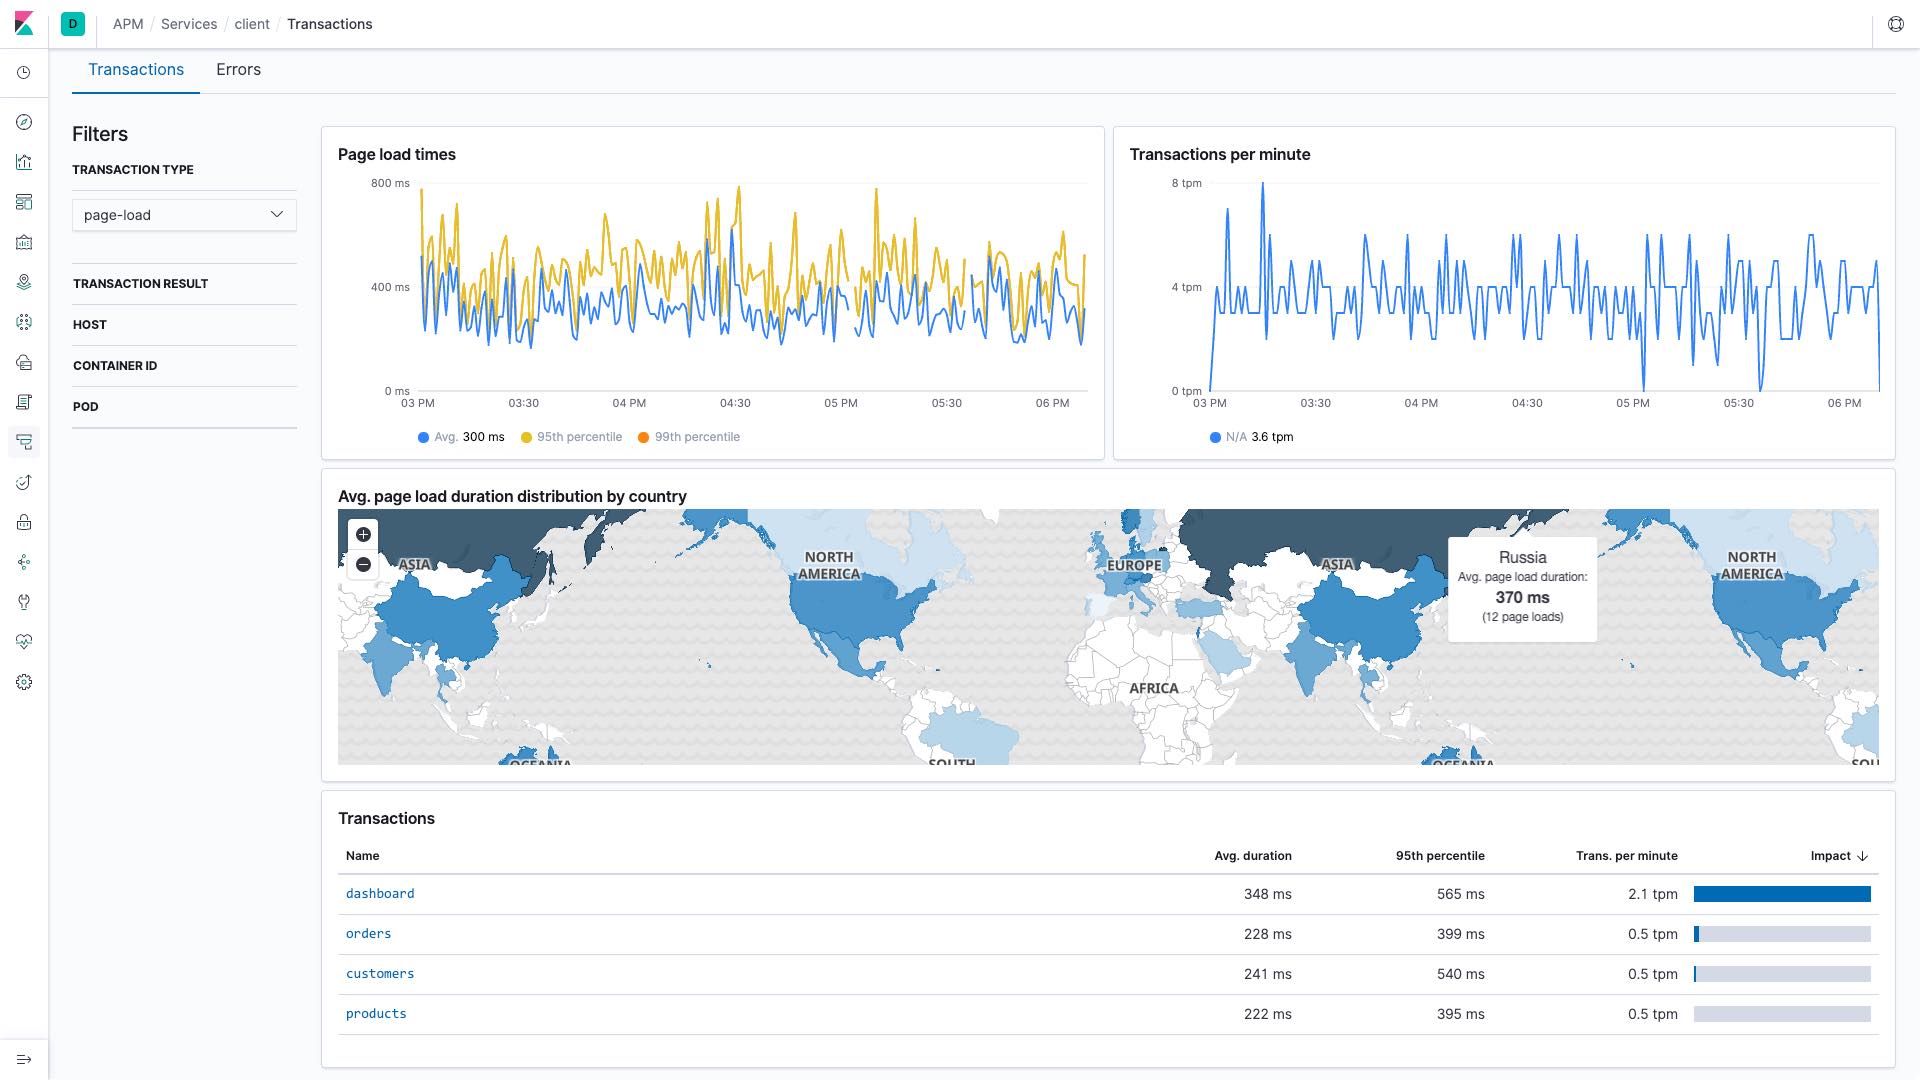
Elastic APM doubles down on auto-instrumentation and geolocation
One of the biggest challenges organizations face when adopting application performance monitoring (APM) technologies is instrumenting existing applications to track the flows of distributed transactions and their timing. To help organizations move quickly, APM agents must be tailored to do this instrumentation automatically for common programming languages and frameworks, so that developers do not need to invest in a lot of manual code instrumentation. The Elastic APM 7.4 release expands on our broad automatic instrumentation capabilities by adding support for Full Framework in the Elastic APM .NET Agent and Angular.js support in the Elastic APM RUM Agent. In addition to automatic instrumentation, the 7.4 release brings more focus to identifying potential problems by geographic location and enabling faster filtering workflows on top of trace data. Elasticsearch is particularly well suited to handle high-cardinality queries at scale, and the Elastic APM 7.4 release exposes additional UI controls for making these workflows even more efficient.
Elastic metrics and log data integrations widen scope
Similarly to Elastic APM, the adoption of centralized log and metric analytics is greatly aided by turnkey data integrations with common infrastructure and service components. The Elastic Stack 7.4 release advances datastore monitoring by widening the scope and adding advanced dashboards for a score of important datastores, including OracleDB, Postgres, and Prometheus. It also adds native support for collecting metrics using a popular custom metrics format called statsd, and advances existing capabilities around Kubernetes monitoring with new scheduler metrics support. Finally, this release adds log analysis for IBM MQ, a critical messaging platform in many enterprise applications.
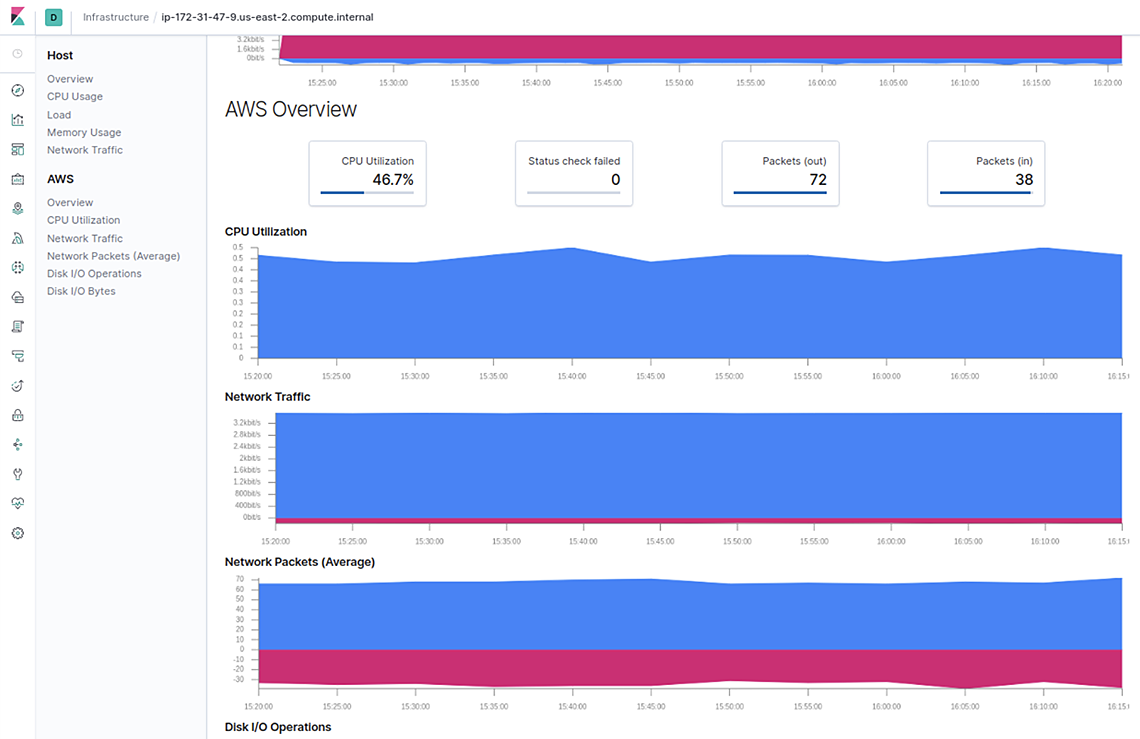
Cloud monitoring with Elastic gains support for more AWS services
The Elastic Stack is increasingly used for monitoring hybrid- and multi-cloud environments. As a result, our users seek turnkey data integrations with common public cloud infrastructure and services. Many of these organizations deploy the Elastic Stack in Elastic Cloud close to applications and services that generate the telemetry. The Elastic Stack 7.4 release adds support for several key services in Amazon Web Services (AWS) such as Elastic Load Balancer (ELB), Elastic Block Storage (EBS), and Simple Storage Service (S3). The Infrastructure and Logs apps in Kibana provide curated user interfaces to analyze and navigate these datasets, which further enables faster troubleshooting and problem resolution workflows. This visibility helps organizations that primarily rely on AWS for running their applications, as well as those that are in the process of transitioning workloads to the public cloud.