Faster resolution of system issues
Energisa has significantly reduced the time to identify, prioritize, and resolve system issues. Situations are detected in minutes rather than hours.
Improved accessibility of data to employees that offer customers essential services and information when they need it
Energisa developers spent a significant amount of time searching through complex data. With Elastic, they’re automatically alerted to genuine issues rather than false alarms and can spend more time adding greater value to the business.
Longer-term roadmap for infrastructure monitoring and maintenance
Energisa lacked a future-proofed platform and strategy for system monitoring and resolution. It now has a more stable and profitable technology roadmap.
Brazilian energy giant monitors business-critical systems with Elastic
Founded more than a century ago, the Energisa Group is the largest private company in Brazil’s electricity sector with more than 8 million customers. With a focus on sustainability, the company’s mission is to generate and deliver energy in a way that benefits the quality of life of its customers, while supporting business and economic growth.
But ongoing expansion brings challenges. As the company grows, more technology systems are added that must be accessible to employees and offer customers essential services and information when they need it. Keeping these systems continuously available by logging and resolving technical issues as fast as possible is paramount.
Until recently, Energisa’s analysts lacked the ability to easily observe the performance of these business-critical systems. Service and application logs were generated in text format making them difficult to find in a decentralized system. The sheer amount of information and the size of files, which were stored in a traditional relational database, added to the challenge.
Gaining utility from the data
Analysts spent a large amount of time sifting through databases or text files, often resorting to complex spreadsheets to observe system performance. Romulo Maini Pinto, Software Engineering Team Leader at Energisa, says, “Our previous process made it challenging to answer simple questions and made it difficult to detect the root cause of the issue or even to take preventive action.”
To address these challenges, Maini and his team researched the market seeking an observability solution that met Energisa’s needs. “We wanted to centralize application and infrastructure logs, enabling root cause analysis and early intervention to maintain the availability of our systems,” says Maini . “We also wanted to help analysts save time by providing timely alerts and presenting information in a way that made it easy to understand and act upon.”
Working alongside Energisa System Analysts, Altamir Dias Cassiano and Guilherme da Silva Lima, Maini selected the Elastic Observability solution.
We chose Elastic because of the active user community and the continuous evolution of the solution to meet our customers’ needs. We were also attracted by the outstanding 24/7 technical support, the clear data visualizations, and the overall ease of use.
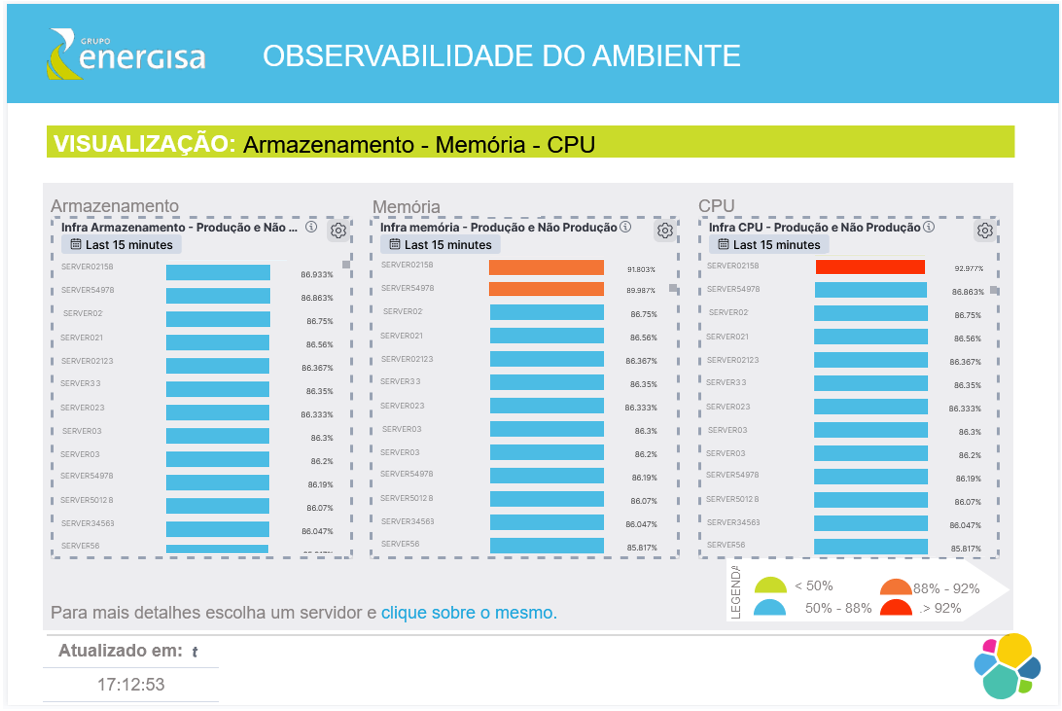
Energisa now uses Elastic to manage more than 1,400 servers, monitoring metrics related to infrastructure, CPU, memory, and more.
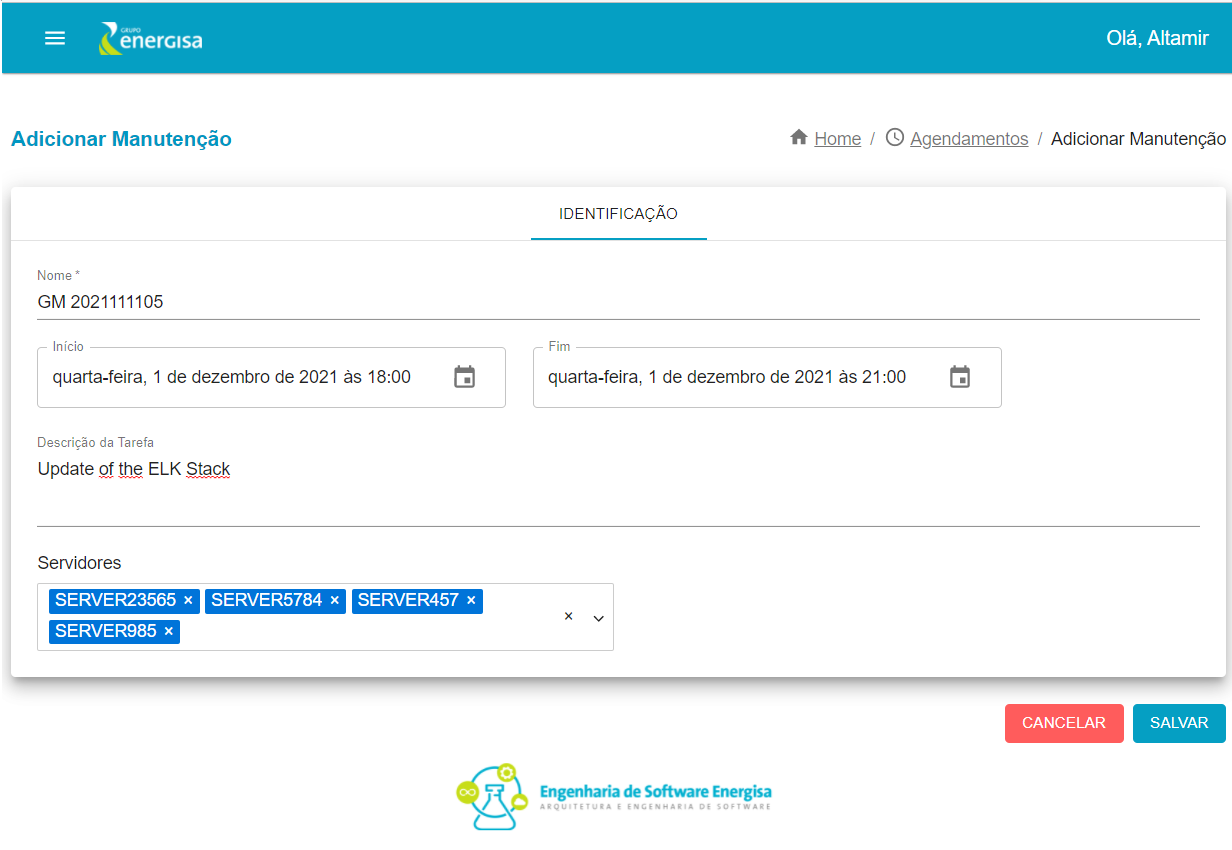
The analyst team has also taken advantage of Elastic APIs to deliver server maintenance, developing an application to avoid false alarms when servers are taken offline for maintenance or are changing status during regular usage.
Supporting the Energisa business and its customers
Thanks to the deployment, Energisa has dramatically improved the observation of its server environment.
With Elasticsearch Watcher, the analyst team is alerted by the company's communication tool well in advance so that they can intervene and resolve issues before they become time-consuming problems. And because the logs are so accurate, analysts and engineers can see exactly what needs to be done and avoid the false alarms generated by less accurate solutions.
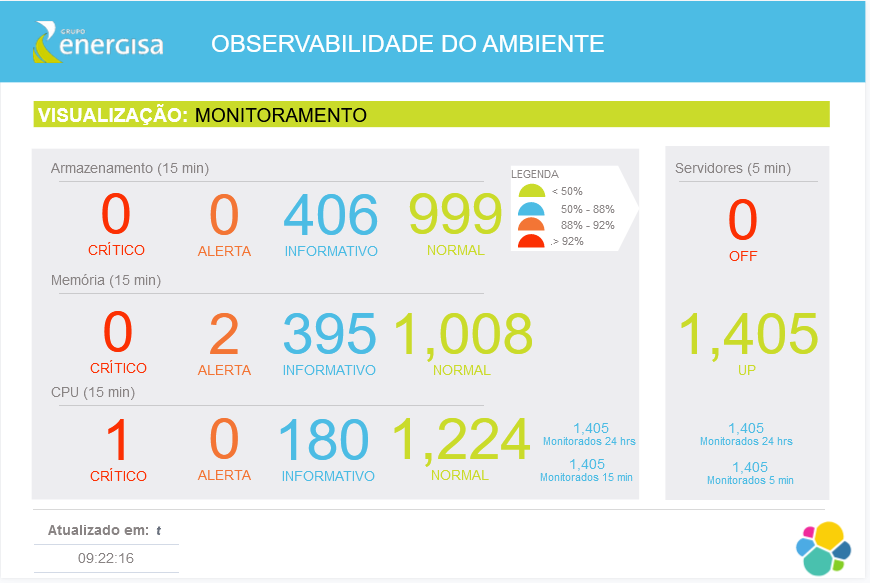
Issue resolution is also supported by Canvas, a data visualization tool built into Kibana. This means that the Energisa infrastructure team can visualize the health of the entire environment from a single screen, prioritize the issues that need urgent resolution, and ensure that its applications continue to support customers and the overall business.
Saving time and improving processes
Energisa has also seen significant improvements in application monitoring. Development teams can assess the health of their applications and the environment where the application is hosted. They can also quickly find specific logs that support the correction of bugs and resolution of incidents.
In one instance, the team was able to intervene and resolve an issue in 10 minutes. Before Elastic, it would have taken at least an hour and might even have been impossible.
As well as helping to resolve issues, Elastic simplifies processes that relate to the running of the business and responsibilities of the analytics team. "Kibana with space separation grants governance over logs and metrics, allowing analysts to access data only related to their business area." says Maini.
Looking to the future, Maini plans to introduce machine learning software that supports more advanced predictive analysis and looks forward to working with Elastic as its Observability solution continues to evolve.