


Monitoring Elastic Cloud deployment logs and metrics
The ability to monitor your Elastic Cloud deployment is critical for helping ensure its health, performance, and security. Our Elastic Observability solution provides unified visibility across your entire ecosystem — including your Elastic Cloud deployments.
Elastic Observability allows you to bring your logs, metrics, and APM traces together at scale in a single stack so you can monitor and react to events happening anywhere in your environment. Search for any specific log value with lightning speed, retain logs for as long as you require using index lifecycle management policies, and even set up machine learning (ML) jobs to detect any anomalies.
To monitor your cloud deployment, Elastic Observability can help you identify and alert on system health issues as well as troubleshoot and resolve slow search queries. You can even use it to audit access to your cloud deployment as part of your information security compliance program. Best of all, you can take immediate advantage of this capability with your current subscription.
In this blog we’ll talk about a couple of use cases, including how to audit access and index slow logs. We’ll talk about the benefits of these features and how they work. Then we’ll walk through the configuration of the features to help you get started.
Easy as a few clicks
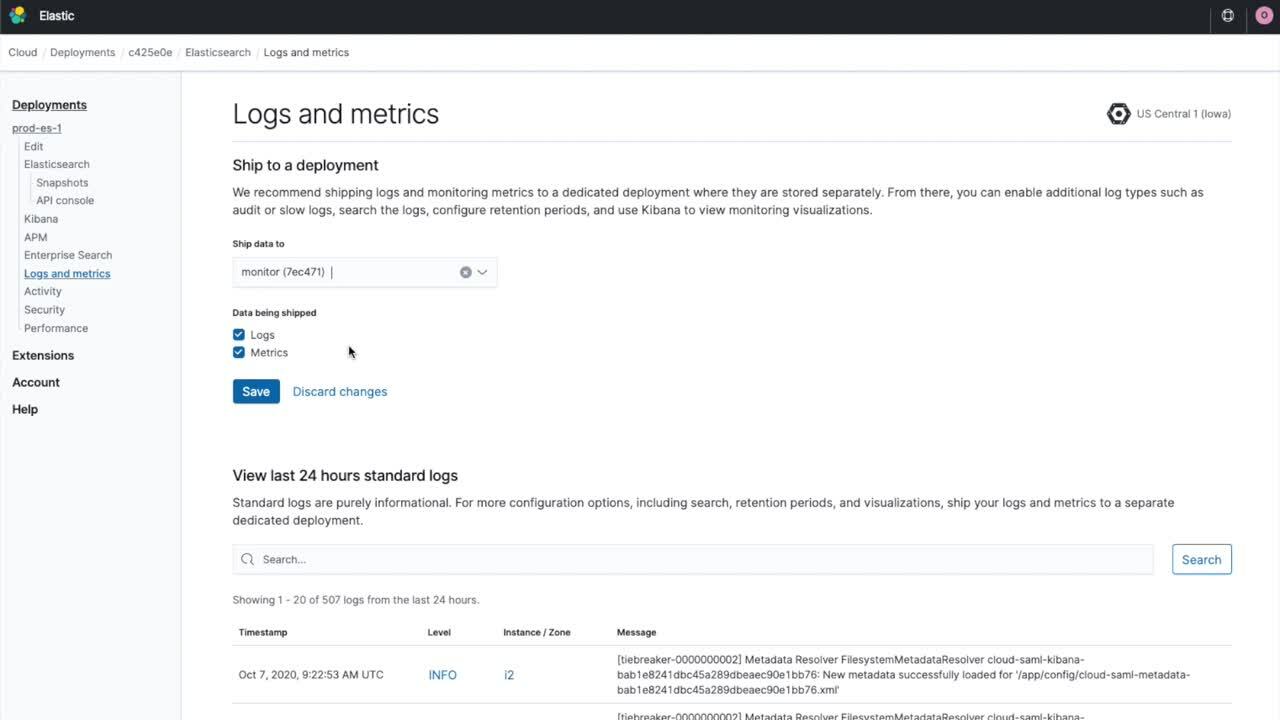
To enable a cloud deployment to send its logs and metrics to another cloud deployment, go to the deployment’s logs and metrics page, click the Enable button, and select the available deployment where you want to send your logs and metrics. You can opt to ship just deployment logs, just metrics, or both to any deployment in the region with the same major version.
The feature is also available for configuration through Elastic Cloud APIs. When you create or update a deployment, you’ll be able to specify an observability object with the appropriate setting.
By default, the following logs will be sent when you enable this functionality:
- Elasticsearch logs
- Kibana server log
- APM logs
- Enterprise search logs
You can also change log levels via the Elasticsearch APIs if you need access to more granular logging levels such as debug or trace.
The ability to ship logs and metrics is available in all Elastic Cloud service subscription tiers and to 6.x and 7.x Elastic Stack versions.
Auditing access to a deployment
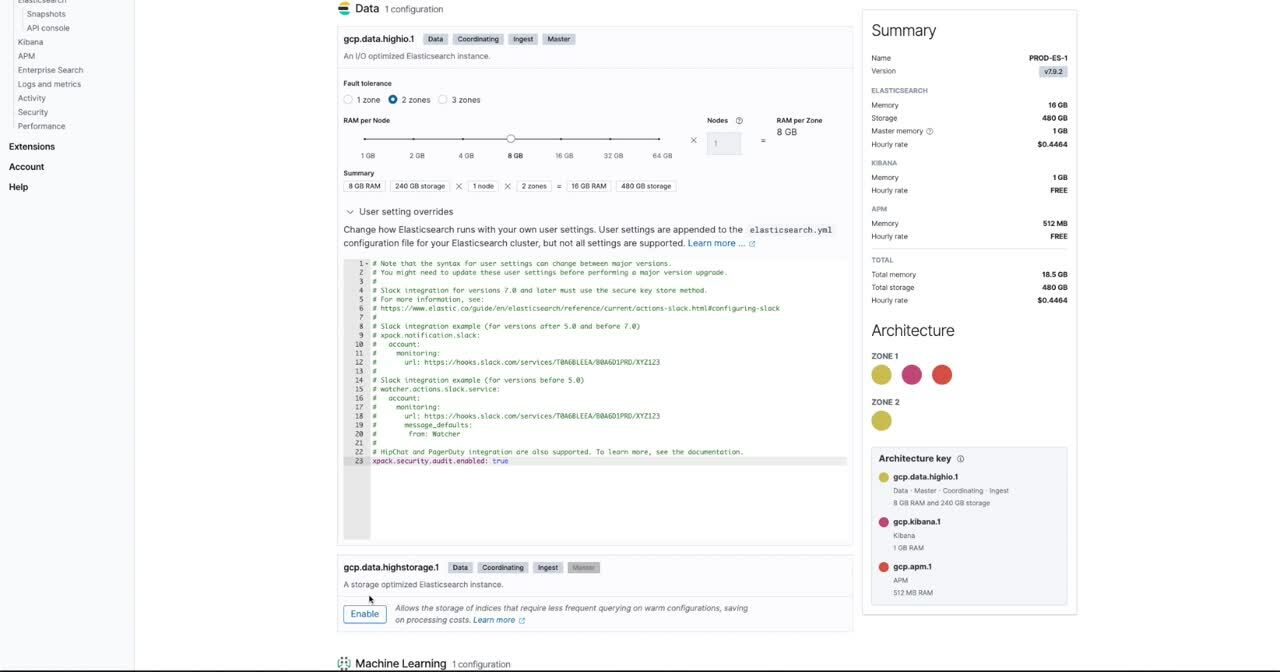
Once you opt to ship a deployment’s logs, you will be able to configure the stack’s audit logging capabilities by adding the appropriate audit settings in the elasticsearch.yml and kibana.yml files through the edit deployment page.
With deployment auditing enabled, you’ll be able to track all index-related activity from documents being updated, created, and deleted to users logging into Kibana or interacting with the Elasticsearch APIs.
Auditing access of your cloud deployment is a good security practice, but it can also be helpful when troubleshooting performance. In the event of a performance issue, you can determine who accessed the system and what they may have changed. If a change is contributing to or causing the performance issue, it can be rolled back after it’s identified.
In order to enable Elasticsearch and Kibana (in 7.6+ deployments) audit logging, you’ll need to add this property:
xpack.security.audit.enabled: true
However, in order to get some further information logged, such as the request body and successful authentication requests, you can also add these properties:
xpack.security.audit.logfile.events.include: access_denied, access_granted, authentication_failed, authentication_success
xpack.security.audit.logfile.events.emit_request_body: true
Finally, two additional important settings to keep in mind are the filter policy settings:
xpack.security.audit.logfile.events.ignore_filters.policy1.indices: ["
Index-name1","index-name2”,"..."]
xpack.security.audit.logfile.events.ignore_filters.ignoreUsersPolicy.users:["user1","user2","..."]
Filter policy settings allow you to configure Elasticsearch to ignore and not log data on specific indices like the system indices, for example, or specific users like Filebeat ingest users.
Investigate slow search queries
Elasticsearch slow logs can also be examined in the ingested stack logs. Configuring slow logs can be done dynamically by directly interacting with your deployment’s Elasticsearch API.
Enabling index slow logs would allow you to detect and investigate performance issues — and queries taking longer than usual — ensuring you can identify performance bottlenecks and scale your deployment appropriately.
You can also use slow logs to optimize existing queries and gain better visibility into your application response times and operations.
How it works
In order to ship the deployments logs, we are actually using Filebeat behind the scenes. So when enabling this feature for your deployment, Filebeat will run and start collecting your deployment logs and sending them to the configured deployment.
The logs will be ingested automatically into an index named “elastic-cloud-logs-<beatversion>-<date>” in the target monitoring deployment.
It’s recommended that you create an index pattern for the elastic-cloud-logs index, so you can view and query log data in the Kibana Discover application.
Some of the interesting fields you’ll be able to aggregate and filter by are the message field, which contains the log message data in an ECS format, or the service.id and service.name fields, which contain the deployment’s ID and name as they are in Elastic Cloud, respectively.
The service.node.name field will note the name of the instance logging the message, and service.type will note whether that instance was an Elasticsearch, Kibana, APM, or Enterprise search instance.
By default, stack logs and monitoring data are retained indefinitely when sent to a dedicated monitoring deployment. If you want to adjust data retention for logs, we recommend adjusting the default index lifecycle management policy created for the index, such as the amount of time you want logs to be retained for, rolled over, etc.
In order to control and set metrics retention, you can use the xpack.monitoring.history.duration setting in elasticsearch.yml