Logstash 6.2.0 Released
Logstash 6.2.0 has been released, and it is bringing lots of new goodies. Please refer to the release notes for a complete list. You can download Logstash 6.2.0 from our downloads page. If you are upgrading from Logstash 5.x, please take a minute to read about breaking changes. Read on for more details on some big changes for Logstash 6.2.0.
Logstash Keystore
To get started, set the password that you want to use to protect the keystore using the 'LOGSTASH_KEYSTORE_PASS' environment variable.
export LOGSTASH_KEYSTORE_PASS=myReallyStrongPasswordThatNoOneWillEverGuessWe highly recommend that you set the 'LOGSTASH_KEYSTORE_PASS' environment variable. If you don't set the environment variable, we’ll log a warning to notify you that your keystore is unprotected.
First let’s create the keystore:
bin/logstash-keystore create
Now that we have the keystore, we can add a secret into the store. In this case we’ll store a password for the Elasticsearch output configuration:
bin/logstash-keystore add es_pswdWhen you run the command above, you are prompted to type the secret value to be saved in the keystore. Now you can reference '${es_pswd}' in your Logstash configuration.
Let’s try it. Open your Logstash configuration and modify it as shown below. Notice how we’re using the saved secret as the password value.
output{
  elasticsearch {
    hosts => ["http://127.0.0.1:9200"]
    user => "elastic"
    password => "${es_pswd}"
  }
}
When you restart Logstash, it replaces ‘${es_pswd}’ with the secret value you set in the keystore. You can use the keystore for more than just passwords. Use it to store API keys, tokens, and other sensitive strings as needed.
Use the following command to list the secrets:
bin/logstash-keystore list
Note: For security, the actual secret values are never shown.
You can also use these secrets in your ‘logstash.yml’ file. For example:
xpack.management.elasticsearch.password: ${es_pswd}
Does the dollar sign curly bracket syntax looks familiar? It is the same syntax used to look up environment variables. If you are currently using environment variables to help protect passwords, upgrading to the keystore should be easy. You can use keystore and environment variables at the same time. Logstash prefers a keystore entry over an environment variable.
To avoid any gotchas related to keystore location and password availability when Logstash is installed as a service, please refer to the official documentation for additional information.
JDBC Static Filter
When we released Logstash 5.3.0 we hinted that a static JDBC filter was coming. We are glad to announce that the JDBC Static filter is here in 6.2.0! This filter makes a different set of tradeoffs from its sibling, the JDBC Streaming filter, instead focusing on lightning fast lookup times for cacheable datasets.
The streaming filter performs a cached query to a remote database for event flowing through Logstash. Some lookups may be fast, and others may be slow, depending on what’s in the LRU cache.
With the JDBC static filter, the data is loaded into a local in-memory Java DB instance. You design the local tables, columns, data-types and indexes, and control how the data is loaded into those fields. A scheduler can periodically reload the remote data. For more information, read the official documentation.
Persistent Queue Improvements
Logstash 6.2 brings some significant improvements to the Persistent Queue (PQ). This release better aligns the behavior between the PQ and the Memory Queue (MQ).
The PQ implementation and the Memory Queue (MQ) implementation used different approaches to deque data up to now. The PQ favored minimizing the wait time for data to be available to form a batch while the MQ favored maximizing the batch sizes. In the case where outputs were faster than inputs, batch sizes would be much smaller on the PQ than on the MQ, leading to potential performance degradation when the PQ was used.
This behavior was particularly problematic for the Elasticsearch output, because larger batches are much more efficient for Elasticsearch to write. With Logstash 6.2 we unified the behavior between the two queue types, favoring larger batch sizes with the PQ to bring it to parity with the MQ.
In addition to unifying behaviours, we changed some of the the default configuration settings. These changes are listed below.
- `pipeline.batch.delay` has been changed from 5 to 50 milliseconds. Increasing the pipeline.batch.delay to favor larger batches. Generally this setting should not need to be tuned.
- `queue.page_capacity` has been changed from `250mb` to `64mb`. Having a smaller page size mitigates a known performance issue related to larger page sizes.
- JVM option `-XX:+DisableExplicitGC` has been removed. This was identified as having a negative effect on the PQ DirectByteBuffer implementation.
For additional information see: https://github.com/elastic/logstash/pull/8702, https://github.com/elastic/logstash/pull/8776, https://github.com/elastic/logstash/pull/8797
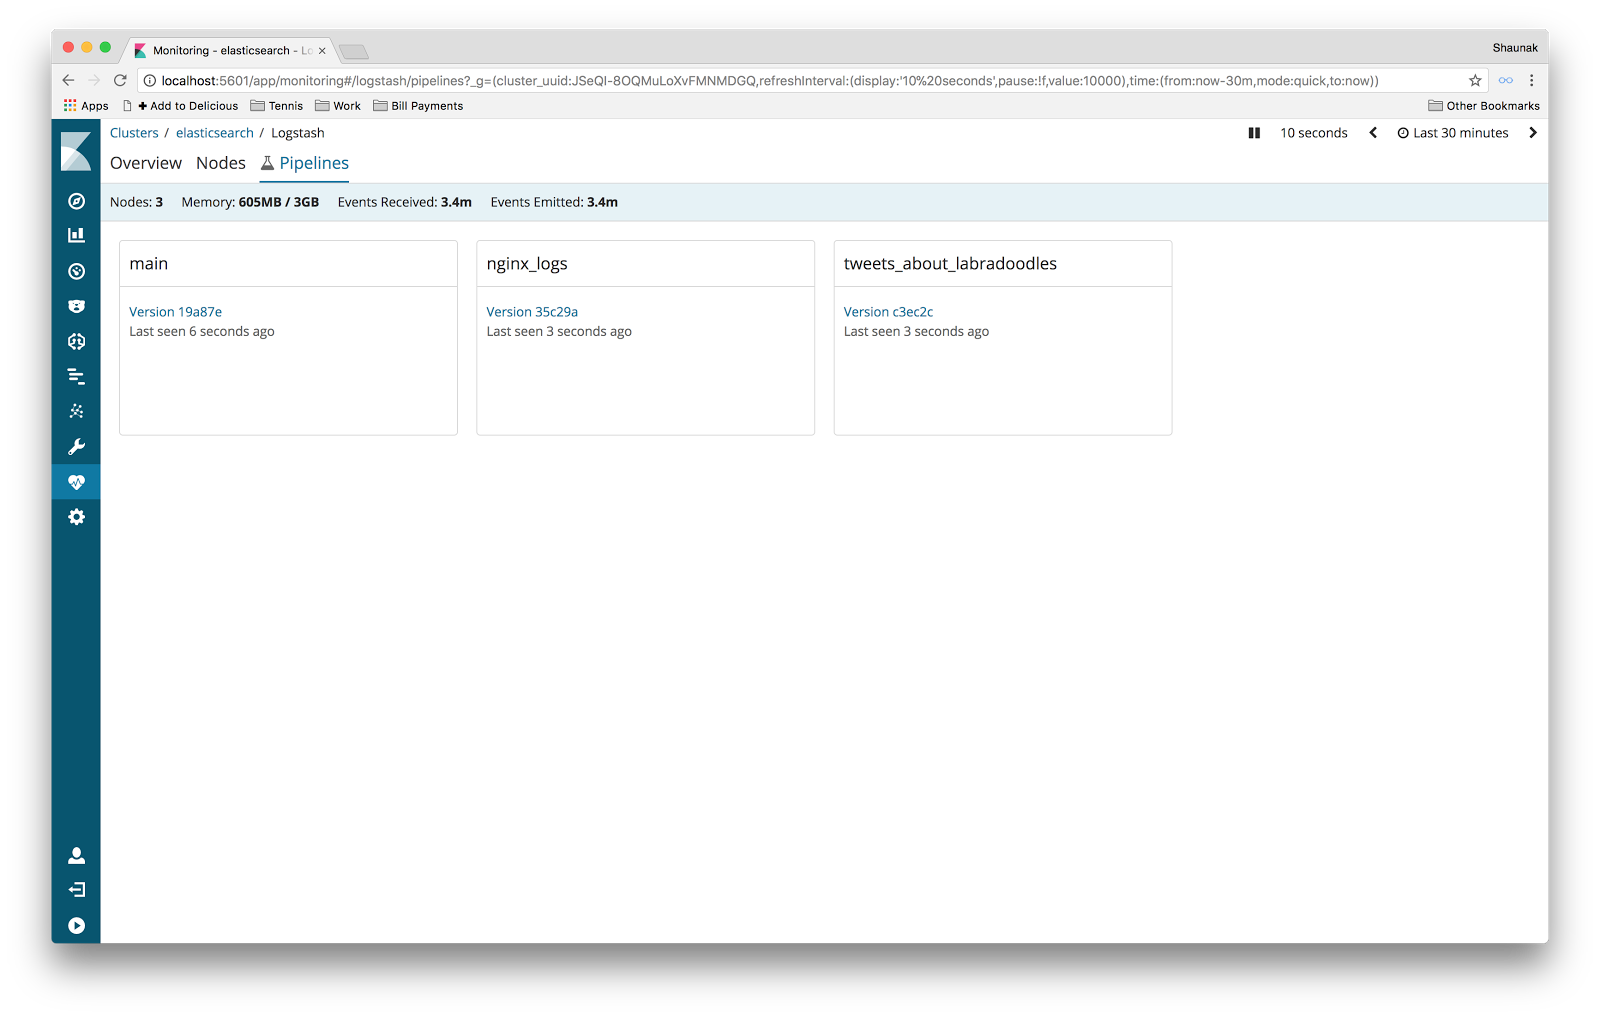
Pipelines Listing UI in Monitoring
In 6.0 we released the Pipeline Viewer as part of X-Pack monitoring. To open a specific pipeline in the Pipeline Viewer, you had to first go through the Pipelines Listing. This view simply listed all the pipelines (and their versions) that you had running in the selected time window. Each pipeline was shown as a “card.”
Well, we weren't entirely happy with this UI. In particular, if a pipeline had more than a handful of versions in the selected time window, we didn't have a nice way to present them all in a scalable manner. Also, the UI served a single purpose — as a navigational tool. It allowed you to click a pipeline version to open it in the Pipeline Viewer. That's fine for a first cut, but a good UI would also draw your attention to pipelines that deserve investigation. Finally, the card layout was somewhat experimental and didn't offer intuitive affordances for operations such as sorting and filtering.
So we set about redesigning the Pipelines Listing. After a few iterations and bit of hallway usability testing, we settled upon a new design.
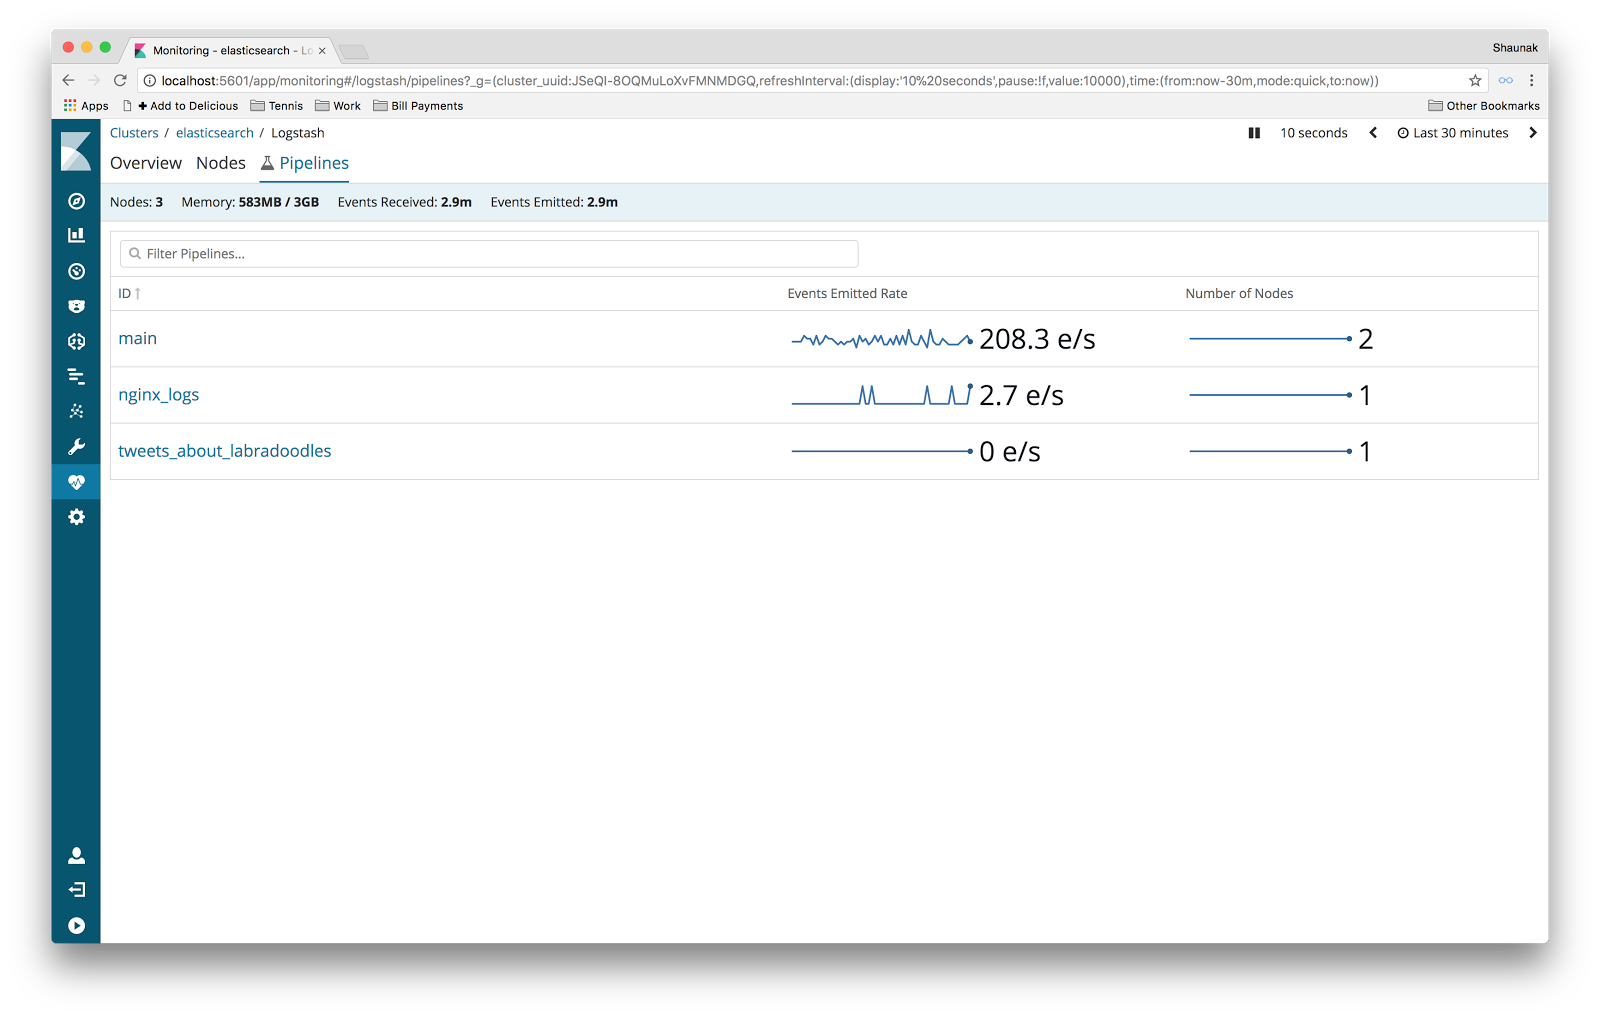
Notably in the new design, we got rid of the versions altogether as users found these confusing and overwhelming. Don't worry though; you can still navigate between different versions of a pipeline in the Pipeline Viewer. We also switched from a card layout to a more traditional table-of-rows layout to make sorting and filtering more intuitive. Finally, we added a couple of sparkline charts for each pipeline in the list, showing the performance of each pipeline over time. These charts help you quickly choose which pipeline to explore.