Elastic Stack & Cloud 8.6: Vector search, alerting and cases, metrics indices enhancements

 Share on Twitter
Share on Twitter

 Share on LinkedIn
Share on LinkedIn

 Share on Facebook
Share on Facebook

 Share by Email
Share by Email

 Print this page
Print
We are pleased to announce the release of Elastic Stack 8.6. Ready to roll up your sleeves and get started? We have the links you need:
- Start Elasticsearch on Elastic Cloud
- Download Elasticsearch, Kibana, Integrations
- 8.6 release notes for Elasticsearch, Kibana
- 8.6 breaking changes
What else is new in Elastic 8.6? Check out the 8.6 announcement post to learn more >>
Metrics storage optimizations
Elasticsearch is designed to analyze all types of machine-generated data so that analysts can efficiently research all the available data about security and observability incidents, which includes logs and metrics. While both logs and metrics data include a series of documents with timestamps, logs generally contain a series of events, while metrics tend to be a series of samples from what can be described (with some approximation) as a continuous function. Some optimizations can be made for use of Elasticsearch on metrics data (i.e., using Elasticsearch as a time series database), mainly relating to index size (TCO) and to the analysis of a time series across time. We have been working to perform these enhancements and now, after a lot of investment, users start enjoying the fruits of this effort.
Time series data streams
In 8.6, Elasticsearch supports a new type of index: time_series (in tech preview). A time_series index is an index that contains a time series of metrics data and is typically used as part of a data stream. Elasticsearch routes the incoming documents in a time_series index so that all the documents for a particular time series are on the same shard, and the shard is sorted by time series and within it by timestamp. There is also no overlap in time between time_series indices within the data stream.
This structure has a couple of advantages:
- Documents from the same time series are stored next to each other on disk, so the operating system pages are much more homogeneous and compress better. For example, just by sorting and having the time series dimension fields (the fields that define the time series ID) compressed, the indices shrink by a whopping 30% (on average; your mileage may vary), yielding massive reduction in TCO.
- The analysis of a time series typically involves comparing each two consecutive docs (samples), examining the last doc in a given time window, etc., which is quite complex when the next doc could be on any shard, and in fact on any index. Sorting by time series and timestamp and avoiding overlapping indices allows improved analysis, both in terms of performance and in terms of our ability to add new aggregations (which we are actively working on).
Even though time series database (TSDB) indices don’t overlap within the time series, Elasticsearch still accepts late arriving documents within a configurable buffer period (writes will be accepted as long as the index is writable). This mechanism avoids rejecting late arriving docs while also enabling the query to scan only relevant indices.
More compact vector search
Vector similarity is a great way to improve relevance ranking, and with the HNSW based KNN vector search capabilities that were recently made generally available in Elasticsearch 8.5, we see a growing interest in using Elasticsearch for vector based search.
Elasticsearch 8.6 provides vector quantization support with byte size vectors. Users who run vector similarity searches at large scale often look for a balance between ranking accuracy and the cost of maintaining a vector index. This cost is driven by hardware requirements, query latency, and indexing performance. One way to balance costs is to reduce the size of the vectors. The trivial way is to reduce the number of dimensions in the vectors (e.g., by PCA or a similar algorithm). Another way, which often results in better ranking accuracy for a given index size, is to reduce the size of each element in the vector (e.g., from a vector of floats to a vector of integers), resulting in an index that is a quarter of the size of the original index, and improved query latency and indexing performance.
In 8.6, we are introducing a byte (8 bits) sized integer per vector element (dimension). This new option for dense vectors with integer dimensions supports both brute force and HNSW based kNN vector similarity. More information is available in “What’s New in Elasticsearch 8.6.”
Streamline investigative workflows with a new Opsgenie connector and more
Opsgenie connector
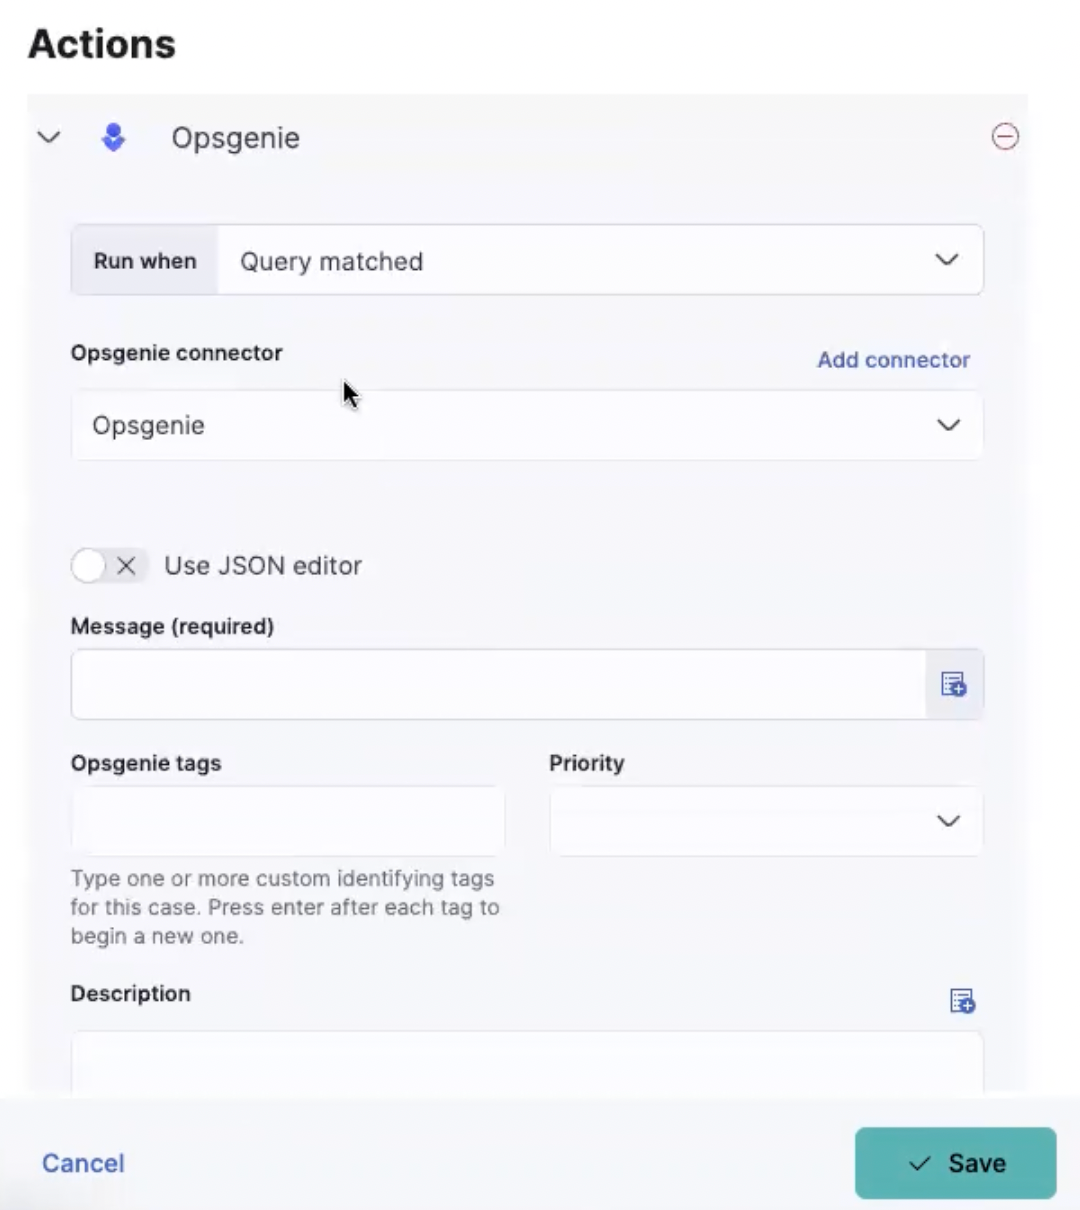
A new connector that allows customers to create and recover an Opsgenie alert based on detected observability alerts is now available.
The connector supports the Opsgenie fields (like message, description, priority, responder, alias, and details) in order to unlock new use cases for Opsgenie users and increase adoption and consumption of new IT teams within the organization.
New case management capabilities
There are a bunch of new functionalities that allow users to manage the case view or maintain a particular case and its related entities like linked alerts and associated tickets in third parties.
There are new supported actions in the case table in order to streamline case maintenance:
- Bulk action for maintaining case status, tags, and case severity
- Filter by case with no assignee
New functionalities to manage a particular case:
- The case title limit is increased to 160 characters to allow users a better way to summarize and collaborate on cases.
- Unlinking of alerts from a case is now available. Users have been able to attach alerts to cases, but previously there was no way to remove them, leaving you with no way to cancel the action if you had added the alerts into a case by mistake. The new “remove” action will unlink the complete set of alerts that were previously attached to the case. However, there is currently no way to remove an individual alert from the group.
- Users have been able to send cases to third parties and create tickets, but previously there was no way to link back from the ticket to the linked case. The case URL is now shared as part of the created ticket to allow customers to easily find the associated Elastic case.
- New email notification is now sent for users assigned to cases. This improvement will reduce the response time to case escalations and increase case collaboration.
New alerting rule management capabilities
New actions are now supported in the Alerting Rule table view in order to streamline rule management:
- Bulk action for deleting rules
- Cloning existing rules
- Logs from rule runs can now be viewed across multiple Spaces
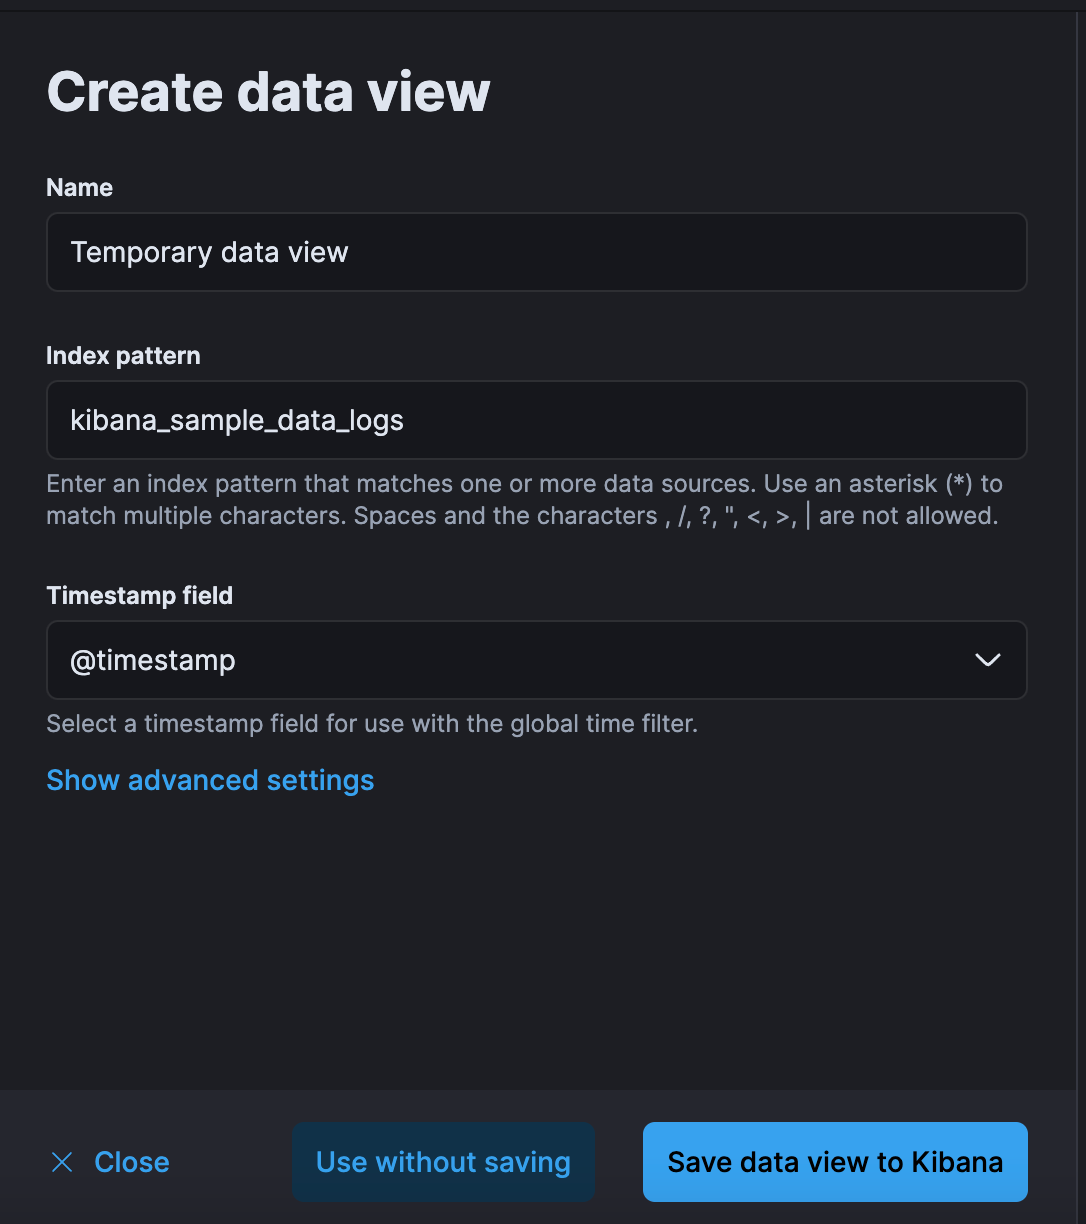
Analyze with greater flexibility using ad hoc data views
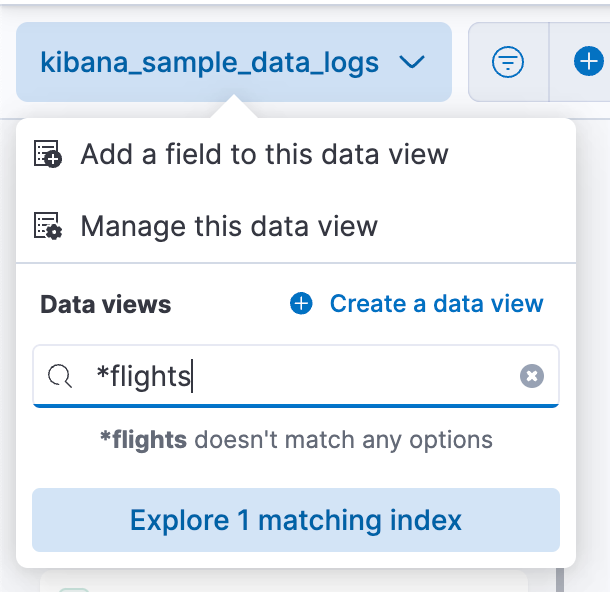
With ad hoc data views, you can create temporary data views on the fly, allowing you to explore and visualize your data before you’re ready to share your insights with others in your organization. When you’re ready, you have the option to permanently persist ad hoc data views for a fully collaborative experience.
Data views have become a formal concept in Kibana today. Before you can analyze your data in Kibana, you must first create a data view, requiring you to understand the underlying indices or data streams for capturing the correct documents.
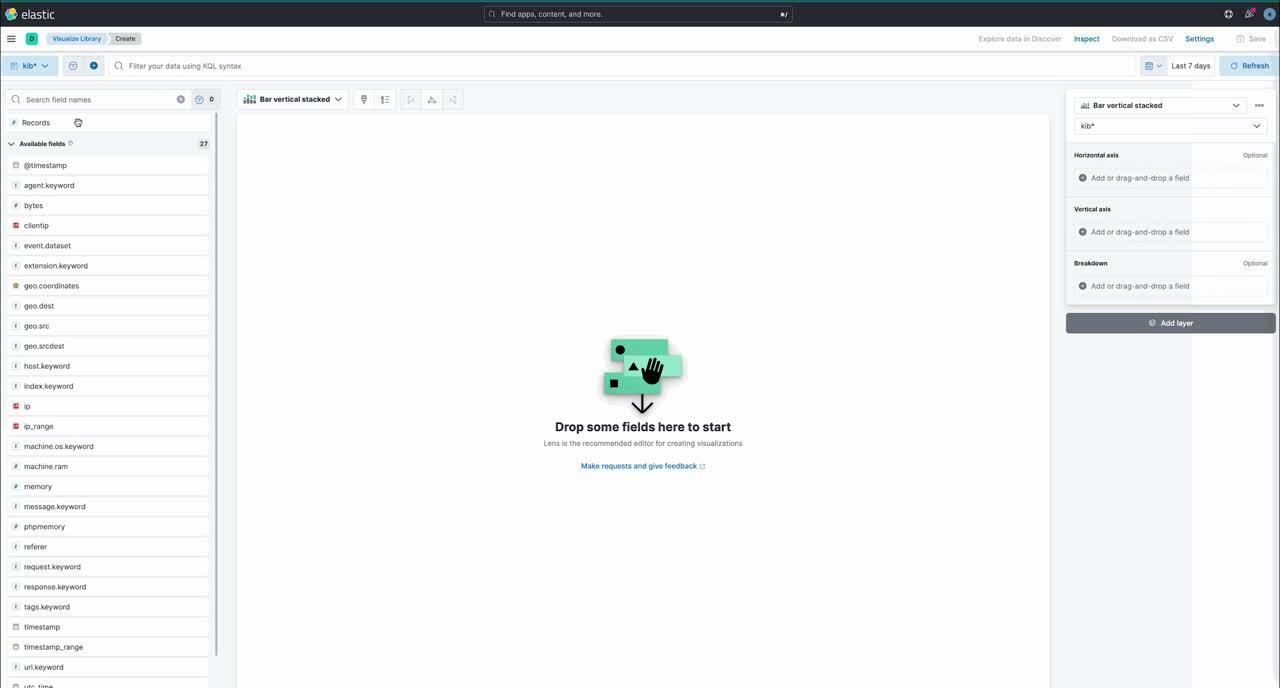
Previously, you explored your data solely in data views or in another application that manages the schema, such as the logs stream. Ad hoc data views reduce the complexity of the underlying data so analysis can flow into Discover and Lens. As an analyst, this allows you to build on existing work or create entirely new datasets and visualizations directly from your Observability and Security data without storing new saved objects.
For administrators, ad hoc data views allow you to control the data views that others in your organization can modify, without limiting the ability to iterate on them.
Capabilities:
- Create ad hoc data views directly in Discover and Lens via the data view menu.
- Create temporary data views without persisting them in a data view saved object.
- Create Elasticsearch query alerts using your ad hoc data views.
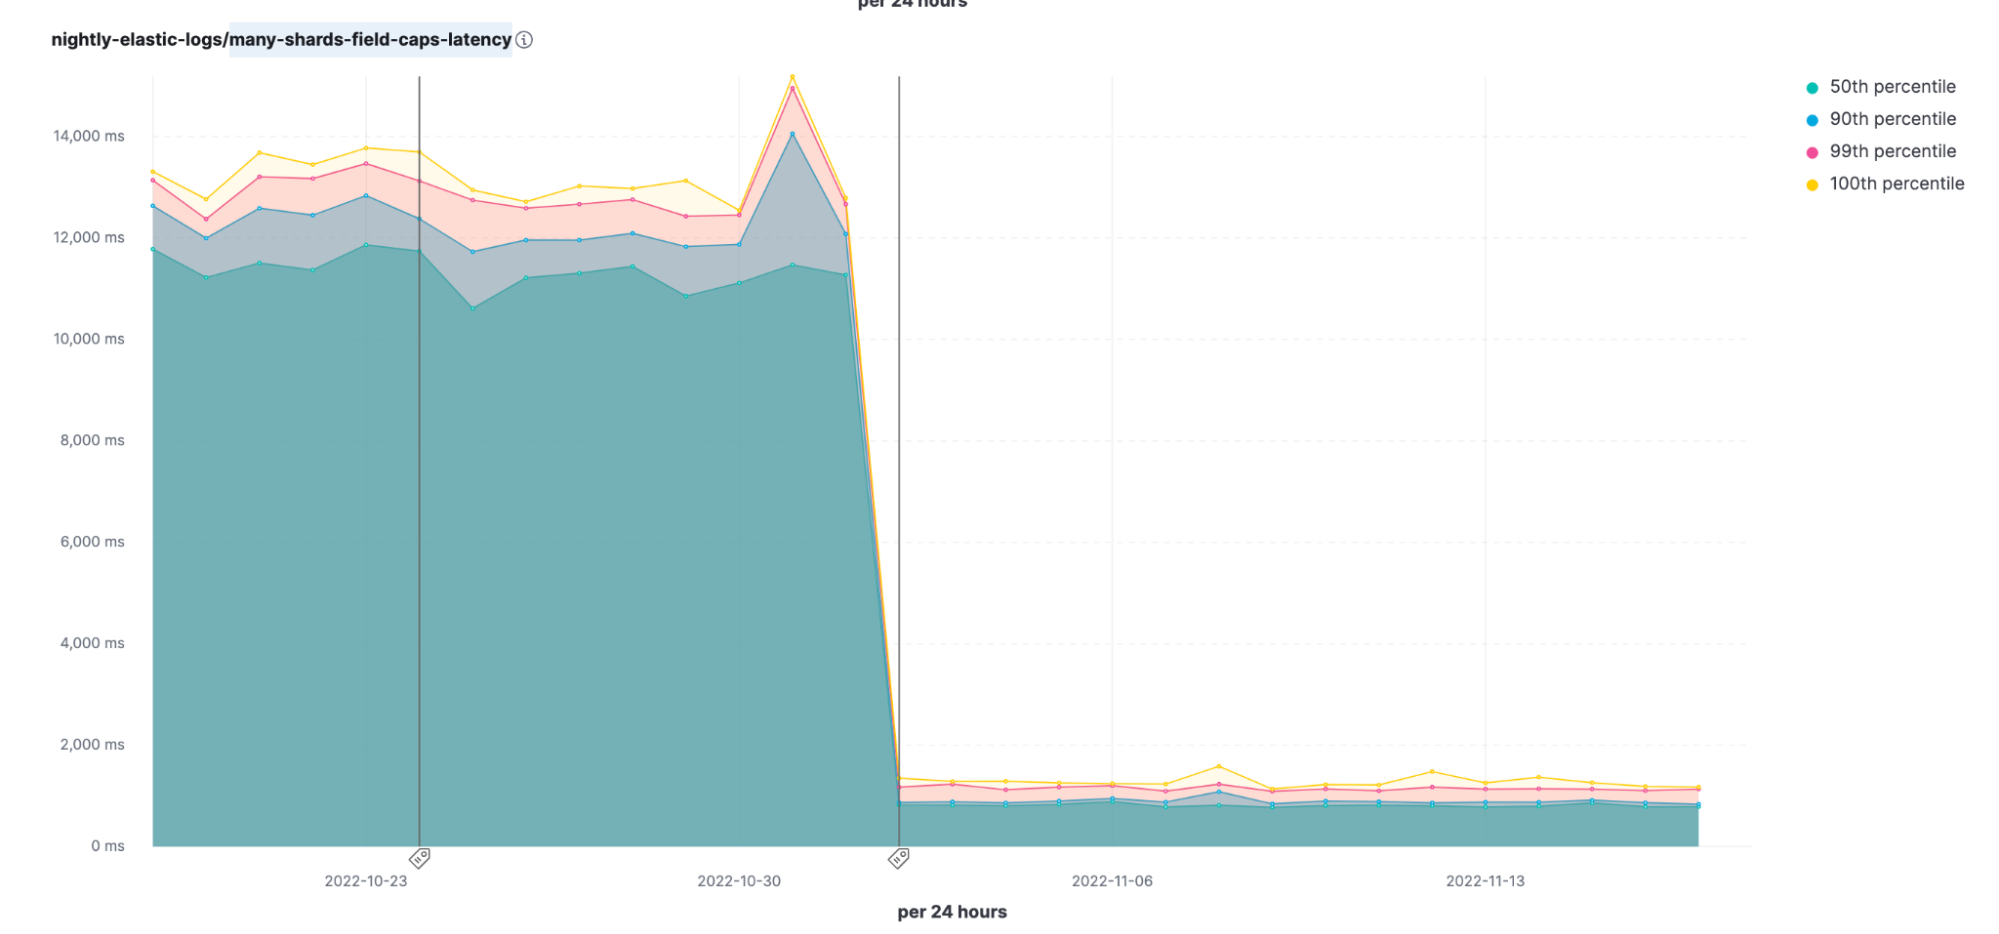
Field capabilities API performance improved by 10 times!
The field_caps API provides information about a field. It is used extensively by Kibana and through that by all Elastic solutions. We have found a way to improve the performance of this API when it is used on a group of indices that share the same mappings, which is by far the most common usage pattern. The results on our many-shards-field-caps-latency nightly benchmark are amazing — down to around 10% of the original time. This comes on top of the significant performance improvements done to this API in 8.2. Great reason to upgrade!
Better balancing of shards
Balance means performance and stability when it comes to clusters.
Earlier versions of Elasticsearch balance their shards by moving shards between nodes to improve their allocation as much as possible in a single step and then repeating this process until the cluster is as balanced as possible. This tactical approach is remarkably effective in practice, but without a view of the final desired balance of shards it sometimes takes more shard movements than necessary to fully balance a cluster.
In 8.6, we are introducing the new "desired balance" allocator, which computes the state of a fully balanced cluster first and then performs only the exact shard movements necessary to reach that state. Moreover, the previous allocator would block other cluster management tasks while it was searching for the next shard movements to start; in contrast, the desired balance allocator runs its computations in parallel with other cluster management tasks on the elected master node, which improves cluster stability, especially in larger clusters.
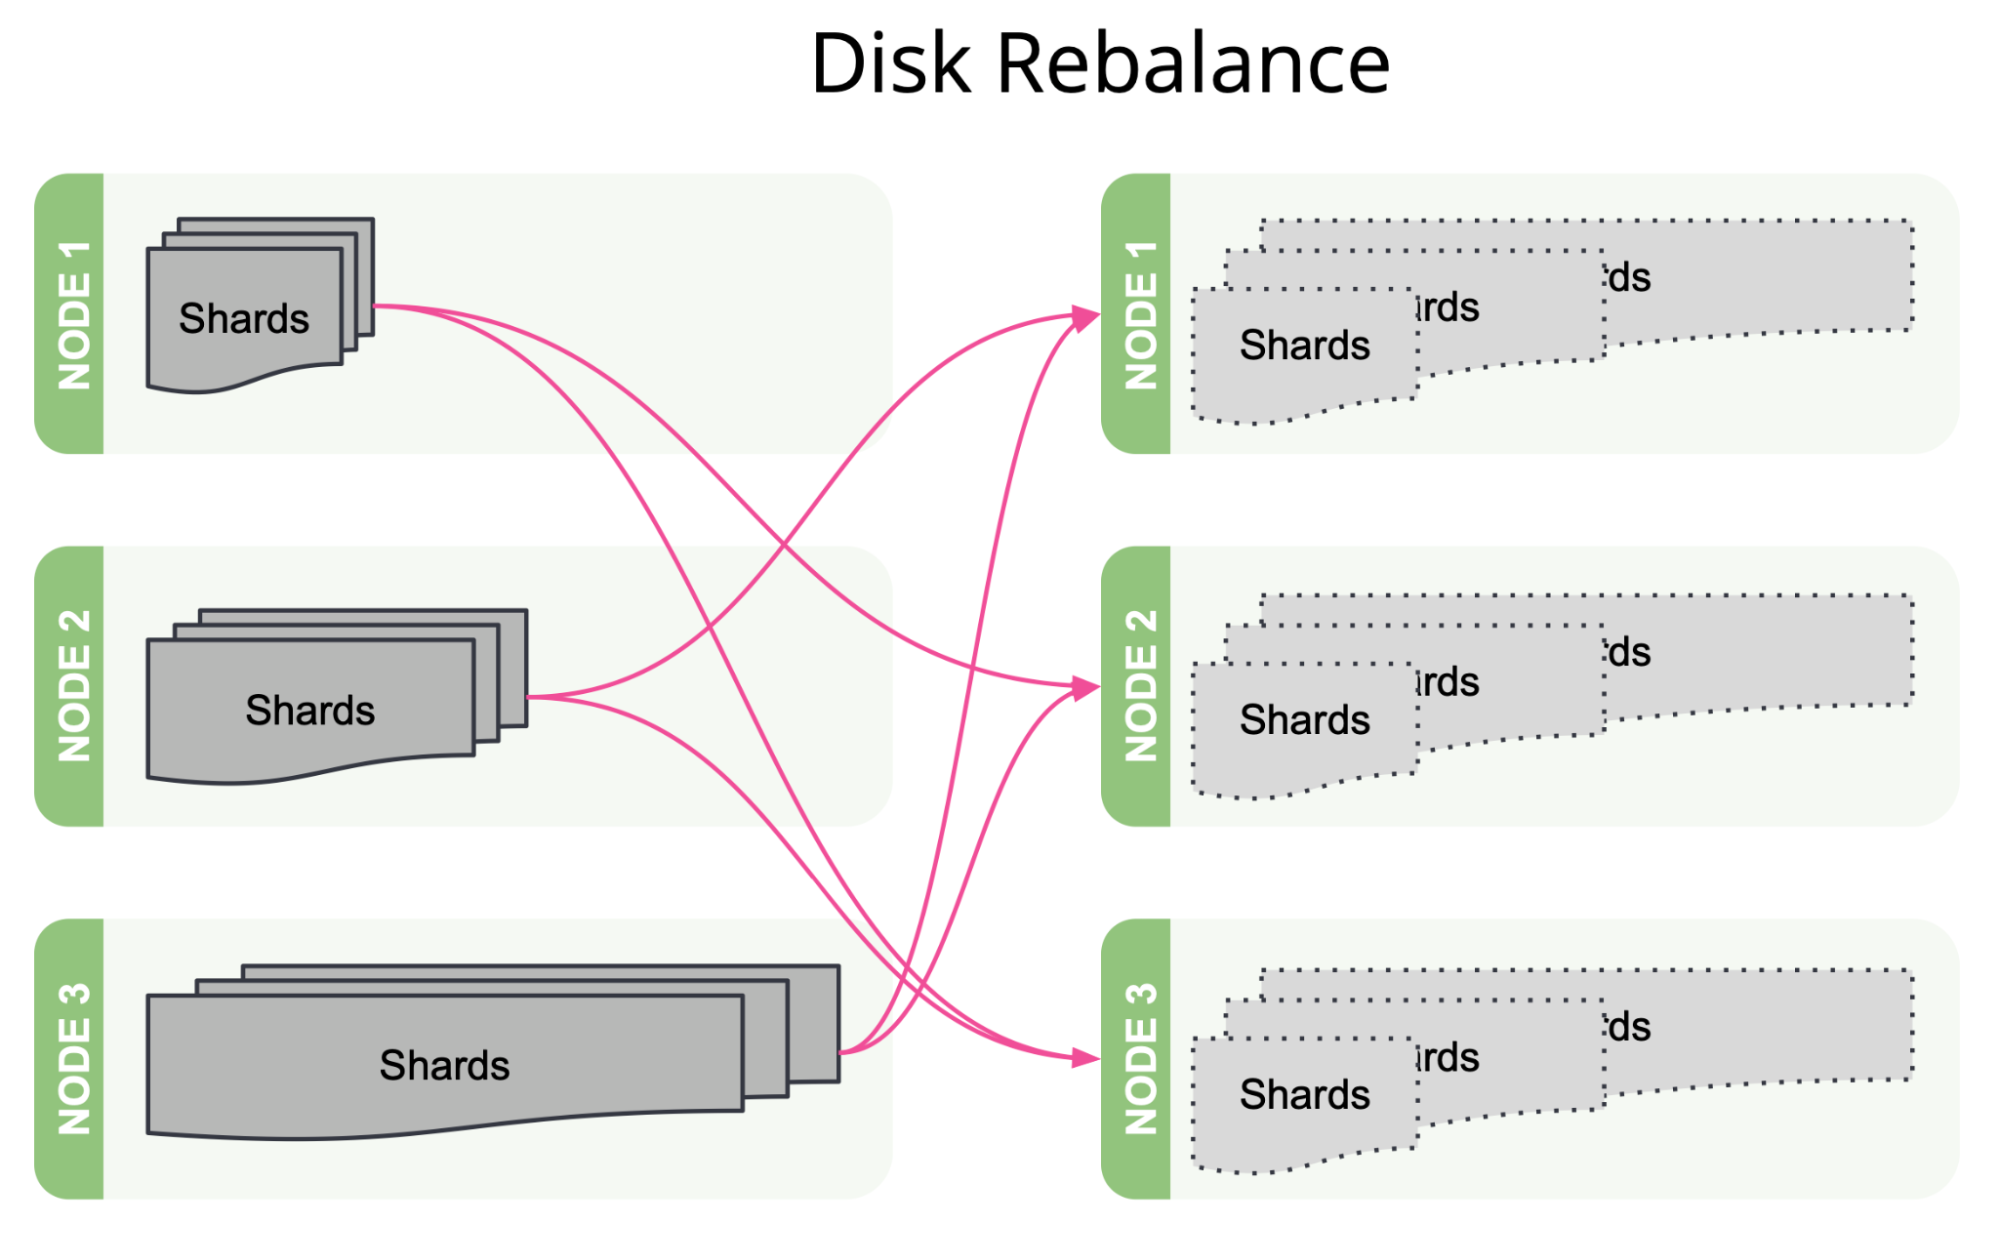
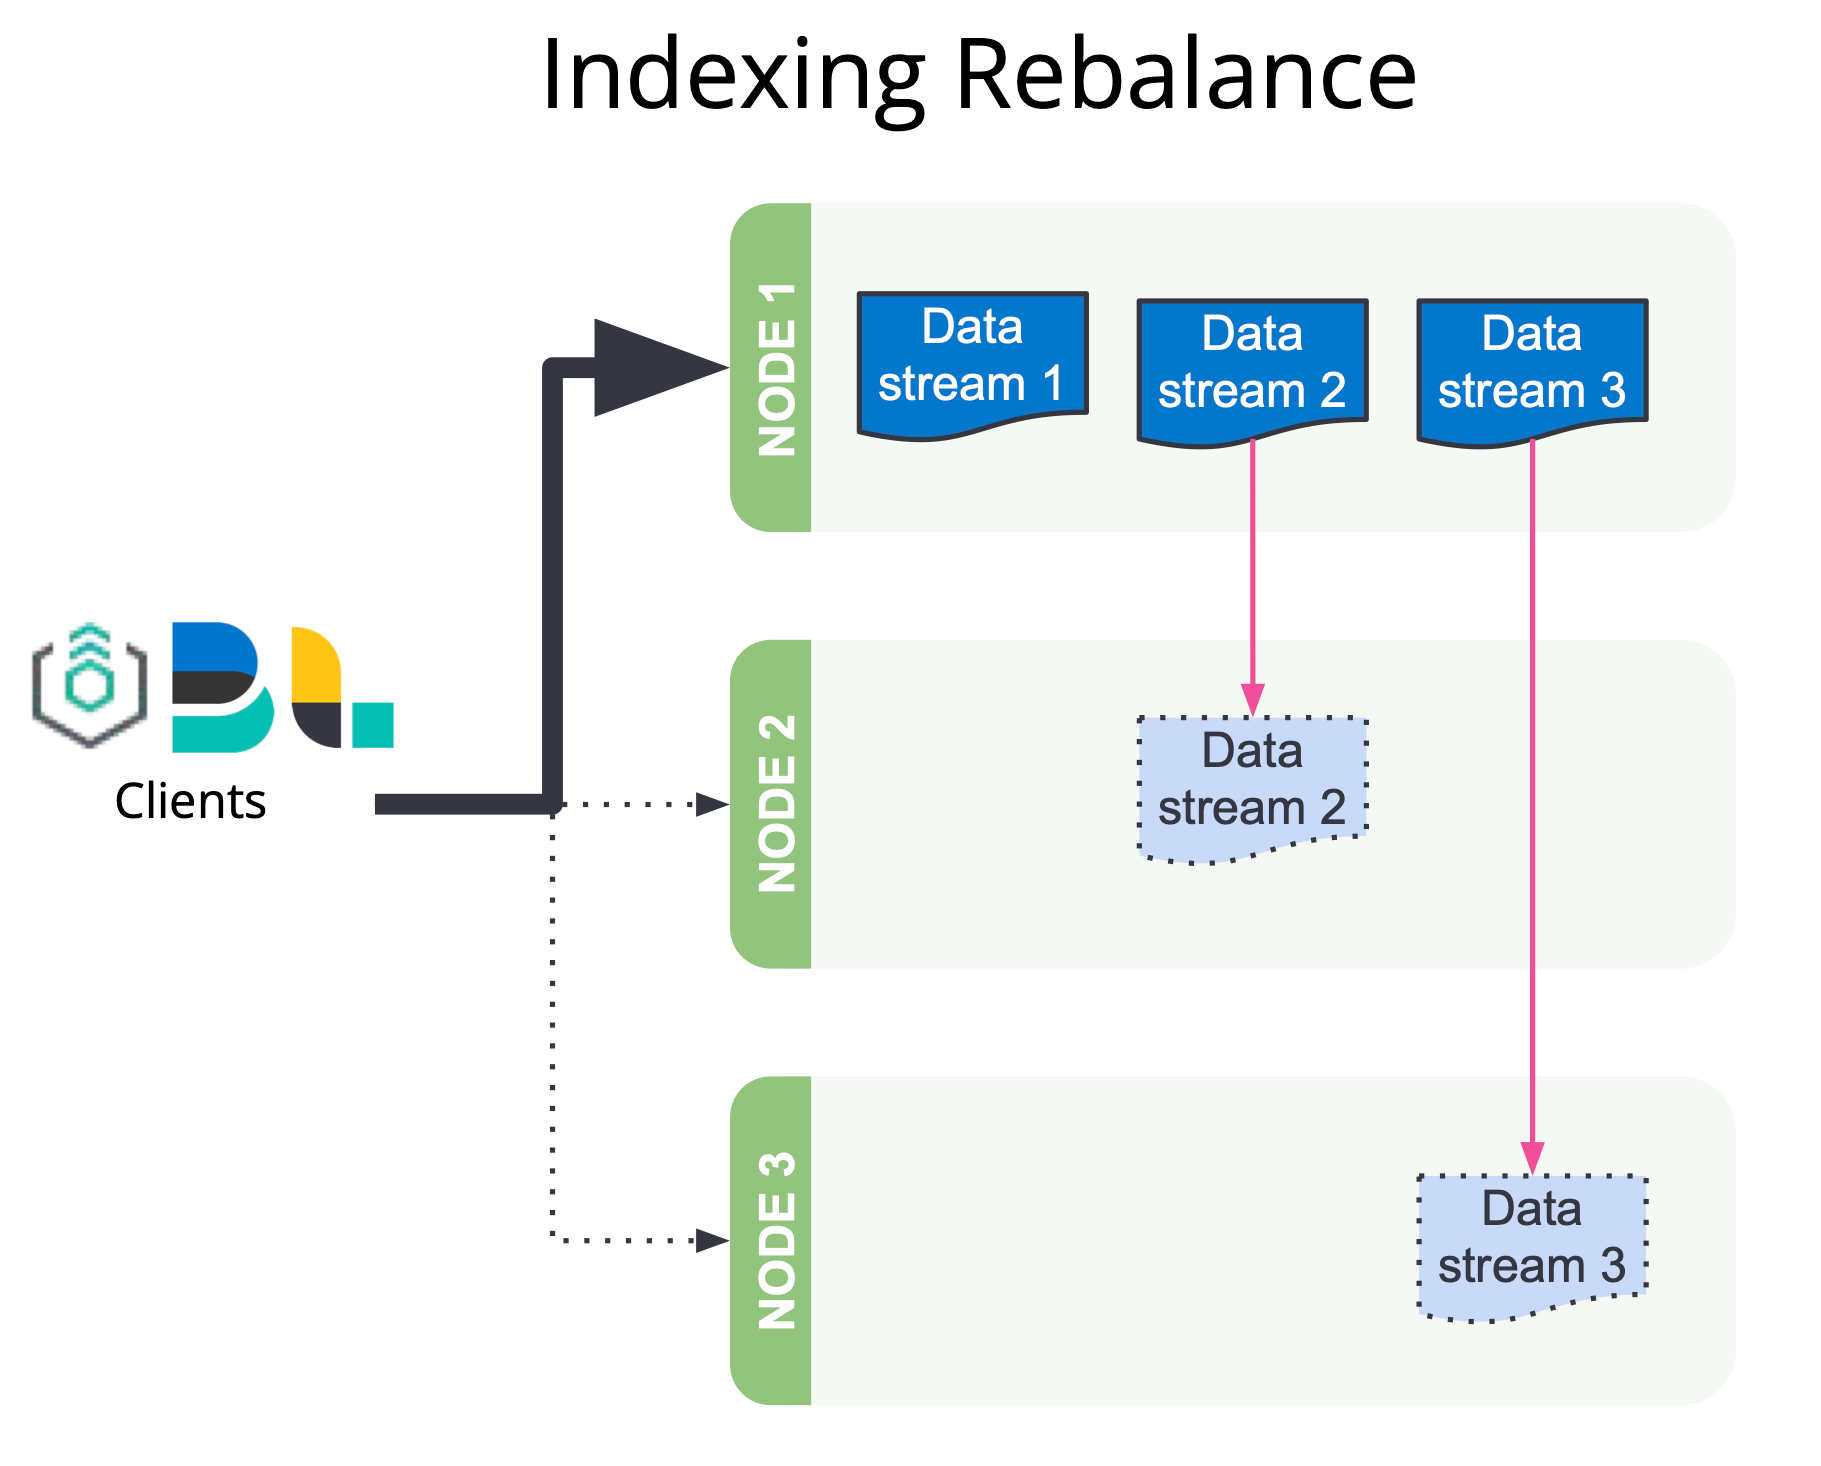
Furthermore, we introduce two additional variables into the balancing computation. In earlier versions, shards were all considered to be equivalent and were balanced among the nodes by shard count only. From 8.6, shard size will also be taken into account by default to achieve a more uniform disk usage. This avoids larger shards concentrating on particular nodes, which can cause disk watermark hotspots. All Elastic Cloud and all self-managed Enterprise-subscription users will further benefit from the shard balancing strategy based on observed data stream write load. This will reduce indexing hotspots by spreading out the shards of high-traffic data streams to improve the balance of CPU usage across the hot nodes.
Geo Hex tiles 20% speed up
In 8.1 we introduced hex tiles that are often the preferred choice of tile for geographic analysis. To do that, we ported the Uber H3 library to Java (and released the ported code as open source). H3 provides a method (geoToH3) that accepts a latitude, a longitude, and a precision (resolution in H3 API) and returns the H3 bin (tile) that the point is in. We found a way to optimize this method, yielding a whopping 20% performance improvement!
Cartesian centroid and cartesian bounds aggregations
Cartesian shape and point fields enable users to use their own coordinate system. In 8.6, we are adding support for the centroid aggregation and the cartesian bounds aggregation on shape and point. This is another step in our journey to enable users to use any coordinate system of their choice in Elasticsearch.
Try 8.6 today
Read about these capabilities and more in the release notes.
Existing Elastic Cloud customers can access many of these features directly from the Elastic Cloud console. Not taking advantage of Elastic on cloud? Start a free trial.
The release and timing of any features or functionality described in this post remain at Elastic's sole discretion. Any features or functionality not currently available may not be delivered on time or at all.
Share
- Share on Twitter
Share on Twitter
- Share on LinkedIn
Share on LinkedIn
- Share on Facebook
Share on Facebook
- Share by Email
Share by Email
- Print this page
Print