Kibana 7.3.0 released
Today we are pleased to announce the release of Kibana 7.3.0. From Elastic Maps becoming production ready to Kerberos support and many more Kibana improvements, 7.3 is jam packed with Kibana goodness.
Latest stable release in 7.3.0:
You can read about all the changes in the release notes linked above, but here are a few changes that are worth highlighting.
Elastic Maps is now GA!
We’re excited to announce that Elastic Maps is production ready in 7.3. To find out more about what’s in Maps and how to use it, check out our Maps 7.3.0 release announcement and our documentation.
The 7.3 release adds new layer styling enhancements, including the ability to select the color ramp for heatmap layers and to symbolize point features with icons that you can color, size, and rotate based on property values.
Maps also includes a new top hits aggregation feature, which enables you to plot the most recent entities from your Elasticsearch indices.
Another notable Maps improvement is that it’s now easier to get your geospatial data into the Elastic Stack. Use the new GeoJSON upload (beta) feature to drag and drop your points, shape files, and features and ingest them directly into Elasticsearch.
Tooltips are enhanced to display a count of features at the current location. Pagination controls give you the ability to cycle through all features and view their properties. You can now provide custom labels for grid aggregation metrics and join metrics to provide better context in tooltips.
Kerberos support
Kerberos was supported in Elasticsearch starting in 6.6, and in 7.3, Kibana introduces the Kerberos authentication provider. This provides single-sign-on (SSO) access to users and the ability to log into Kibana without repeatedly providing a username and password.
Kerberos is one of the oldest authentication protocols and one of the most heavily used in enterprise environments, supported both in Windows and Unix-based infrastructures. As a result, it is one of the most thoroughly tested protocols. SPNEGO is used in order to negotiate and implement the Kerberos protocol for web applications, i.e., to extend it to HTTP. Kerberos takes its name from the three-headed dog in Greek mythology that guarded the gates of the Underworld so the dead could not escape.
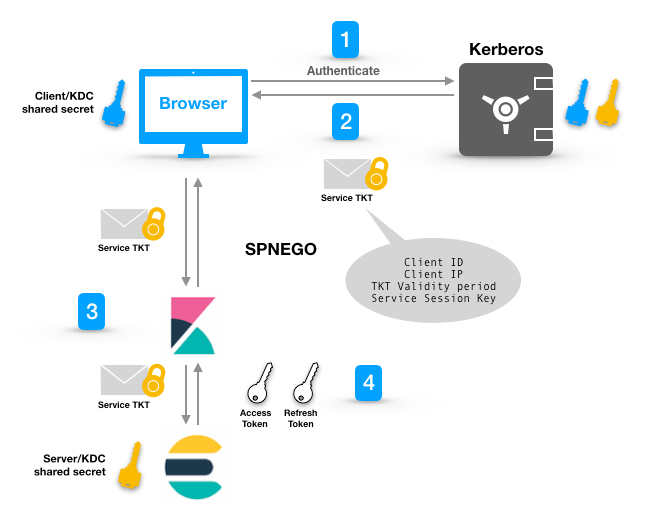
The high-level idea is that the client and the server each share a secret with the Kerberos Distribution Center (KDC), which is a trusted authentication entity. When the client requests a service, it authenticates with Kerberos and obtains a ticket to the service. The password never travels; rather, it is used to produce a key. The hashed key, instead of the password, is then sent to the Kerberos Authentication Service (AS). Kerberos checks for the particular user in its database, hashes the corresponding password in turn (already existing in its database), and attempts to match it to the key it received through this login attempt. If successful, it grants a ticket.
The ticket is encrypted with the secret, which is only shared between Kerberos and the service. The client then forwards the ticket to the service, which now knows that the client has authenticated with Kerberos, since it is providing a ticket encrypted with a secret only known to itself and KDC. In an SSO environment the ticket can then be shared with other services so that the user does not need to authenticate separately for each service they need to access. Hence, depending on your set up, Kibana might be retrieving the Kerberos ticket obtained initially for other services, without asking the user to log in. Once obtained, Kibana will next forward the ticket to Elasticsearch. In return it will receive an access and refresh token for subsequent Kibana/Elasticsearch comms. The following diagram is a simplification of the protocol.
If you would like more details, please read up in our Kibana Docs.
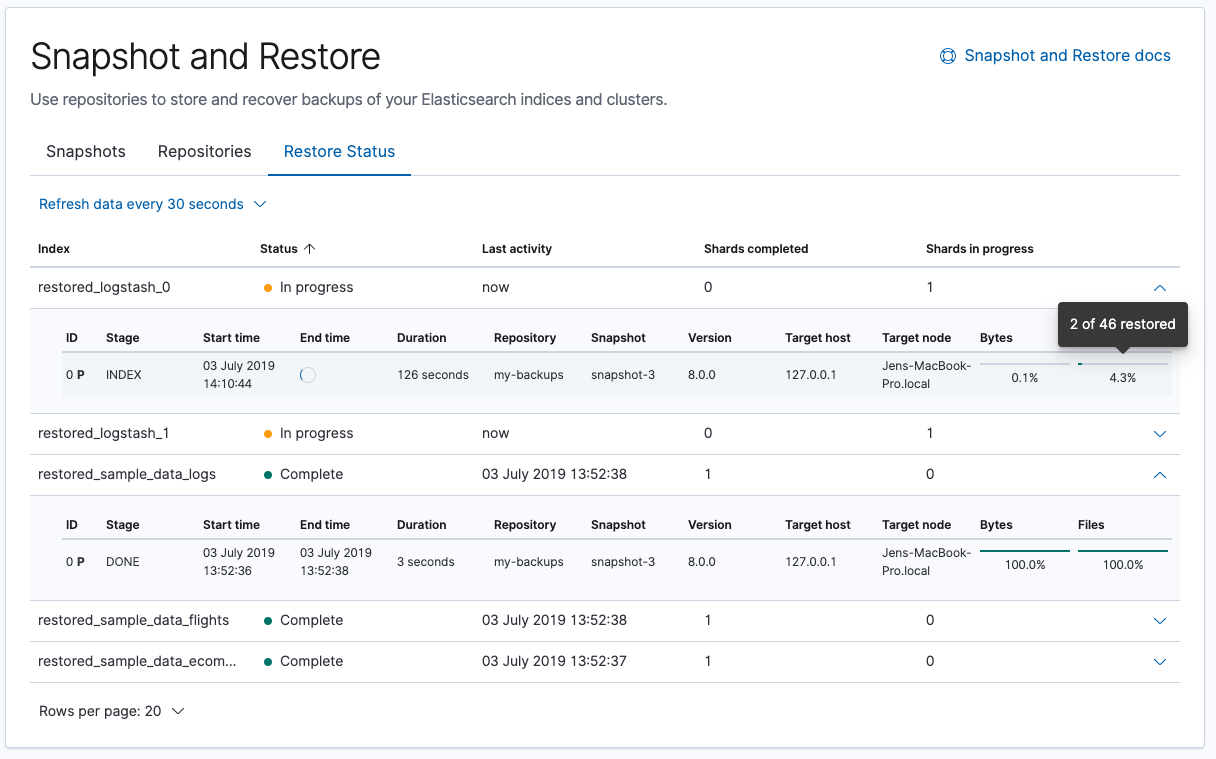
Delete and restore snapshots
The second phase of the snapshot management UI includes two notable enhancements: delete and restore. Delete snapshots to free up your repository storage space. To recover data and state from a snapshot, use the new Restore wizard.
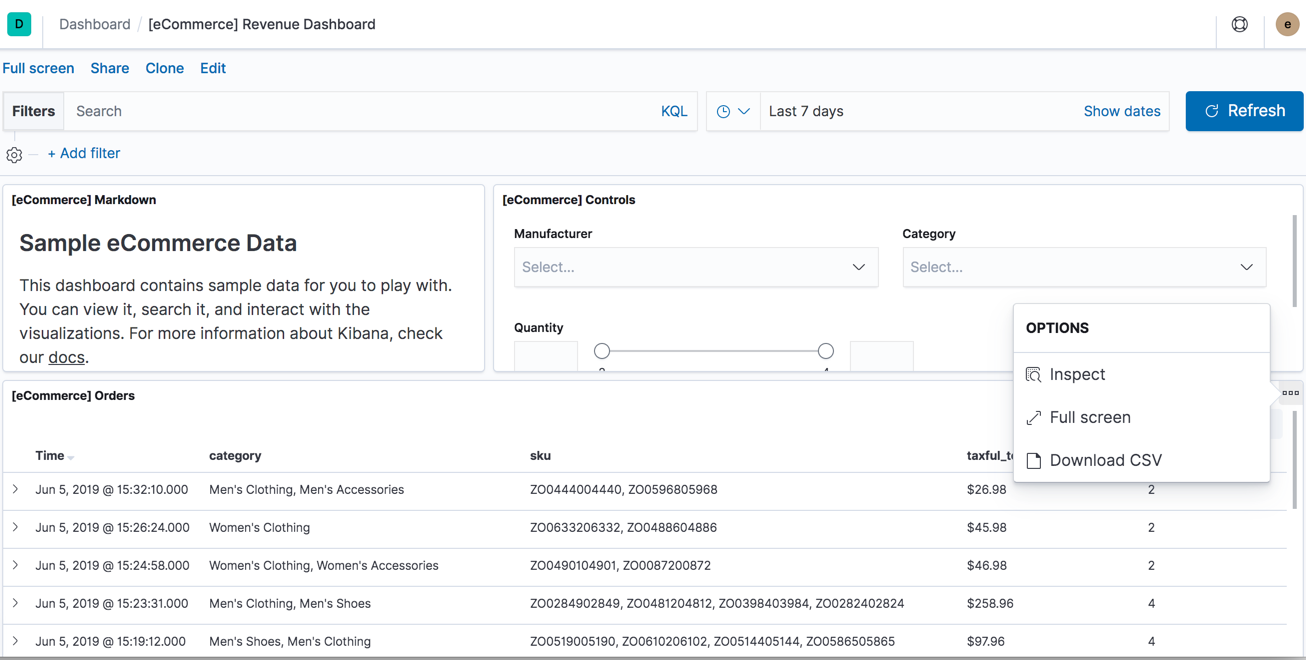
CSV export from a saved search
Kibana now allows you to export a saved search on a dashboard directly to CSV. This action is available in the dashboard panel menu for the saved search. To enable this feature, you must set xpack.reporting.csv.enablePanelActionDownload: true in your kibana.yml file.
SIEM & ML: Better together
Users looking to extend their coverage beyond the prebuilt SIEM jobs can easily add custom anomaly detection jobs using the Machine Learning app. Detected anomalies are displayed on the Hosts and Network views in the SIEM app in an Anomalies table, and specific details are available in the Host Details and IP Details pages. Check out even more details about our SIEM solution in the SIEM release blog.
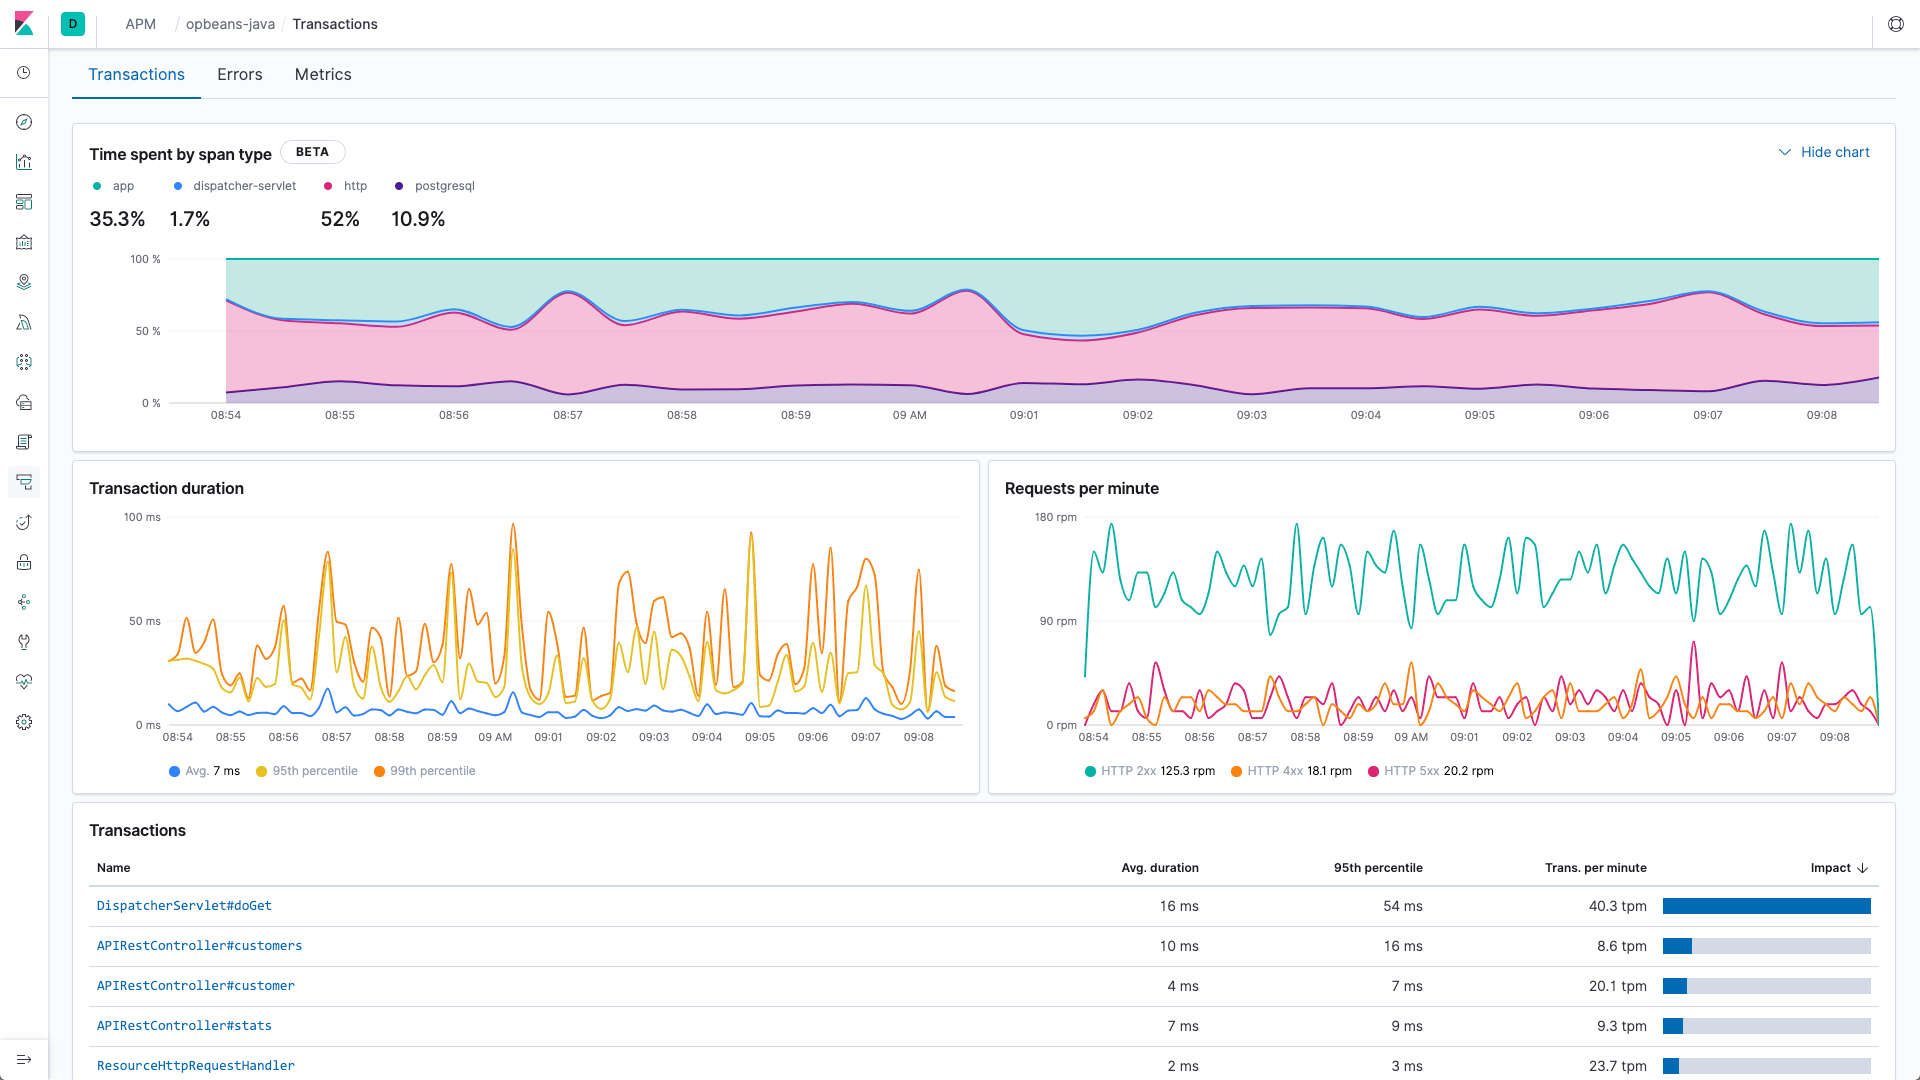
APM Service Breakdown Charts
The APM app adds a great new "Time spent by type" chart which allows you to see exactly where your applications are spending their time, allowing you to quickly identify and fix issues. The service breakdown chart is visible on both per-service and per-transaction screens for the supported agent types.
Read about this and other Observability changes, such as APM Agent Configuration, .NET Agent GA, Metrics Explorer GA, and more in our APM, Infrastructure, Logs, and Uptime 7.3 blogs.
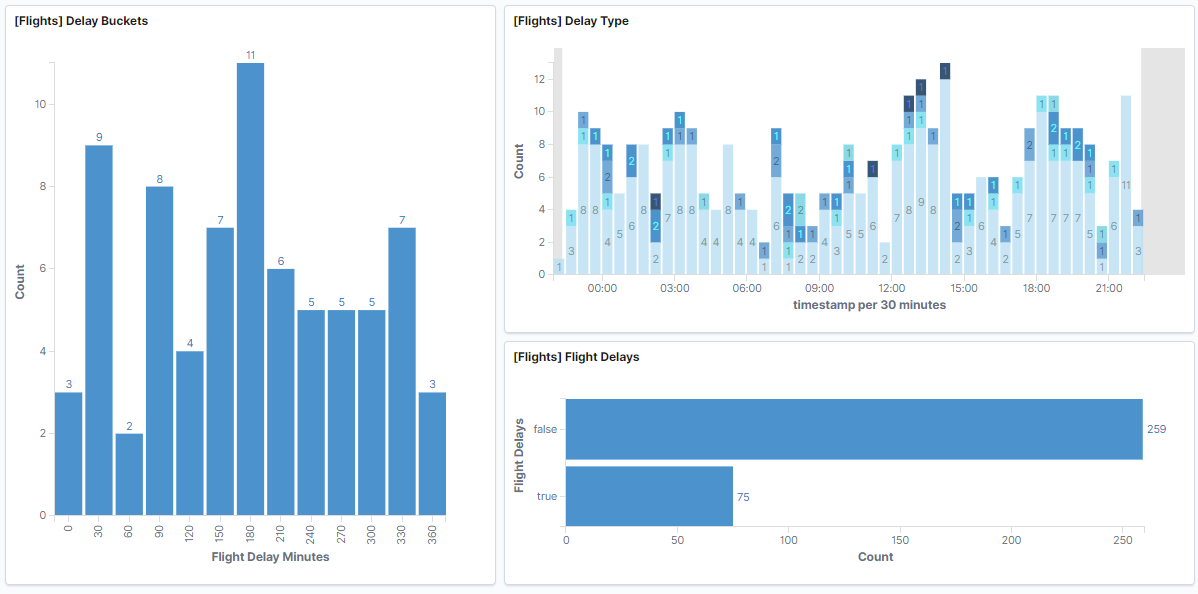
Show values inside bar charts
Bar charts now have the ability to show the values directly inside the chart, if space is available. When you create the bar chart, open Panel Settings and select Show values on chart. A big thanks to Meir Meshi for contributing this feature.
KQL + autocomplete in filter aggregation
KQL + autocomplete helps users write the queries they want without the need to memorize and learn syntax. In Kibana, we are now expanding this to filter aggregations. When users use filter aggregation in Visualize or TSVB, KQL is the default language and they can use the suggestions to write their query. KQL and autocomplete help users write queries using the right field names, operators, and values.
Canvas updates
Canvas improves the user experience with new templates, experiences, and documentation.
Templates
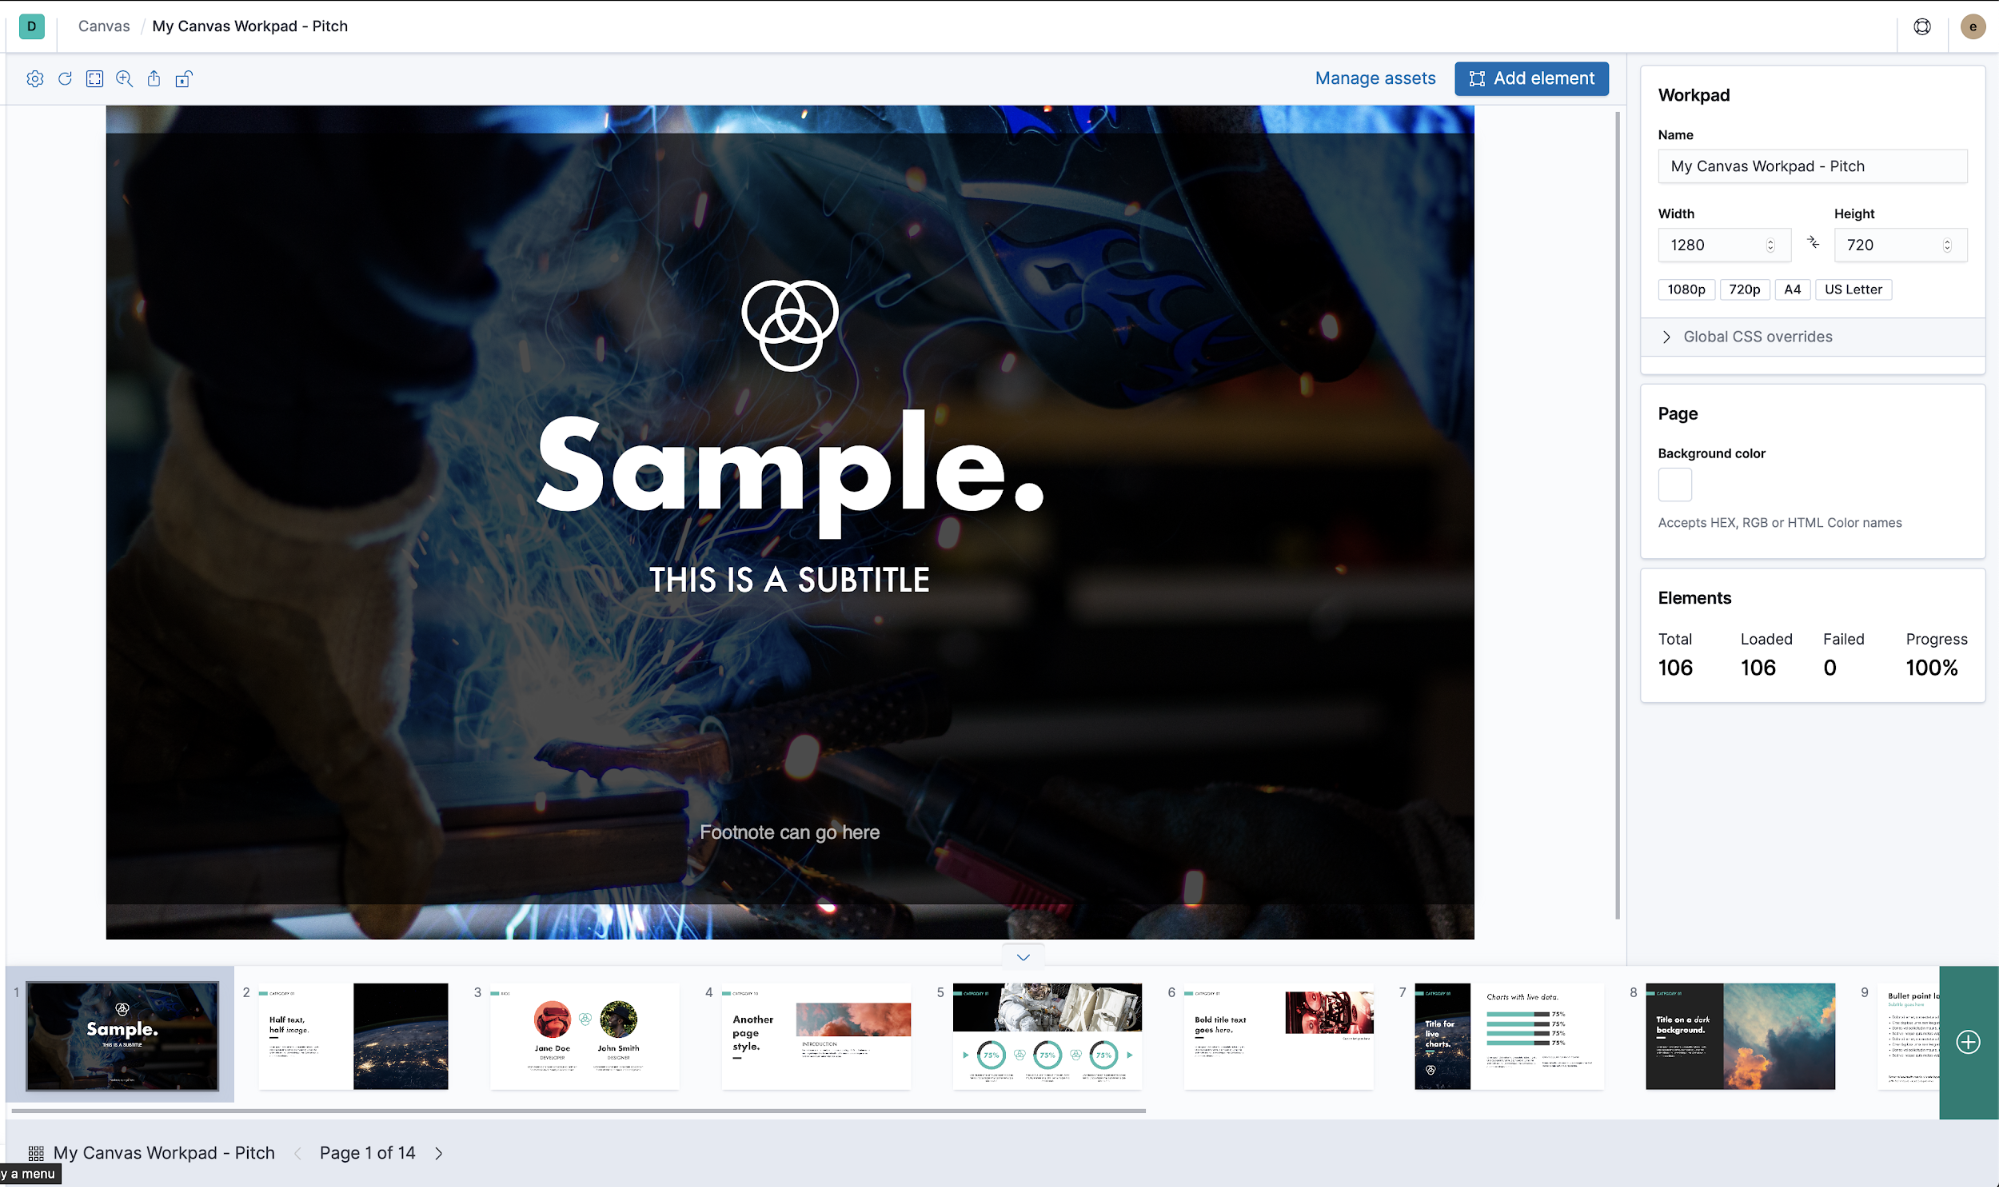
Canvas is all about creating content and telling a story with your data. The content templates, or Canvases for short, help you facilitate this vision. In 7.3, Canvas releases three new templates: Summary, Pitch, and Status.
- The Summary template can help you create a report with live representations of your data.
- Pitch is a 14-page template that you can brand and customize for your next board-level presentation.
- The Status template gives you a solid, professional, and clean template for status reports and other updates.
Experiences
Canvas adds a number of experiences in 7.3: nudge, alignment, distribution, zoom, and fit to screen. Nudge enables you to more precisely align elements in your workpad. Use the up, down, left, or right arrow key to nudge an element by 10 pixels. Use Shift + an arrow key to nudge an element by 1 pixel.
Documentation
Canvas has more documentation for you to peruse. Check out the updated Getting started guide, the new introduction to Canvas workpads, and the improved function reference.
Conclusion
Kibana 7.3.0 is now available, and includes many more updates than listed above. We tried to pick a few select updates. Please read our Kibana 7.3.0 release notes for more information about the release. You can also download Kibana 7.3.0, try it out, and let us know what you think on Twitter (@elastic), or in our Kibana forums. As you experience Kibana, you can report any problems on the Kibana GitHub issues page.