Elastic APM GA released
If you are an Opbeat customer and need help, please contact us.
We're excited to announce that Elastic APM is generally available as part of the 6.2 release of the Elastic Stack! This is the fruit of months of hard work since Opbeat joined forces with Elastic in May 2017.
Elastic APM gives you application-level performance insights, enabling you to see how your code is performing in production and debug issues much faster. With your APM data stored as an Elasticsearch index, you'll be able to effortlessly correlate your APM data with logs & metrics collected via Logstash and Beats metrics.
Join us for the Elastic APM webinar on February 8th for an overview and live demo of Elastic APM.
Getting started
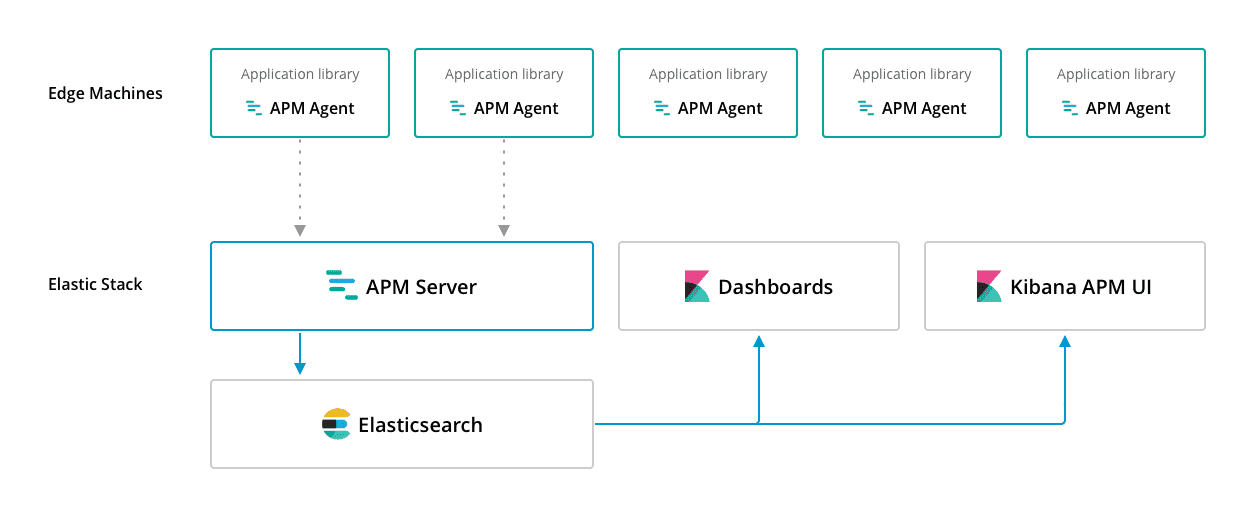
APM consists of three components: The server, agents and the UI. The server and the agents are open-source. The UI is in X-Pack Basic. Here's how it works:

Adding the APM agents to your applications is easy and requires just a few lines of code. Once the server and agents are installed, you can navigate to the new, dedicated APM app inside Kibana and dive into the performance data. You can also use the customizable, pre-configured dashboards that comes with the server.
Here's a sneak peek at the APM UI in action:

Improvements and new agents
Besides ironing out bugs and making improvements to the server and agents, we've added a bunch of new features in 6.2. Amongst them are: Support for unhandled errors, statements on database spans, log messages and log stack traces, and basic sampling support.
Elastic APM currently supports Node.js and Python, but we've been hard at work on adding support for more languages and frameworks. In 6.2 we've included experimental agents for two new languages: Ruby and JavaScript!
Breaking changes
If you've been testing the alpha or beta release, please be aware that upgrading to GA in 6.2 will introduce some breaking changes. See our changelog for more details, and, as always, if you have any questions or comments, please let us know on our Discuss forum.