Using the Elastic Stack to Monitor CitiGroup’s Centralized Database
This post is a recap of a community talk given at Elastic{ON} 2018. Interested in seeing more talks like this? Check out the conference archive or find out when Elastic{ON} Tour is coming to a city near you.
With a physical presence in over 100 countries and clients in more than 160, CitiGroup has a large, global production infrastructure of business application teams. They face several IT challenges due to their business size and complex infrastructure. Scaling, business resiliency, IT agility, asset utilization, IT tooling, and new technologies have all put pressure on CitiGroup’s IT teams to do things faster(and at a lower cost).
IT tooling between teams has proven to be one of the biggest challenges CitiGroup has had to face. Every team needs to adapt to new business trends like automating software deployments, new deployment environments, and moving from single- to multi-purpose tools. In addition to the immense technical challenges, the CitiGroup IT teams must answer to CitiGroup senior management, who increasingly want to know more about the utilization and business benefits of the tools within their IT infrastructure.
To create oversight, CitiGroup needed a lot of data. With data sitting in various pools across different teams (and often countries), the IT teams were incapable of creating an end-to-end infrastructure monitoring picture that could be used by Citi Management to improve tooling, infrastructure health, and operations. So they set out to create an integrated monitoring system that could track and monitor current and new tooling performance throughout their stack and deliver easy-to-understand reports about said performance to management.
CitiGroup needed an integrated monitoring system that could do all of the following:
- Act as a centralized data store
- Configure agents
- Reduce tool licensing support costs
- Unify and centralize data governance
Developing with the Elastic Stack
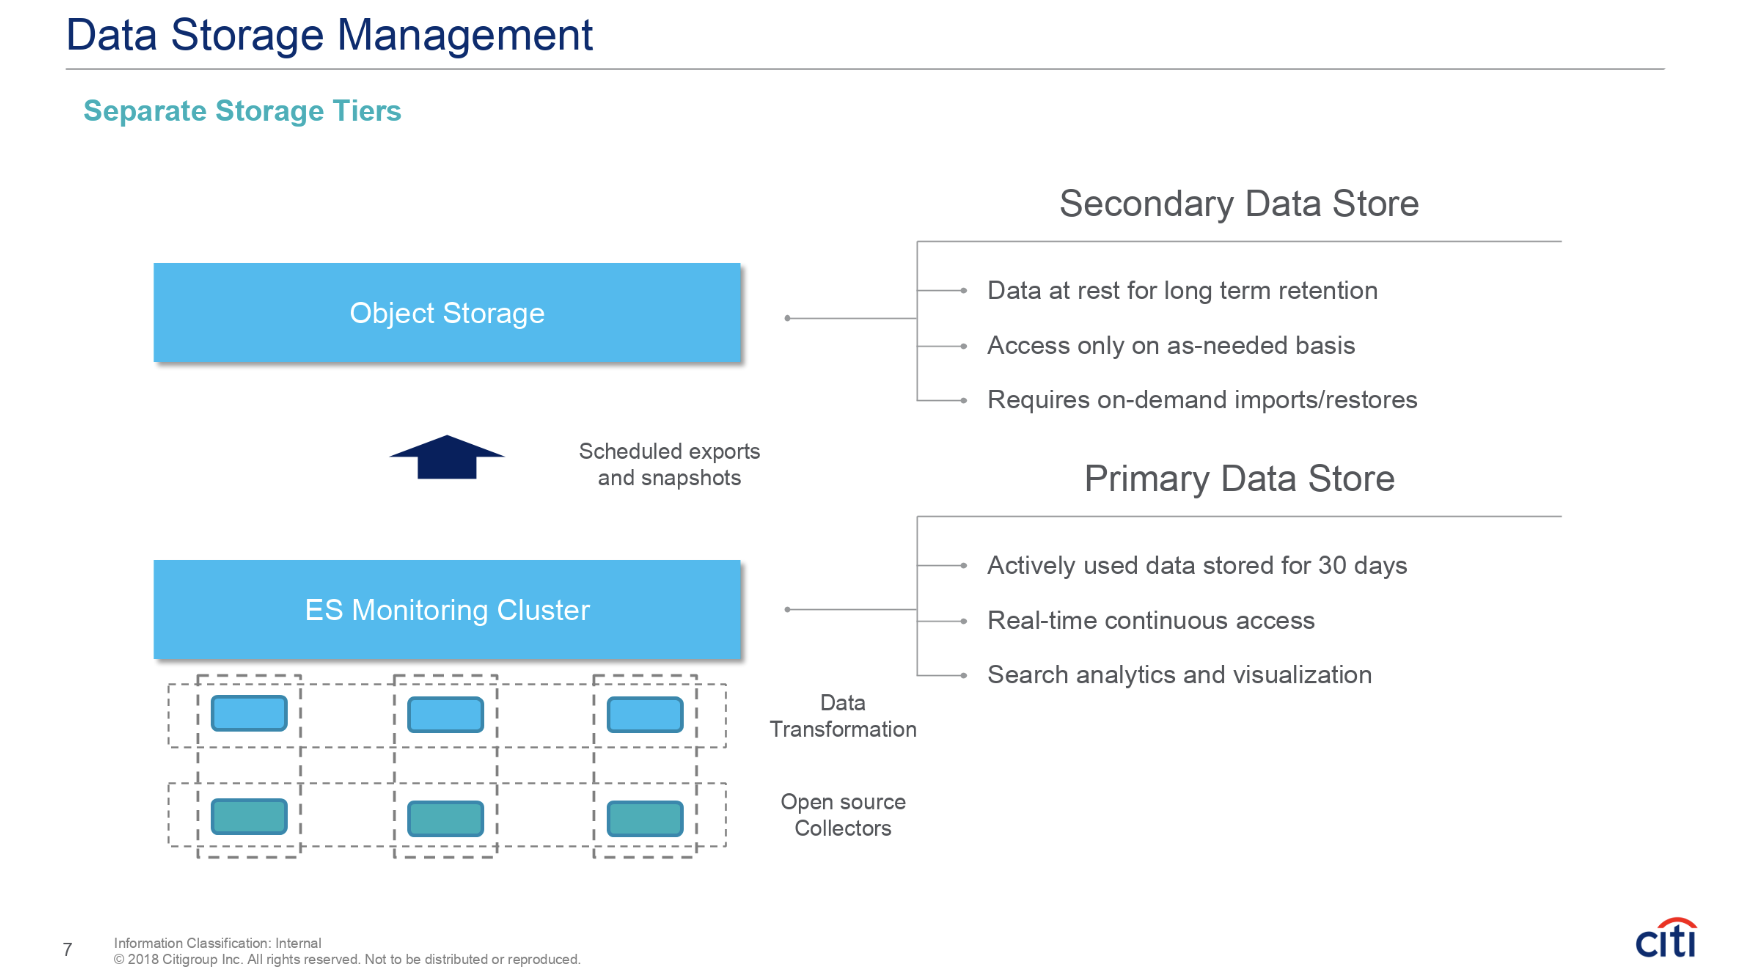
CitiGroup turned to the Elastic Stack because the IT teams saw that advanced search analytics would play a large role in setting up the kind of architecture they needed. For example, the infrastructure needed to ingest metrics, events, and logs (about 90 million documents a day across the entire bank) just to monitor tool performance. Elasticsearch offered an easy way to bring all this data into one place, store it, and make it searchable. Using Elasticsearch, CitiGroup developed an active, primary data storage cluster that would hold information for 30 days for search and visualization purposes. Once the data aged beyond 30 days, Elasticsearch was used to export the data using automated snapshots to low-cost, on-prem object storage.
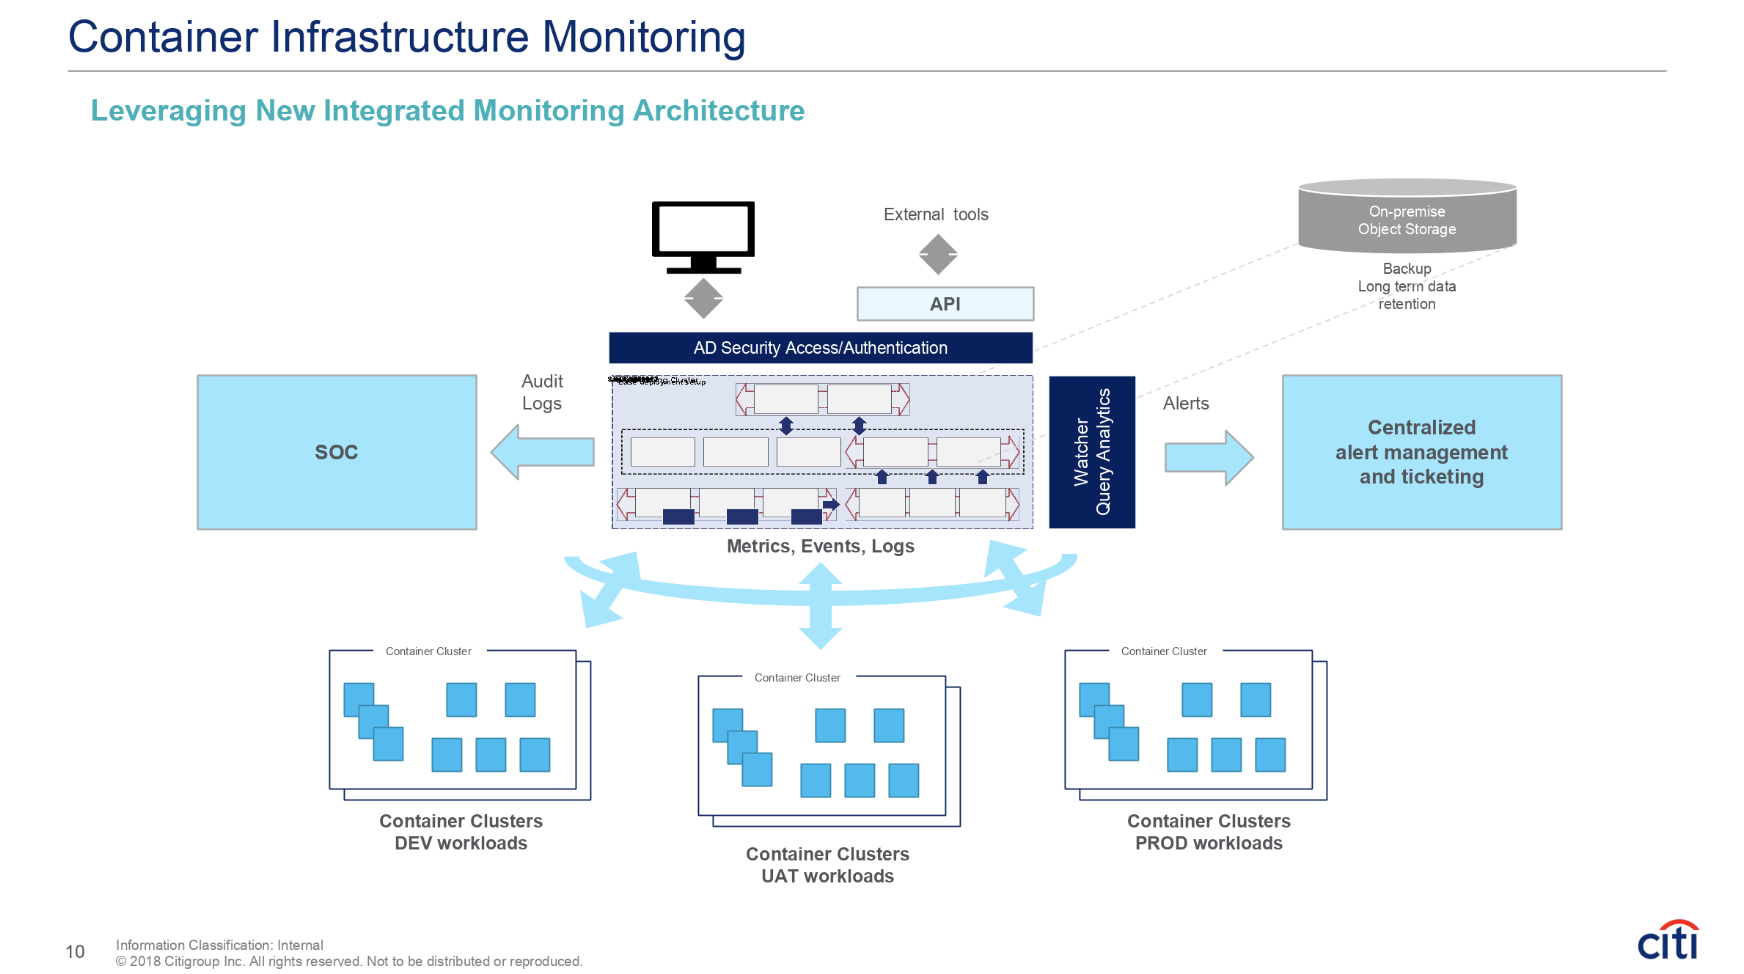
CitiGroup also needed a way to design indices for SOC and audit finding, along with various use cases and levels of access. Elasticsearch allowed their IT teams to group data, provide standardized naming schemes, and define role-based access control and authentication for data governance. Elasticsearch also allowed IT teams and management at CitiGroup to easily access data for analysis and go beyond the standard dashboard with the help of in-house APIs that gave business teams the power to call the API, retrieve data, and push it to local systems for further analysis by different departments.
By setting up container infrastructure monitoring using alerting (formerly called Watcher), CitiGroup was also able to develop a system that collects container metrics, events, and logs that touch every department, rather than limiting their monitoring to the activities of only one team. This information is used for a variety of uses cases including audit finding, alert management and ticketing, and more.
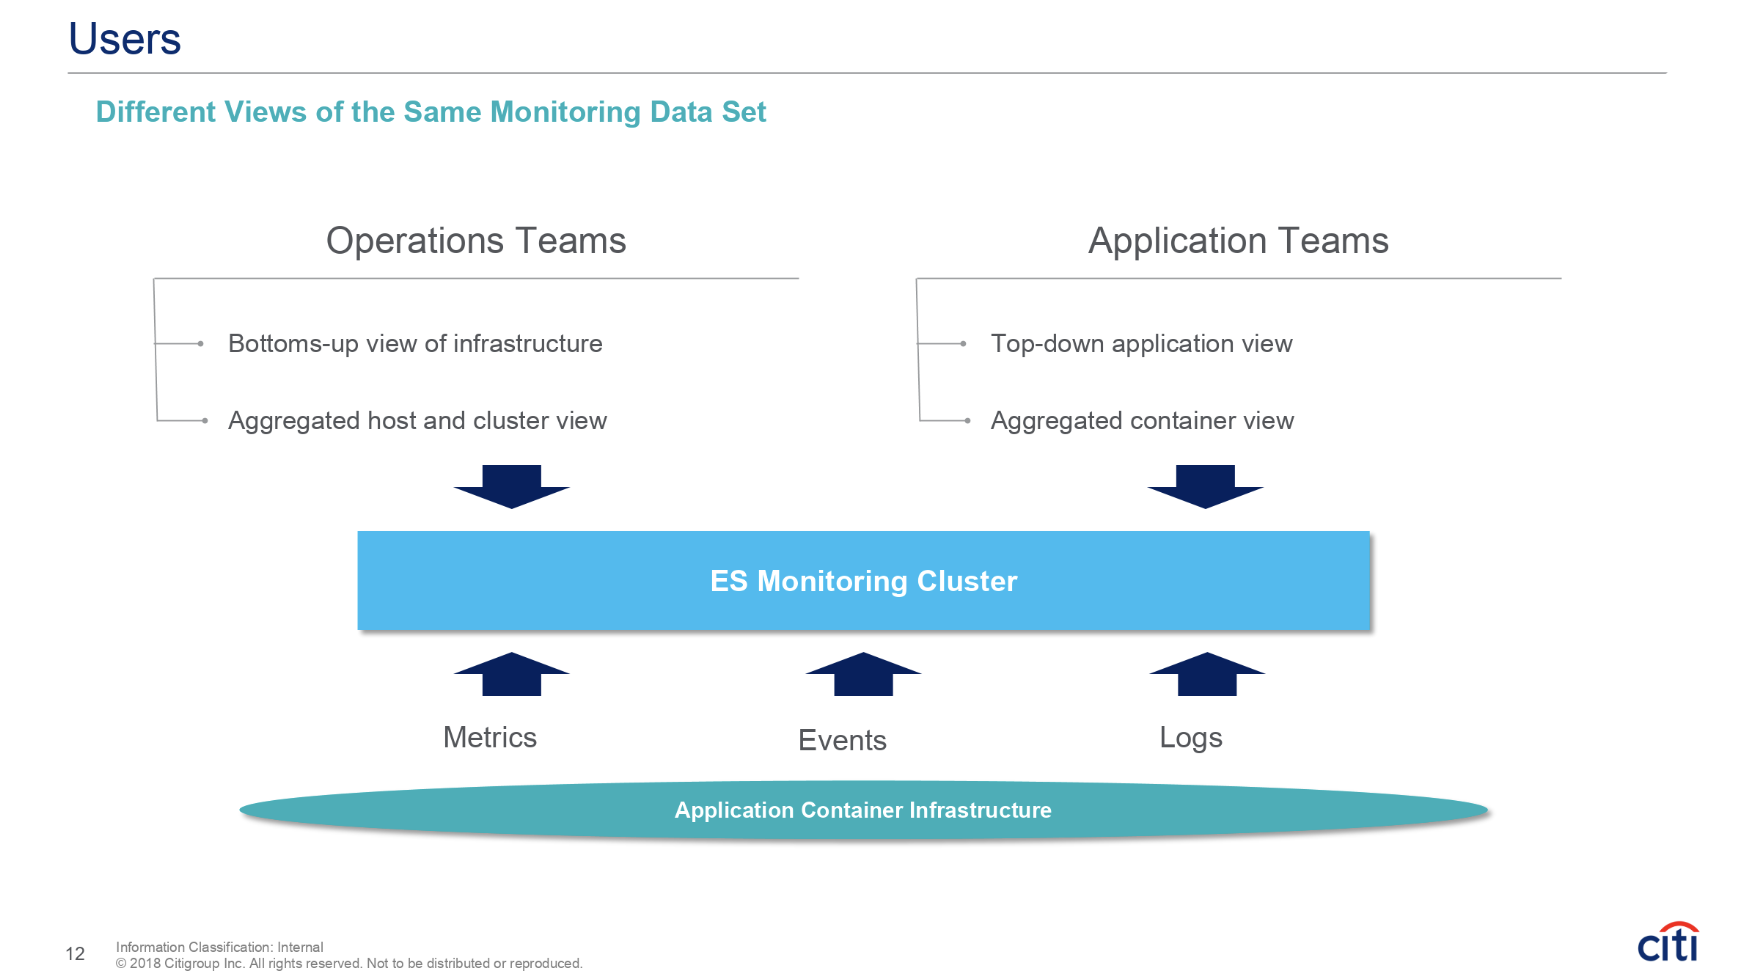
Along with monitoring needs, the IT teams at CitiGroup needed a scalable and secure way to share findings with different user groups (including management). Using Kibana, they have been able to create a dashboard that provides aggregated views of an application’s health in real time, individual views of metrics and logs, and container resource usage and topology information. Users can also drill down into an application or container to discover issues at their source. Operational and application teams can flip the way they look at the data, getting the top-down or bottom-up view they require for monitoring tooling performance and running reports that give an overview of their tool’s effectiveness in the real world.
Want to see how CitiGroup is leveraging advanced search analytics to support infrastructure monitoring at Citigroup? Watch the full Elastic{ON} talk, Application Infrastructure Monitoring at Citigroup.
