什么是 Kubernetes 监测?
Kubernetes 监测定义
Kubernetes 监测是一种报告系统,可帮助 DevOps 和 IT 团队识别问题,进而先发制人,积极主动地管理复杂的 Kubernete 集群。通过有效的 Kubernetes 监测,可实现对整个容器化基础架构的实时管理。它不仅能够跟踪运行时间和集群资源利用率,如内存、CPU 和存储,同时还可跟踪集群组件的交互。
借助 Kubernetes 监测,集群运营商可监测功能的运行情况。当所需数量的 pod 未在运行时、当资源利用率接近临界限值时,以及当 pod 或节点由于故障或配置错误而无法加入集群时,Kubernetes 监测都会实时进行报告。
通过 Kubernetes 监测,可让您深入了解集群的内部运行状况、资源计数和性能指标。此外,它还可让您通过预先告警和基于 Machine Learning 的异常检测,快速发现并解决问题。请进一步了解合适的 Kubernetes 监测工具,看一看怎样通过查看这些工具以统一视角生成的日志、指标和痕迹,帮助您洞悉 Kubernetes 集群以及在这些集群上运行的应用程序的状态和运行状况。
什么是 Kubernetes?
Kubernetes (K8s) 是一个开源容器编排系统,用于在软件部署、扩展和管理容器化应用程序方面实现自动化操作。该项目最初由 Google 于 2014 年开发,现在由云原生计算基金会 (CNCF) 维护。Kubernetes 消除了管理容器化应用程序所涉及的许多手动过程。容器编排可将各个容器组合成一个高度结合、协调一致的整体。
Kubernetes 可以部署在各种云平台以及自管型系统上,以提高 IT 和 DevOps 团队的效率。许多云服务提供商(如 AWS、Google 和 Azure)还为他们的用户提供了某种形式的托管 Kubernetes 服务。通过跨多个主机编排容器,Kubernetes 可让您:
- 充分利用运行应用所需的资源
- 实现应用程序部署和更新自动化
- 快速扩展容器化应用程序
- 管理服务以保证应用程序按预期运行
为什么监测 Kubernetes 很重要?
Kubernetes 监测会涉及许多较小的组件,例如主机、容器、容器化应用和您的 Kubernetes 平台本身。当出现问题时,很难找出原因。适当的 Kubernetes 监测则可让您看到发生问题或即将发生问题的地方,并采取行动。
此外,Kubernetes 监测解决方案还可以针对集群、部署、pod、节点和容器提供可用作行动依据的报告和见解。您还可以配置告警,以确保团队能够对任何安全或性能事件做出快速响应。根据所获得的数据,您可以优化集群的运行状况、性能和安全配置,从而提高资源利用率和降低成本。
借助 Kubernetes 监测,您可以:
- 确保团队或应用程序以最佳方式使用资源
- 当新节点加入集群时自动利用新资源
- 当主机停机时将工作负载重新部署到可用节点
- 更高效地配置更新和回滚
Kubernetes 监测方法
要监测 Kubernetes,您需要具备以下条件:
- 有一个在集群中运行的指标服务器
- 已开启 kube-state-metrics
- 已部署收集机制
- 可以处理 Kubernetes 指标和日志的 Kubernetes 监测工具
为了全面了解您的整个环境,需要有全面的可观测性工具来监测 Kubernetes 数据以及应用程序痕迹、指标和日志。 - 已部署用于收集指标和日志的代理
许多 Kubernetes 监测解决方案都会使用 DaemonSet 方法,因为它们相对容易配置。DaemonSet 是一个专用 pod,用以确保其工作负载的一个副本在集群中的所有节点上运行。开发人员可以创建 DaemonSet,用于在集群中的每个节点上运行监测代理,以收集性能指标。
Kubernetes 监测用例的关键指标是什么?
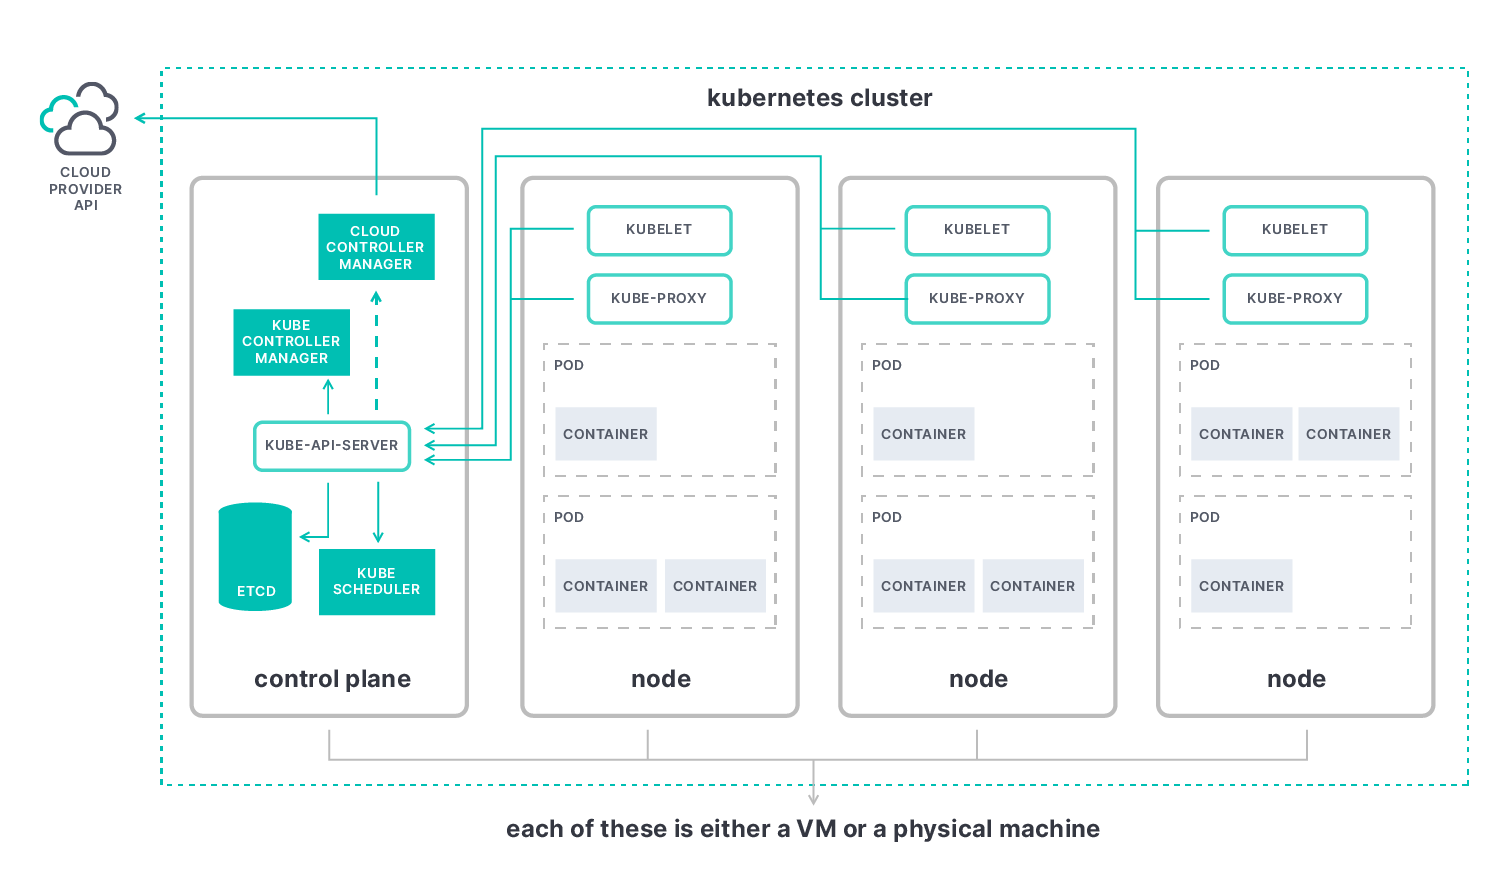
Kubernetes 监测的关键指标包括控制平面、节点、pod 和容器。
- Kubernetes 控制平面指标有助于您了解集群的整体性能,其核心是 kube-apiserver,可让您观测以下元素:
- Etcd:一个兼具一致性和高可用性的键值存储,可用作 Kubernetes 所有集群数据的后台存储。
- Kube-scheduler:一个调度进程,用于通过将新 pod 添加到队列,以在将它们绑定到适当节点之前评估每个可用节点,然后再决定放置新 pod 的位置。
- Kube-controller-manager:一个组件,用于将所有控制器组合成一个进程,并将它们一起运行来降低复杂性。
- Cloud-controller-manager:一个控制器,用于与云服务提供商资源交互并允许您将集群链接到云服务提供商的 API。
- Kubernetes 节点指标用于监测您的整个 Kubernetes 集群的性能。其中包括所用资源的数量、每个节点上运行的应用程序的数量,以及节点是否在正常工作。查找节点资源使用情况指标,如磁盘和内存利用率、CPU 和网络带宽。每个节点都包含以下元素:
- Kubelet:一个代理,在集群中的每个节点上运行,用于确保各个容器在一个 pod 中运行。
- Kube-proxy:一个网络代理,在集群中的每个节点上运行,是实现 Kubernetes 服务概念的一部分。
- 容器运行时:一种运行容器的软件,也称为容器引擎。
- Kubernetes 容器指标可让您对比所配置的资源限制来评估各项指标当前所处的状态,例如针对容器 CPU 使用率、容器内存利用率和网络使用率的指标。
- Kubernetes pod 指标可让您了解部署中的所有 pod 是否都在正常运行。通过这些应用程序指标,您可以了解在 Kubernetes pod 中运行的应用程序的性能和可用性,例如运行时间和响应时间、响应速度和延迟等元素。
Kubernetes 监测所带来的挑战
将传统应用程序迁移到 Kubernetes 可能会非常耗时。尽管 Kubernetes 可以简化容器中和跨云的应用程序部署,但其复杂性仍会带来它所特有的一系列挑战。
Kubernetes 容器编排提供了动态的自动化功能。因此,它需要同样动态的监测系统来检查各个组件并启用告警。对于在动态容器化环境中运行的应用程序,其在监测方面带来的一项独特挑战就是它们的复杂性。数以千计的容器在临时的一次性 pod 中运行,这些容器中又有数百个微服务,如何诊断和解决这些服务的问题呢?
Kubernetes 监测最佳实践
无论您的节点是在同一位置、跨云还是在混合云中部署,Kubernetes 监测的最佳实践都是一致的。在整个集群中,指标收集都应该以相同的方式进行。以下是在 Kubernetes 监测中需要考虑的一些有用的最佳实践:
- 使用命名空间来组织集群,简化容器管理,并将风险降至最低。
- 升级至最新版本的 Kubernetes,以获得新功能、故障修复和安全补丁。
- 通过设置自动监测来理解 Kubernetes 告警。
- 设置基于角色的访问控制 (RBAC),以管理用户和服务帐户的许可和访问权限。
- 为集群管理员设置推送通知,并明确负责解决特定问题的团队。
- 使用标签来组织集群,以及定义和管理对象。
- 通过设置一个基于 Git 的简化工作流来减少错误。
最成功的 Kubernetes 监测解决方案可满足以下要求:
- 监测技术堆栈的所有层。所有主机系统(集群中的 Kubernetes 核心组件、节点、pod 和容器)以及所有应用程序和服务都应该进行跟踪。
- 在服务动态出现时自动对它们进行检测和监测。
- 提供一种收集和关联数据的方法,以便您对相关指标、日志、痕迹和其他可观测性数据进行分组和探索。
- 与 Prometheus 和 OpenTelemetry 等开放标准集成,以收集额外的指标。
以下是一些围绕如何使用 Elasticsearch 和 OpenTelemetry 观测 Kubernetes 上的应用程序和服务工作流并确保其安全的最佳实践。
Kubernetes 与Docker
Kubernetes 与 Docker 的不同之处在于,它可以大规模地操作容器化的应用程序。Docker 是一组软件开发工具,可让您构建、共享和运行各个容器。
Docker 采用客户端服务器架构,通过单个 API 实现简单的命令和自动化。它提供了一种打包和分发容器化应用程序的简单方法。
使用 Docker 构建的容器映像可以在 Kubernetes 或 Docker Swarm 等这类支持容器的平台上运行。Kubernetes 在跨多个服务器和集群来运行、管理、调度和编排大量容器方面要优于 Docker。大多数大型企业更青睐于使用 Kubernetes 来监测环境的运行状况并有效地实现负载均衡。
最重要的是,Kubernetes 提供了一个 API 和命令行工具,可让您实现运维的自动化。Kubectl 可极大简化容器管理。Kubernetes 是一个用于从许多容器运行时(包括 Docker 容器运行时)运行和管理容器的平台。这种自动管理一系列元素的能力使得 Kubernetes 特别灵活。得益于它的可靠性,不仅能节省 IT 团队的时间,同时还可简化您的整体工作流。
Kubernetes 监测仪表板
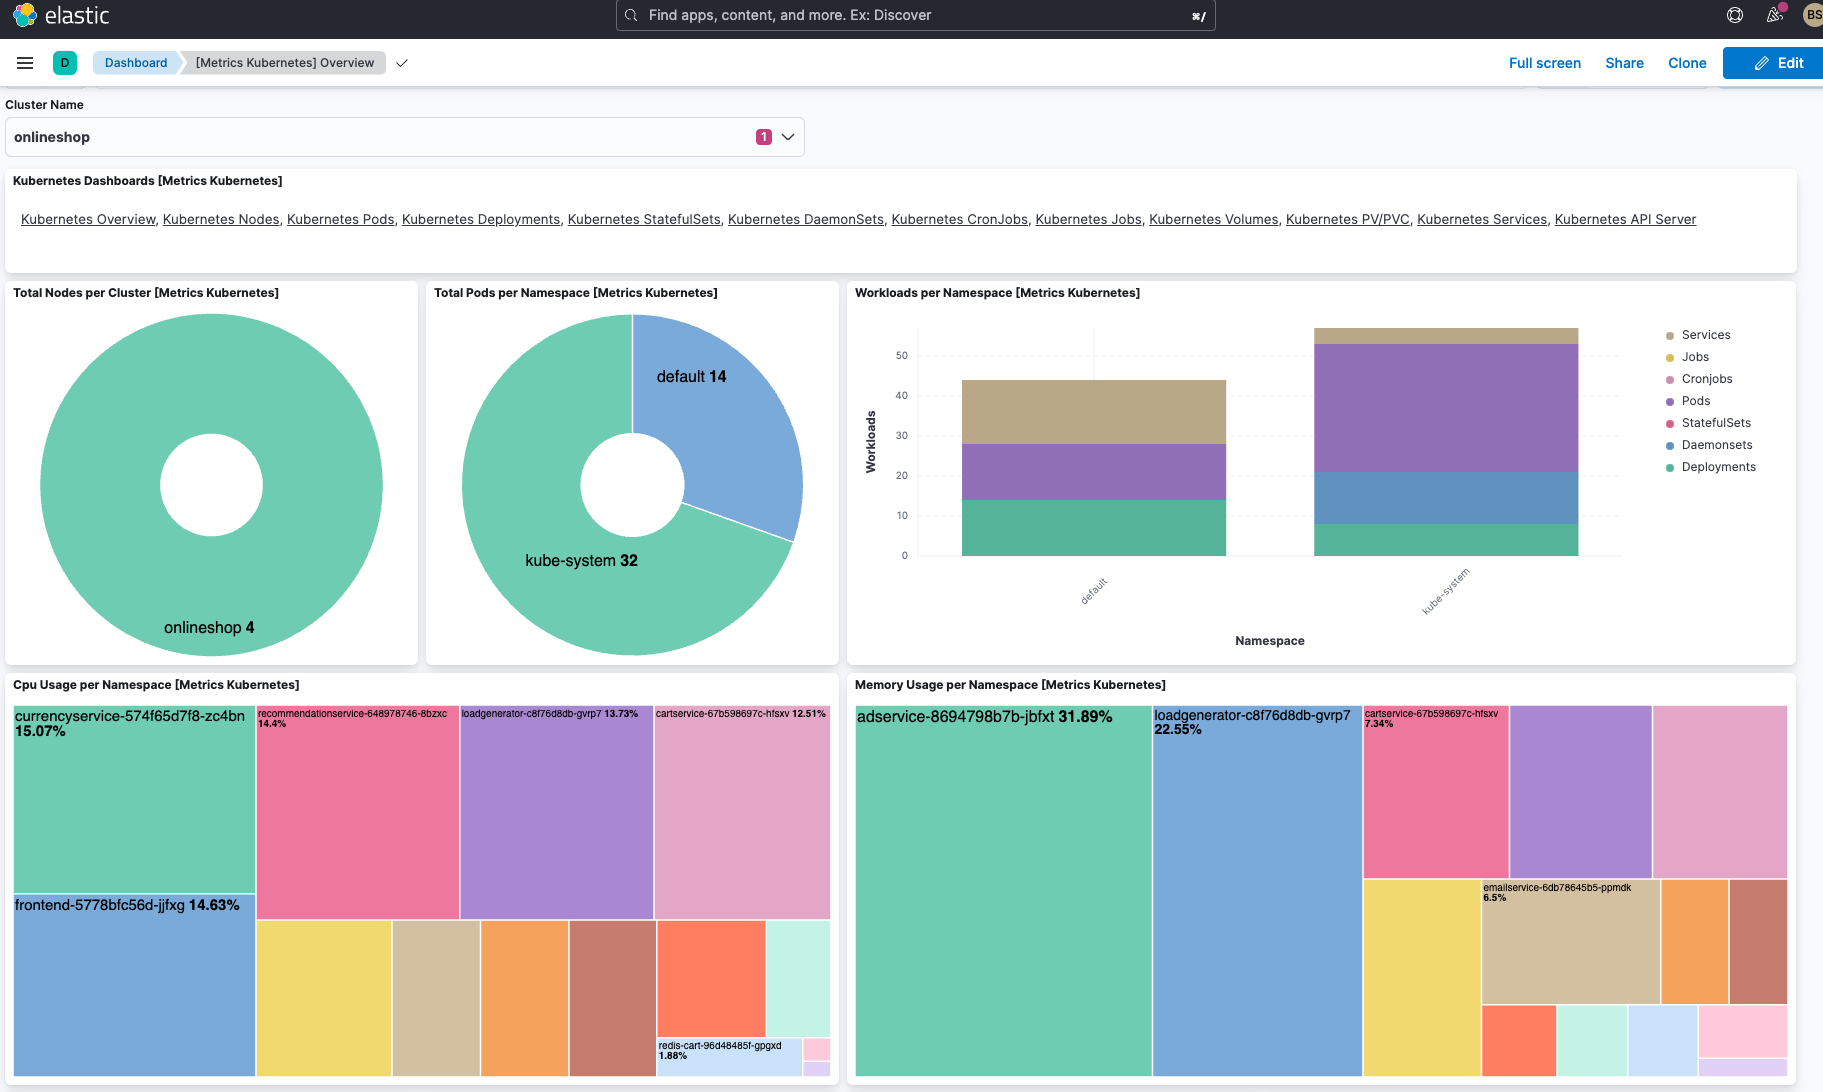
基于 Web 的 Kubernetes 有一个简洁明了的仪表板,可以全方位整体了解各个集群和跨集群的资源和节点调度情况。这是一种部署容器化应用程序、管理资源和进行故障排查的简单方法。
如下图所示,Elastic 的开箱即用型仪表板包括了集群的所有命名空间和定义的存储类。其中还概要列出了所有节点、命名空间和持久性存储卷,并提供了详细、聚合的节点指标。
您可以看到每个集群应用程序的持久性卷声明,以及集群中运行的所有 Kubernetes 资源的完整视图。它还显示了所选命名空间中运行的每个应用程序、当前 pod 内存使用情况,以及针对一项部署或 ReplicaSet 的就绪 pod 的数量。
使用 Elastic 监测 Kubernetes
使用 Elastic 可观测性,您可以将 Kubernetes 集群中的日志、指标和痕迹以及在集群上运行的工作负载全部整合到一个一体化的平台之上,从而让您能够有效识别应用程序服务的问题。Kubernetes 集群的指标和日志可以与 Elastic 的基于 Machine Learning 的异常检测结合使用,以缩短分析数据的时间。
Elastic 的 Kubernetes 监测解决方案通过一系列出色的功能,可让您实时了解 Kubernetes 生态系统。借助基于 Elastic Stack 构建而成的可观测性解决方案,您可以顺畅地部署和操作 Kubernetes 架构。通过在单个视图中大规模统一日志、指标和 APM 痕迹,您可以有效地管理高度分布式云原生应用程序的复杂性。您还可以为云原生技术堆栈和云监测获得行之有效的可观测性。这使您能够主动检测和解决庞杂的混合和多云生态系统中的问题。
Kubernetes 监测词汇表
以下是一些关键的 Kubernetes 术语供您参考。
集群
一组工作机器,称为节点,用于运行容器化的应用程序。每个集群都至少有一个工作节点。
节点
节点是 Kubernetes 中的工作机器。
- 主(节点)
旧版术语,用作托管控制平面的节点的同义词。 - 工作(节点)
工作节点托管作为应用程序工作负载组件的 pod。
Pod
最小且最简单的 Kubernetes 对象。pod 表示集群上一组正在运行的容器
容器
一个轻量级且可移植的可执行映像,包含其中的软件及其所有依赖项
控制器
在 Kubernetes 中,控制器是监视集群状态,然后根据需要进行更改或请求更改的控制循环。每个控制器都会尝试将当前集群状态移动到更接近所需的状态。
Kubelet
一个代理,在集群中的每个节点上运行,用于确保容器在一个 pod 中运行。
Kube-proxy
一个网络代理,在集群中的每个节点上运行,是实现 Kubernetes 服务概念的一部分。
Etcd
一个兼具一致性和高可用性的键值存储,可用作 Kubernetes 所有集群数据的后台存储。
入口
一个 API 对象,用于管理对集群中服务(通常是 HTTP)的外部访问权限。入口可以提供负载均衡、SSL 终止和基于名称的虚拟托管。