How to monitor Amazon ECS with Elastic Observability
With an increasing number of organizations migrating their applications and workloads to containers, the ability to monitor and track container health and usage is more critical than ever. Many teams are already using the Metricbeat docker module to collect Docker container monitoring data so it can be stored and analyzed in Elasticsearch for further analysis. But what happens when users are using Amazon Elastic Container Service (Amazon ECS)? Can Metricbeat still be used to monitor Amazon ECS? Yes!
In this blog, we will lead you step by step through how to monitor Amazon ECS with Elastic Observability!
What is Amazon ECS?
Amazon ECS is a highly scalable, fully managed service that makes it easy to orchestrate and provision Docker containers. It is backed by two different underlying cloud services called “launch types” that determine how the compute resources will be managed: EC2 and Fargate.
When using the EC2 launch type, containers run on EC2 instances that users have to manage themselves. When using the alternate Fargate launch type instead, users only need to specify containers and tasks. Fargate will then take care of provisioning, configuring, and managing the backend infrastructure.
Let’s look at how to monitor each launch type with Metricbeat!
How to monitor Amazon ECS EC2 containers with Elastic
When deploying containers on EC2, users are responsible for deploying and managing their own Amazon ECS cluster. From a monitoring perspective, these EC2 instances are like any other normal VM, which means that users can connect to them and collect Docker statistics from the Docker daemon directly. Let’s see how we can monitor our Amazon ECS containers running on EC2 in a few simple steps:
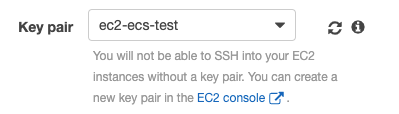
Prerequisite: SSL key
When creating your Amazon ECS cluster, make sure you attach a valid SSL key so the instances are accessible via SSH:
Step 1: Security group
In the networking section make sure you select a Security group that will allow you to enable SSH access (port 22):

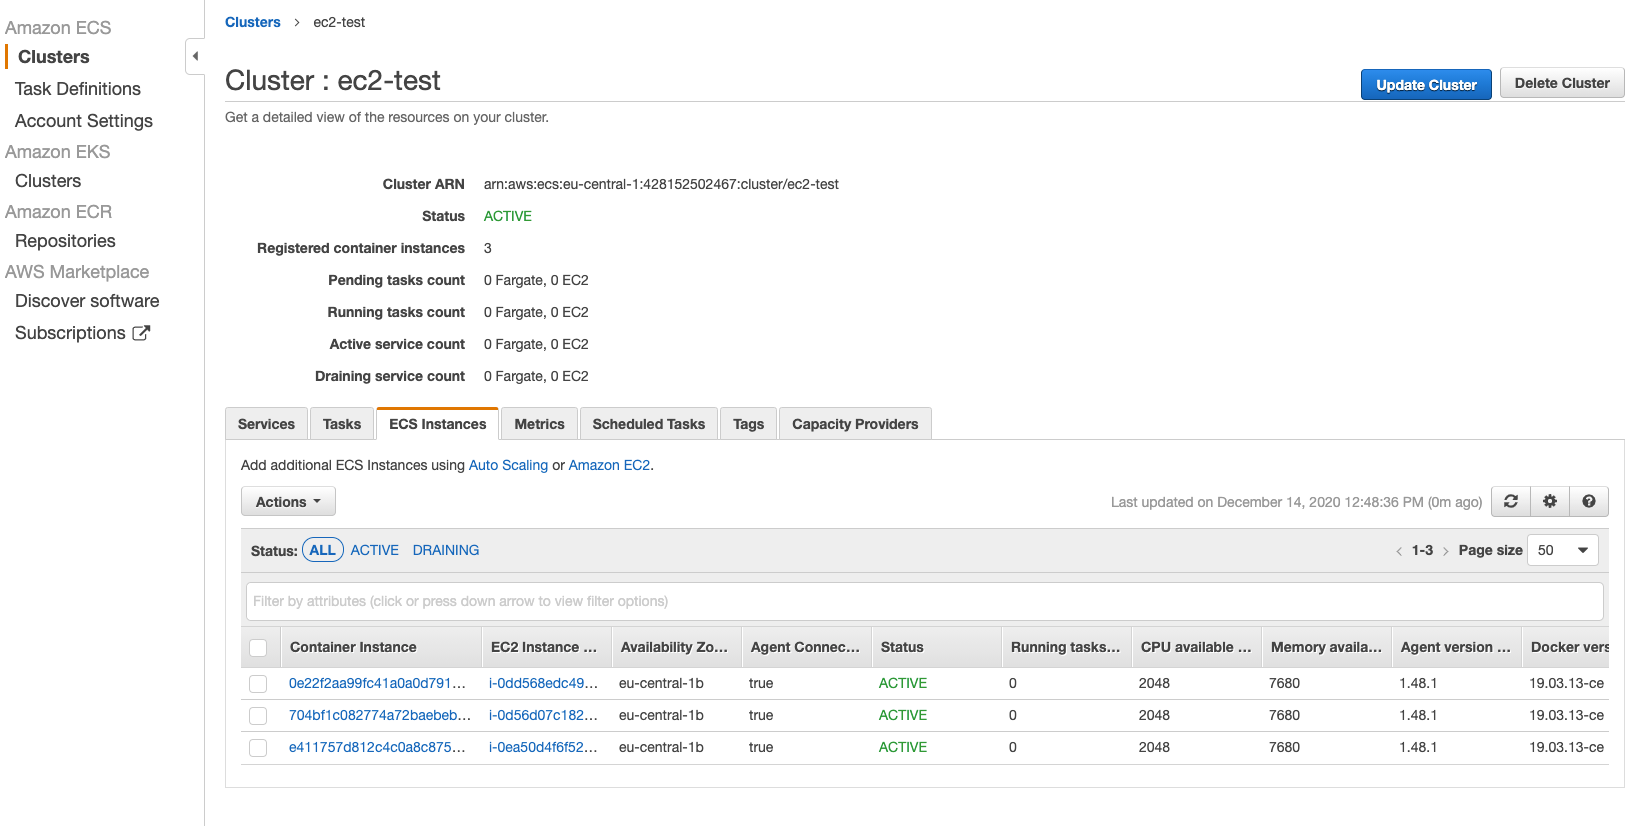
Step 2: Verify EC2 instance
After you have properly launched the Amazon ECS cluster, you should be able to list your EC2 instances:
Step 3: SSL connection
You can connect to each one of them via SSH using the key pair you attached on step 1, for instance:
ssh -i "ec2-ecs-test.pem" ec2-user@3.125.104.129
Step 4: Install Metricbeat
Since you have access to all of the cluster’s instances, you can install Metricbeat on each instance and start collecting metrics from the Docker daemon:
curl -L -O <a href="https://artifacts.elastic.co/downloads/beats/metricbeat/metricbeat-7.11.1-x86_64.rpm">https://artifacts.elastic.co/downloads/beats/metricbeat/metricbeat-7.11.1-x86_64.rpm</a>
sudo rpm -vi metricbeat-7.10.1-x86_64.rpm
sudo metricbeat modules disable system
sudo metricbeat modules enable docker
We can now define the Elasticsearch endpoint to send metrics to — in this case an instance running on Elastic Cloud. You can spin up a free trial if you'd like to follow along.
Edit metricbeat.yml and add Elastic Cloud options:
Usually you will find this file under /etc/metricbeat/metricbeat.yml and you can edit it with:
sudo vi /etc/metricbeat/metricbeat.yml
cloud.id: "elastic-observability-deployment:ZXV…….k3MTI1ZTA1Ng=="
cloud.auth: "elastic:2vXXXXXXXXXXXxxxxxxxxxxxV"
If you’re running a self-managed Elasticsearch cluster, you’ll need to configure the Elasticsearch output:
output.elasticsearch:
  hosts: ["https://myEShost:9200"]
  username: "elastic"
  password: "changeme"
Next, you can set up predefined dashboards, indexes, and mappings:
sudo metricbeat setup -e
Start Metricbeat:
./metricbeat -e -d &
sudo service metricbeat start
You can also configure Metricbeat service to start automatically when the system boots:
systemctl enable metricbeat
| Note: This process must be performed on all EC2 instances of the cluster. |
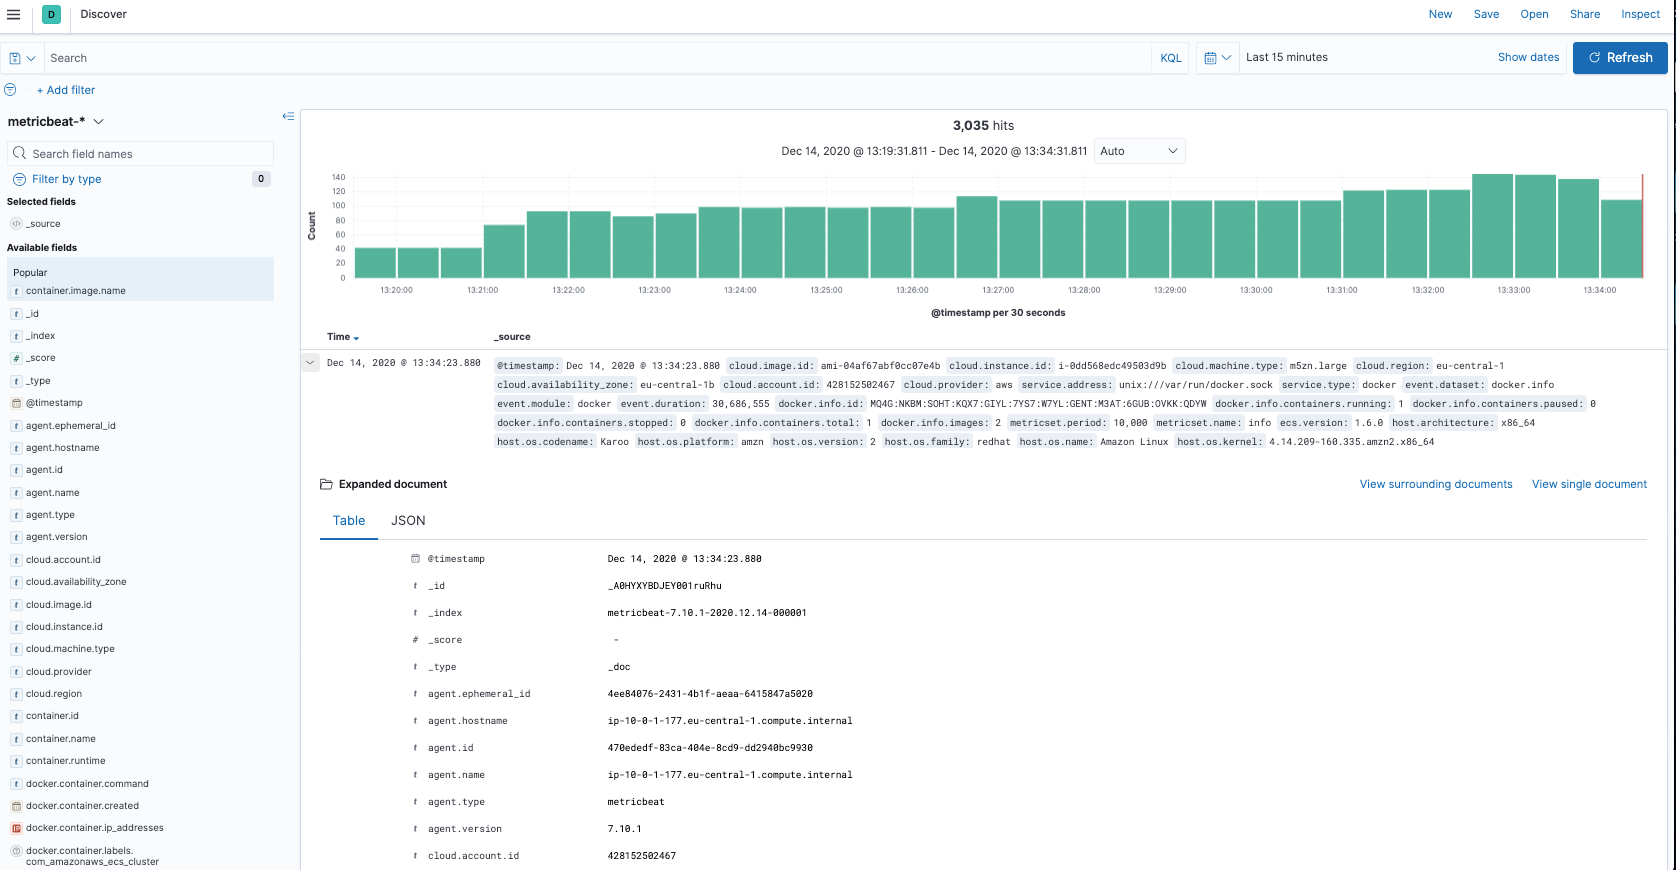
Step 5: Verify metrics collection
Now that Metricbeat is running, we can verify that events are stored into our Elasticsearch cluster by looking at Docker-related metrics in Kibana’s Discover view:
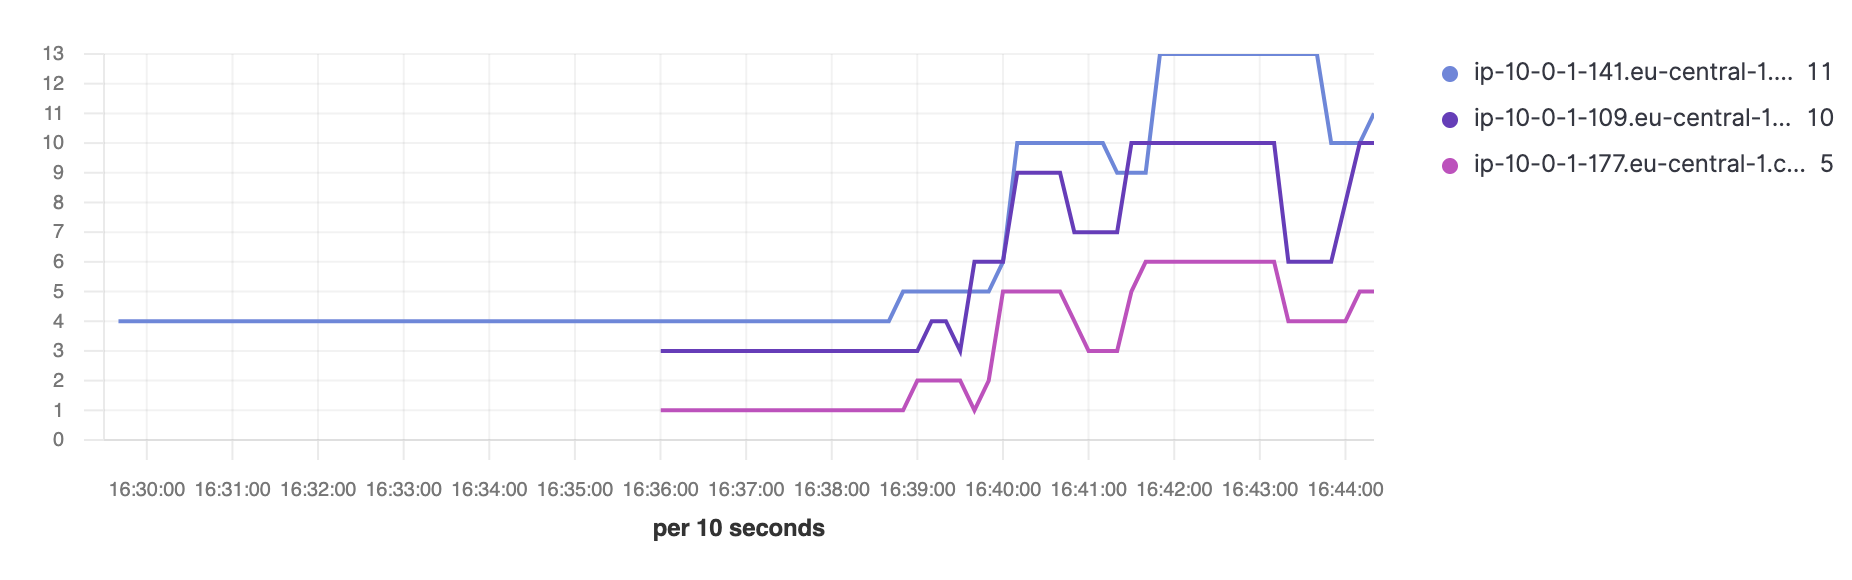
Now we can go on and deploy tasks on our Amazon ECS cluster, and Metricbeat will collect metrics from them. We can use these metrics to create visualizations and dashboards while leveraging additional metadata, such as cloud_metadata and host_metadata, which are added by default in order to correlate metrics per AWS accounts, regions, host identifiers, types, etc. For example, by combining docker.info.containers.running metric with host.name we can provide an overview of how many running containers we have per host over time:
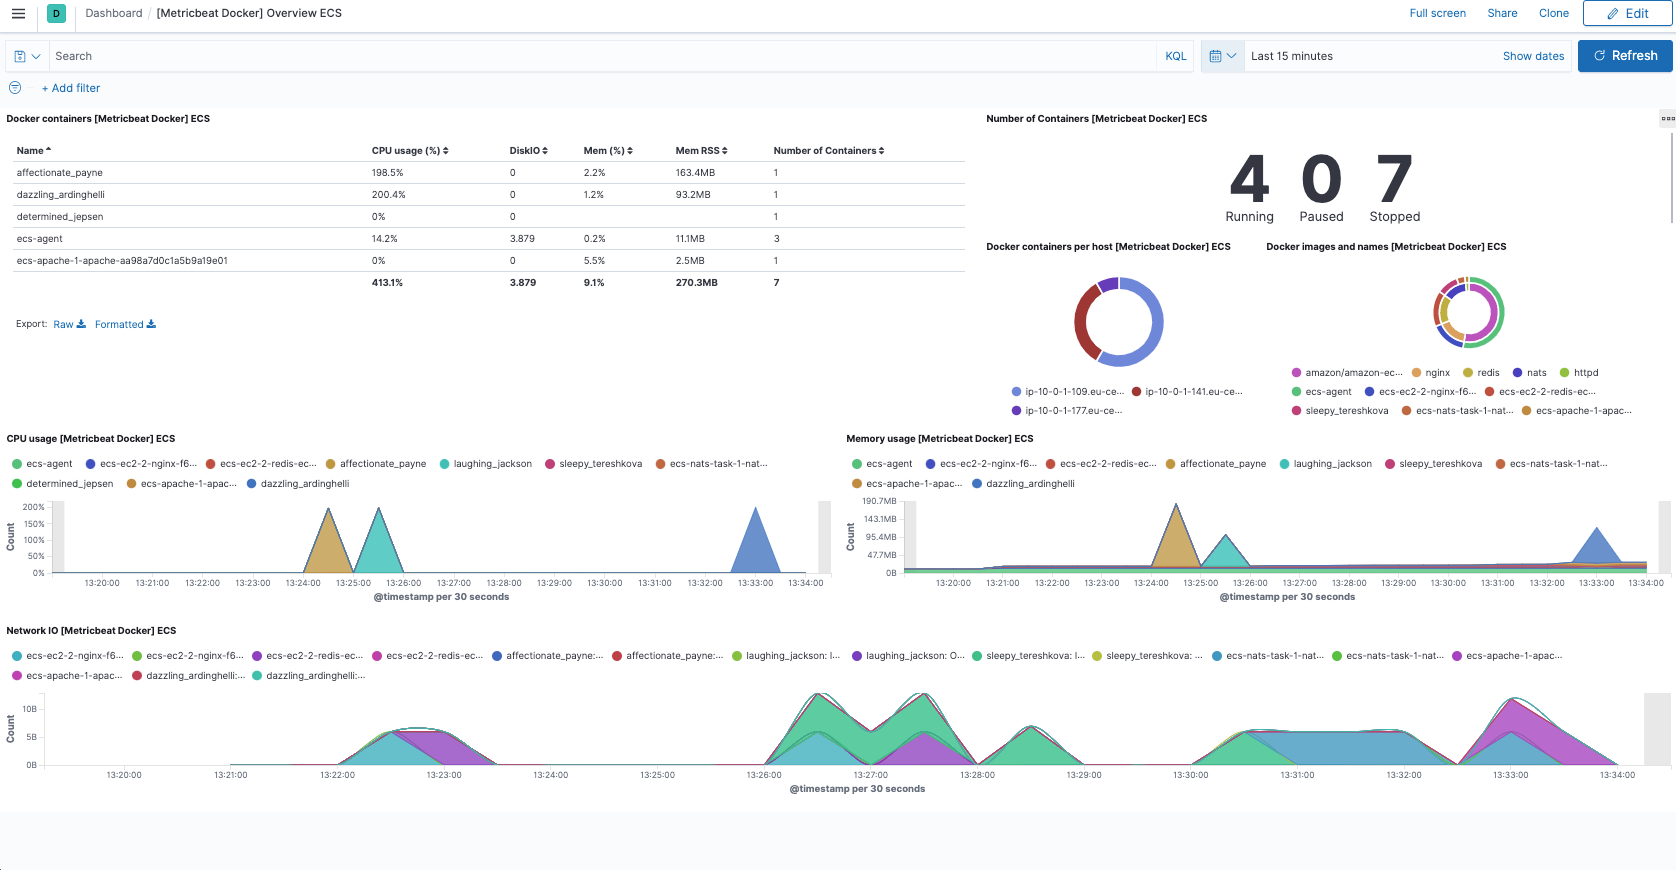
Step 6: View metrics in prebuilt Kibana dashboards
Additionally, we have a nice overview of our container workloads in the default Docker dashboard bundled with Metricbeat:
Monitoring Amazon ECS tasks only takes a few steps, and from there you can keep adding visibility into the EC2 cluster using Metricbeat. Let’s now move forward and see how we can monitor our Amazon ECS tasks when running on Fargate.
How to monitor Fargate containers with Elastic
Amazon ECS on Fargate exposes various metadata, network metrics, and Docker stats about running tasks and containers through the task metadata endpoint. Metricbeat uses version 4 of the task metadata endpoint, which is available per container and enabled by default on AWS Fargate platform version 1.4.0 or later.
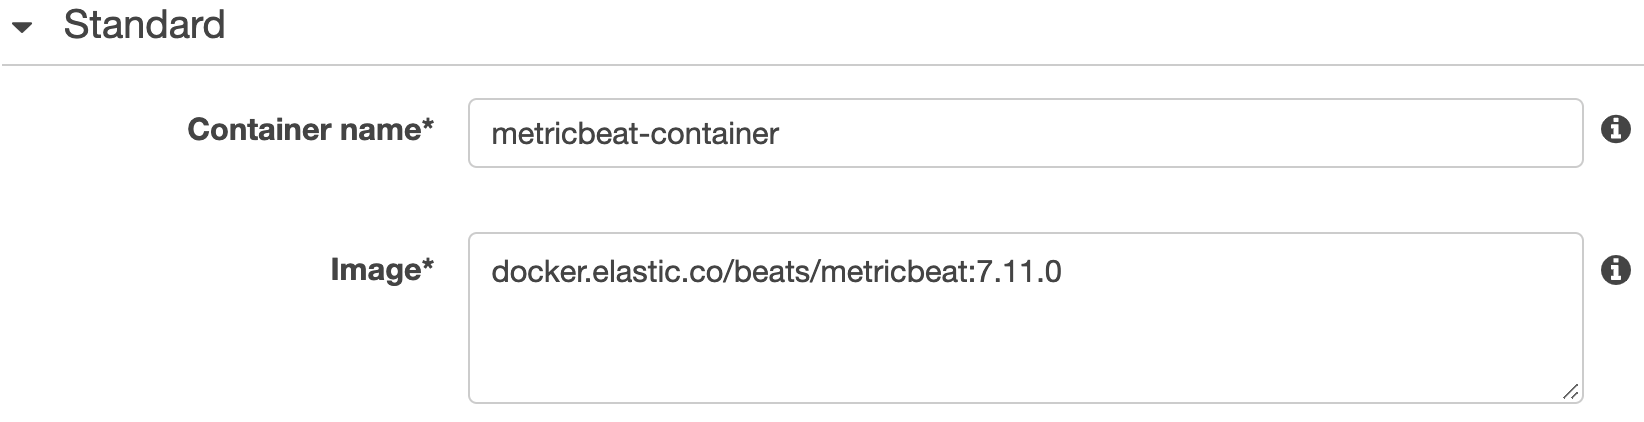
To monitor a task running on Fargate you need to deploy a Metricbeat container onto the task itself by manually adding a new container definition. In the Standard section, you can give a Container name such as metricbeat-container and use the Metricbeat docker image from the Elastic Docker registry docker.elastic.co/beats/metricbeat:7.11.0 for a specific version for Metricbeat image.
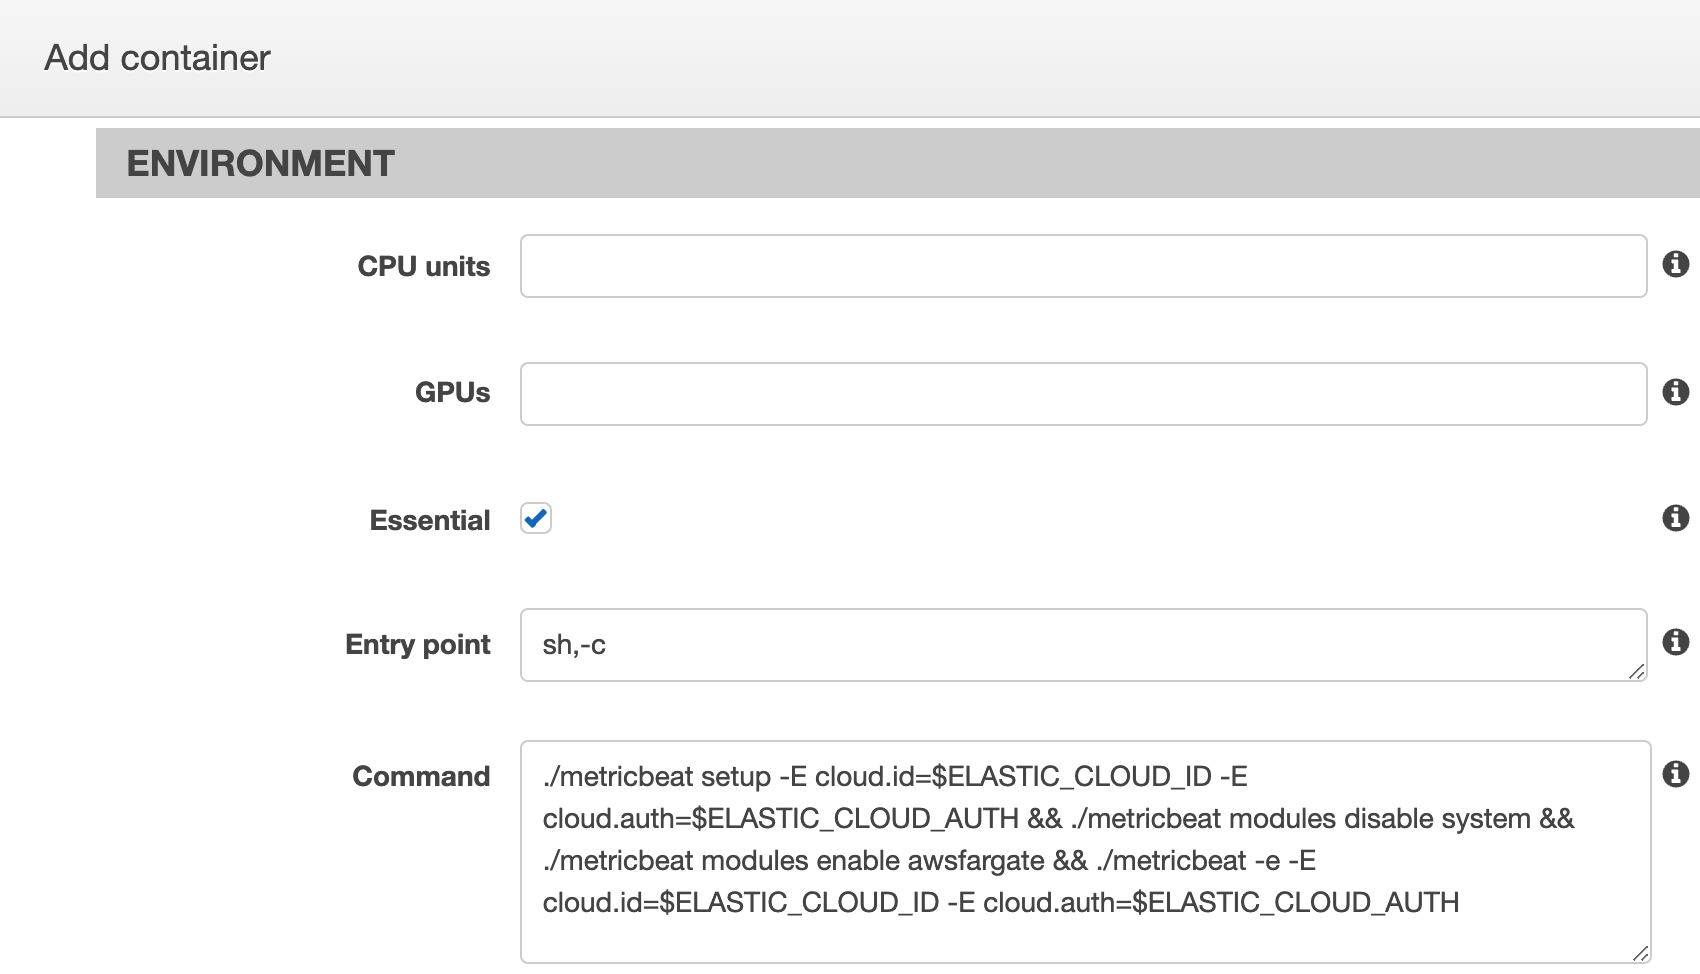
Also we need to add a command for this container to set up and start Metricbeat with sending data to Elastic Cloud:
./metricbeat setup -E cloud.id=$ELASTIC_CLOUD_ID -E cloud.auth=$ELASTIC_CLOUD_AUTH && ./metricbeat modules disable system && ./metricbeat modules enable awsfargate && ./metricbeat -e -E cloud.id=$ELASTIC_CLOUD_ID -E cloud.auth=$ELASTIC_CLOUD_AUTH
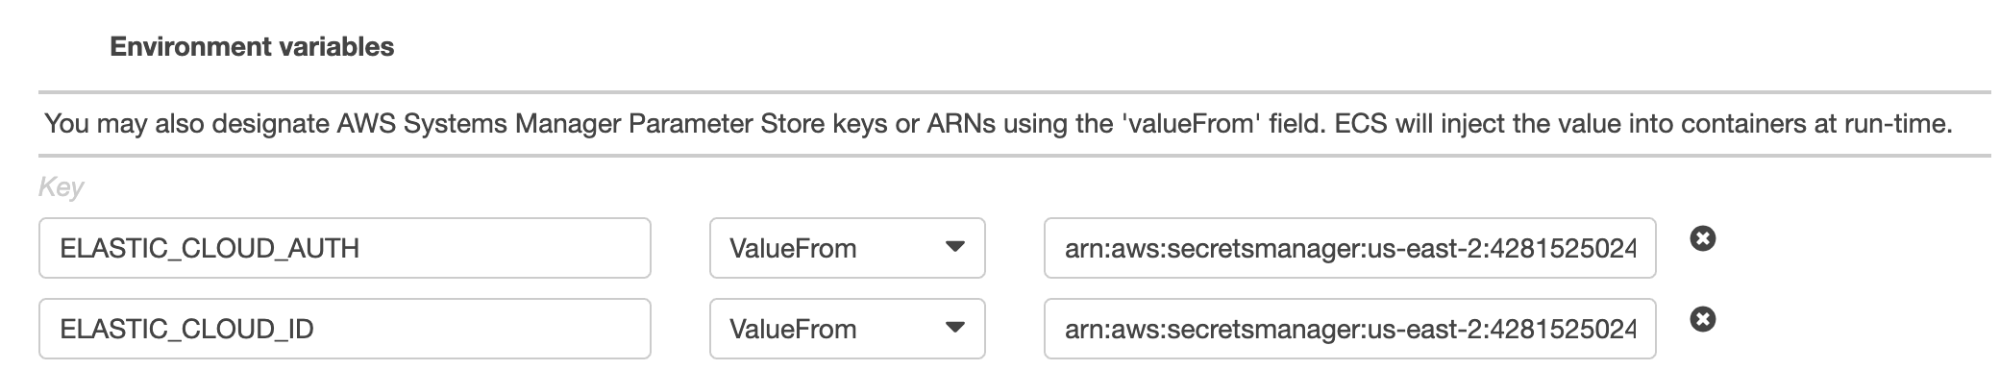
You need to add values for $ELASTIC_CLOUD_ID and $ELASTIC_CLOUD_AUTH in the Environment variables section with the actual credentials, possibly using AWS secret manager to avoid storing these values in plain text:
Once the new task definition revision is created, click run task under the Actions dropdown menu and Metricbeat will be added to the task when it restarts.
If you have more than a few tasks to monitor, manually adding Metricbeat containers can be tedious and time-consuming. In this case we recommend using AWS CloudFormation, an AWS native way to manage resources by provisioning and updating them throughout their life cycle without manual actions. AWS CloudFormation lets you treat infrastructure as code and manage it through a template file that defines all the required resources and their dependencies.
Here is a simplified example of how to add Metricbeat container into a task using CloudFormation:
 TaskDefinition:
   Type: AWS::ECS::TaskDefinition
   Properties:
     Family: !Ref TaskName
     Cpu: 256
     Memory: 512
     NetworkMode: awsvpc
     ExecutionRoleArn: !Ref ExecutionRole
     ContainerDefinitions:
       - Name: metricbeat-container
         Image: docker.elastic.co/beats/metricbeat:7.11.0
         Secrets:
           - Name: ELASTIC_CLOUD_ID
             ValueFrom: !Ref CloudIDArn
           - Name: ELASTIC_CLOUD_AUTH
             ValueFrom: !Ref CloudAuthArn
                 EntryPoint:
           - sh
           - -c
         Command:
           - ./metricbeat setup -E cloud.id=$ELASTIC_CLOUD_ID -E cloud.auth=$ELASTIC_CLOUD_AUTH && ./metricbeat modules disable system && ./metricbeat modules enable awsfargate && ./metricbeat -e -E cloud.id=$ELASTIC_CLOUD_ID -E cloud.auth=$ELASTIC_CLOUD_AUTH
You can also find a full AWS CloudFormation template with awsfargate module, which creates a new cluster, a task definition with both Metricbeat container and stress test container, and starts the service. Please feel free to copy it into a cloudformation.yml file locally and give it a try.
If you are using Elastic Cloud, it’s recommended to store cloud id and cloud auth into AWS secret manager — here is the AWS CLI example:
Create secret ELASTIC_CLOUD_AUTH:
aws --region us-east-1 secretsmanager create-secret --name ELASTIC_CLOUD_AUTH --secret-string XXX
Create secret ELASTIC_CLOUD_ID:
aws --region us-east-1 secretsmanager create-secret --name ELASTIC_CLOUD_ID --secret-string YYY
Now with the secrets ready, let’s create an entire stack with one AWS CLI call using the CloudFormation template file cloudformation.yml.
Create CloudFormation Stack:
aws --region us-east-1 cloudformation create-stack --stack-name test-metricbeat-deployment --template-body file://./cloudformation.yml --capabilities CAPABILITY_NAMED_IAM --parameters ParameterKey=SubnetID,ParameterValue=subnet-5d89de27 ParameterKey=CloudAuthArn,ParameterValue=arn:aws:secretsmanager:us-east-1:xxx:secret:ELASTIC_CLOUD_AUTH-abc ParameterKey=CloudIDArn,ParameterValue=arn:aws:secretsmanager:us-east-1:xxx:secret:ELASTIC_CLOUD_ID-abc ParameterKey=ClusterName,ParameterValue=metricbeat-fargate ParameterKey=RoleName,ParameterValue=ecsFargateTaskExecutionRole
ParameterKey=TaskName,ParameterValue=task-metricbeat ParameterKey=ServiceName,ParameterValue=metricbeat-service ParameterKey=LogGroupName,ParameterValue=metricbeat-fargate-log-group
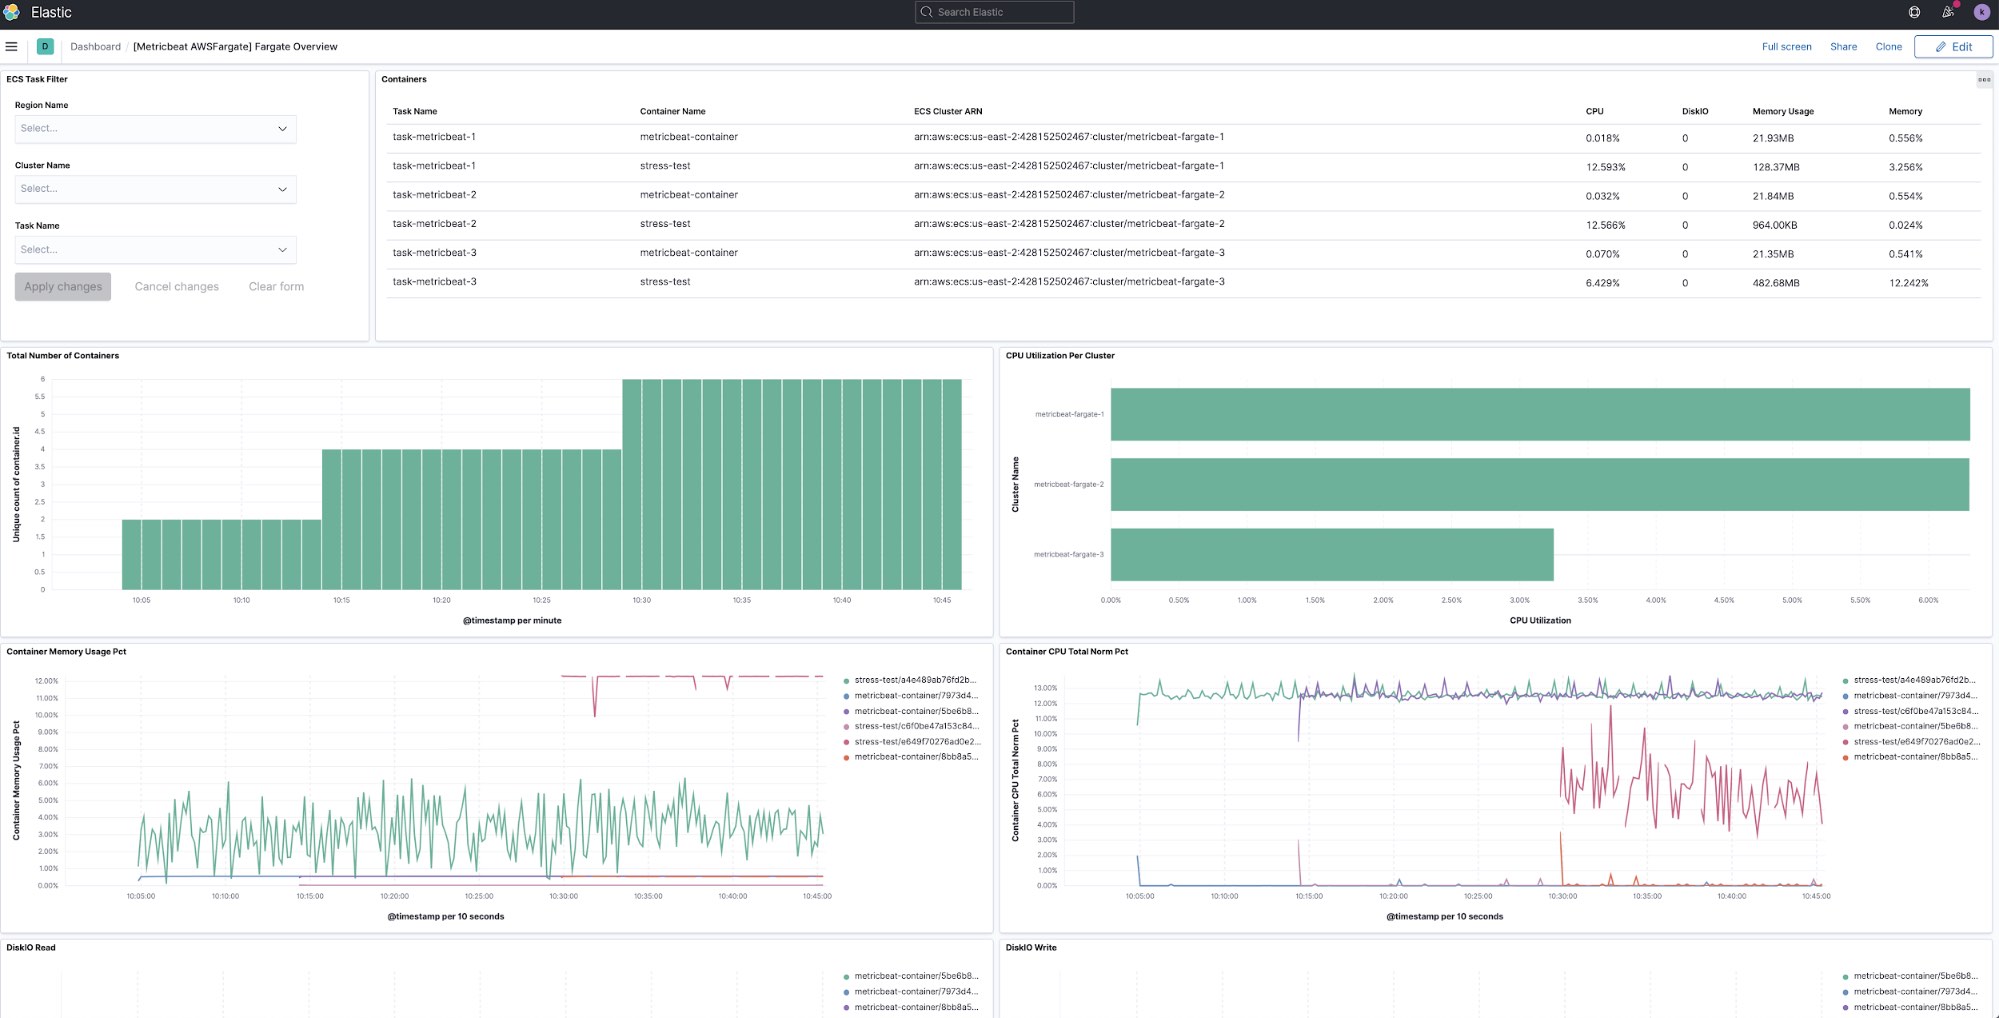
Once CloudFormation shows CREATE_COMPLETE status for your stack, you should be able to see monitoring metrics sent into Elasticsearch every 10 seconds. awsfargate module collects runtime metrics from each container including CPU, memory, network, and diskIO information. There is also an out of the box dashboard you can use to display all monitoring data from awsfargate in Kibana:
Once you are done experimenting, you can easily delete the whole stack using AWS CLI:
aws --region us-east-1 cloudformation delete-stack --stack-name test-metricbeat-deployment
What’s next
Are you looking for a monitoring solution for your Amazon ECS container deployments? With Metricbeatdocker and awsfargate modules, users can easily monitor Amazon ECS containers and ship metrics to Elasticsearch Service on Elastic Cloud. If you have any questions or feedback, please feel free to post on our Beats forum!