Metricbeat quick start: installation and configuration
editMetricbeat quick start: installation and configuration
editMetricbeat helps you monitor your servers and the services they host by collecting metrics from the operating system and services.
This guide describes how to get started quickly with metrics collection. You’ll learn how to:
- install Metricbeat on each system you want to monitor
- specify the metrics you want to collect
- send the metrics to Elasticsearch
- visualize the metrics data in Kibana
Before you begin
editYou need Elasticsearch for storing and searching your data, and Kibana for visualizing and managing it.
To get started quickly, spin up a deployment of our hosted Elasticsearch Service. The Elasticsearch Service is available on AWS, GCP, and Azure. Try it out for free.
Step 1: Install Metricbeat
editInstall Metricbeat as close as possible to the service you want to monitor. For example, if you have four servers with MySQL running, it’s recommended that you run Metricbeat on each server. This allows Metricbeat to access your service from localhost and does not cause any additional network traffic or prevent Metricbeat from collecting metrics when there are network problems. Metrics from multiple Metricbeat instances will be combined on the Elasticsearch server.
To download and install Metricbeat, use the commands that work with your system:
curl -L -O https://artifacts.elastic.co/downloads/beats/metricbeat/metricbeat-7.11.2-amd64.deb
sudo dpkg -i metricbeat-7.11.2-amd64.deb
curl -L -O https://artifacts.elastic.co/downloads/beats/metricbeat/metricbeat-7.11.2-x86_64.rpm
sudo rpm -vi metricbeat-7.11.2-x86_64.rpm
curl -L -O https://artifacts.elastic.co/downloads/beats/metricbeat/metricbeat-7.11.2-darwin-x86_64.tar.gz
tar xzvf metricbeat-7.11.2-darwin-x86_64.tar.gz
brew tap elastic/tap
brew install elastic/tap/metricbeat-full
This command installs the most recently released default distribution of
Metricbeat. To install the OSS distribution, specify
elastic/tap/metricbeat-oss.
curl -L -O https://artifacts.elastic.co/downloads/beats/metricbeat/metricbeat-7.11.2-linux-x86_64.tar.gz
tar xzvf metricbeat-7.11.2-linux-x86_64.tar.gz
- Download the Metricbeat Windows zip file from the downloads page.
-
Extract the contents of the zip file into
C:\Program Files. -
Rename the
metricbeat-<version>-windowsdirectory toMetricbeat. - Open a PowerShell prompt as an Administrator (right-click the PowerShell icon and select Run As Administrator).
-
From the PowerShell prompt, run the following commands to install Metricbeat as a Windows service:
PS > cd 'C:\Program Files\Metricbeat'
PS C:\Program Files\Metricbeat> .\install-service-metricbeat.ps1
If script execution is disabled on your system, you need to set the
execution policy for the current session to allow the script to run. For
example:
PowerShell.exe -ExecutionPolicy UnRestricted -File .\install-service-metricbeat.ps1.
Other installation options
editStep 2: Connect to the Elastic Stack
editConnections to Elasticsearch and Kibana are required to set up Metricbeat.
Set the connection information in metricbeat.yml. To locate this
configuration file, see Directory layout.
Specify the cloud.id of your Elasticsearch Service, and set cloud.auth to a user who is authorized to set up Metricbeat. For example:
cloud.id: "staging:dXMtZWFzdC0xLmF3cy5mb3VuZC5pbyRjZWM2ZjI2MWE3NGJmMjRjZTMzYmI4ODExYjg0Mjk0ZiRjNmMyY2E2ZDA0MjI0OWFmMGNjN2Q3YTllOTYyNTc0Mw=="
cloud.auth: "metricbeat_setup:YOUR_PASSWORD"
|
This examples shows a hard-coded password, but you should store sensitive values in the secrets keystore. |
-
Set the host and port where Metricbeat can find the Elasticsearch installation, and set the username and password of a user who is authorized to set up Metricbeat. For example:
output.elasticsearch:
  hosts: ["myEShost:9200"]
  username: "metricbeat_internal"
  password: "YOUR_PASSWORD"
This examples shows a hard-coded password, but you should store sensitive values in the secrets keystore.
-
If you plan to use our pre-built Kibana dashboards, configure the Kibana endpoint. Skip this step if Kibana is running on the same host as Elasticsearch.
The hostname and port of the machine where Kibana is running, for example,
mykibanahost:5601. If you specify a path after the port number, include the scheme and port:http://mykibanahost:5601/path.The
usernameandpasswordsettings for Kibana are optional. If you don’t specify credentials for Kibana, Metricbeat uses theusernameandpasswordspecified for the Elasticsearch output.To use the pre-built Kibana dashboards, this user must be authorized to view dashboards or have the
kibana_adminbuilt-in role.
To learn more about required roles and privileges, see Grant users access to secured resources.
You can send data to other outputs, such as Logstash, but that requires additional configuration and setup.
Step 3: Enable and configure metrics collection modules
editMetricbeat uses modules to collect metrics. Each module defines the basic logic for collecting data from a specific service, such as Redis or MySQL. A module consists of metricsets that fetch and structure the data. Read How Metricbeat works to learn more.
-
Identify the modules you need to enable. To see the list of available modules, run:
metricbeat modules list
metricbeat modules list
./metricbeat modules list
metricbeat modules list
./metricbeat modules list
PS > .\metricbeat.exe modules list
-
From the installation directory, enable one or more modules. If you accept the default configuration without enabling additional modules, Metricbeat collects system metrics only.
The following command enables the
apacheandmysqlconfigs in themodules.ddirectory:metricbeat modules enable apache mysql
metricbeat modules enable apache mysql
./metricbeat modules enable apache mysql
metricbeat modules enable apache mysql
./metricbeat modules enable apache mysql
PS > .\metricbeat.exe modules enable apache mysql
See the
modulescommand to learn more about this command. If you are using a Docker image, see Run Metricbeat on Docker. -
In the module configs under
modules.d, change the module settings to match your environment. See Standard config options for more about available settings.
To test your configuration file, change to the directory where the
Metricbeat binary is installed, and run Metricbeat in the foreground with
the following options specified: ./metricbeat test config -e. Make sure your
config files are in the path expected by Metricbeat (see Directory layout),
or use the -c flag to specify the path to the config file.
For more information about configuring Metricbeat, also see:
- Configure Metricbeat
- Config file format
-
metricbeat.reference.yml: This reference configuration file shows all non-deprecated options. You’ll find it in the same location asmetricbeat.yml.
Step 4: Set up assets
editMetricbeat comes with predefined assets for parsing, indexing, and visualizing your data. To load these assets:
-
Make sure the user specified in
metricbeat.ymlis authorized to set up Metricbeat. -
From the installation directory, run:
metricbeat setup -e
metricbeat setup -e
./metricbeat setup -e
metricbeat setup -e
./metricbeat setup -e
PS > .\metricbeat.exe setup -e
-eis optional and sends output to standard error instead of the configured log output.
This step loads the recommended index template for writing to Elasticsearch and deploys the sample dashboards for visualizing the data in Kibana.
A connection to Elasticsearch (or Elasticsearch Service) is required to set up the initial environment. If you’re using a different output, such as Logstash, see Load the index template manually and Load Kibana dashboards.
Step 5: Start Metricbeat
editBefore starting Metricbeat, modify the user credentials in
metricbeat.yml and specify a user who is
authorized to publish events.
To start Metricbeat, run:
sudo service metricbeat start
If you use an init.d script to start Metricbeat, you can’t specify command
line flags (see Command reference). To specify flags, start Metricbeat in
the foreground.
Also see Metricbeat and systemd.
sudo service metricbeat start
If you use an init.d script to start Metricbeat, you can’t specify command
line flags (see Command reference). To specify flags, start Metricbeat in
the foreground.
Also see Metricbeat and systemd.
|
You’ll be running Metricbeat as root, so you need to change ownership of the
configuration file and any configurations enabled in the |
To have launchd start elastic/tap/metricbeat and then restart it at login,
run:
brew services start elastic/tap/metricbeat-full
To run Metricbeat in the foreground instead of running it as a background service, run:
sudo chown root /usr/local/etc/metricbeat/metricbeat.yml
sudo chown root /usr/local/etc/metricbeat/modules.d/system.yml
sudo metricbeat -e
|
You’ll be running Metricbeat as root, so you need to change ownership of the
configuration file and any configurations enabled in the |
|
You’ll be running Metricbeat as root, so you need to change ownership of the
configuration file and any configurations enabled in the |
PS C:\Program Files\metricbeat> Start-Service metricbeat
By default, Windows log files are stored in C:\ProgramData\metricbeat\Logs.
On Windows, statistics about system load and swap usage are currently not captured
Metricbeat should begin streaming metrics to Elasticsearch.
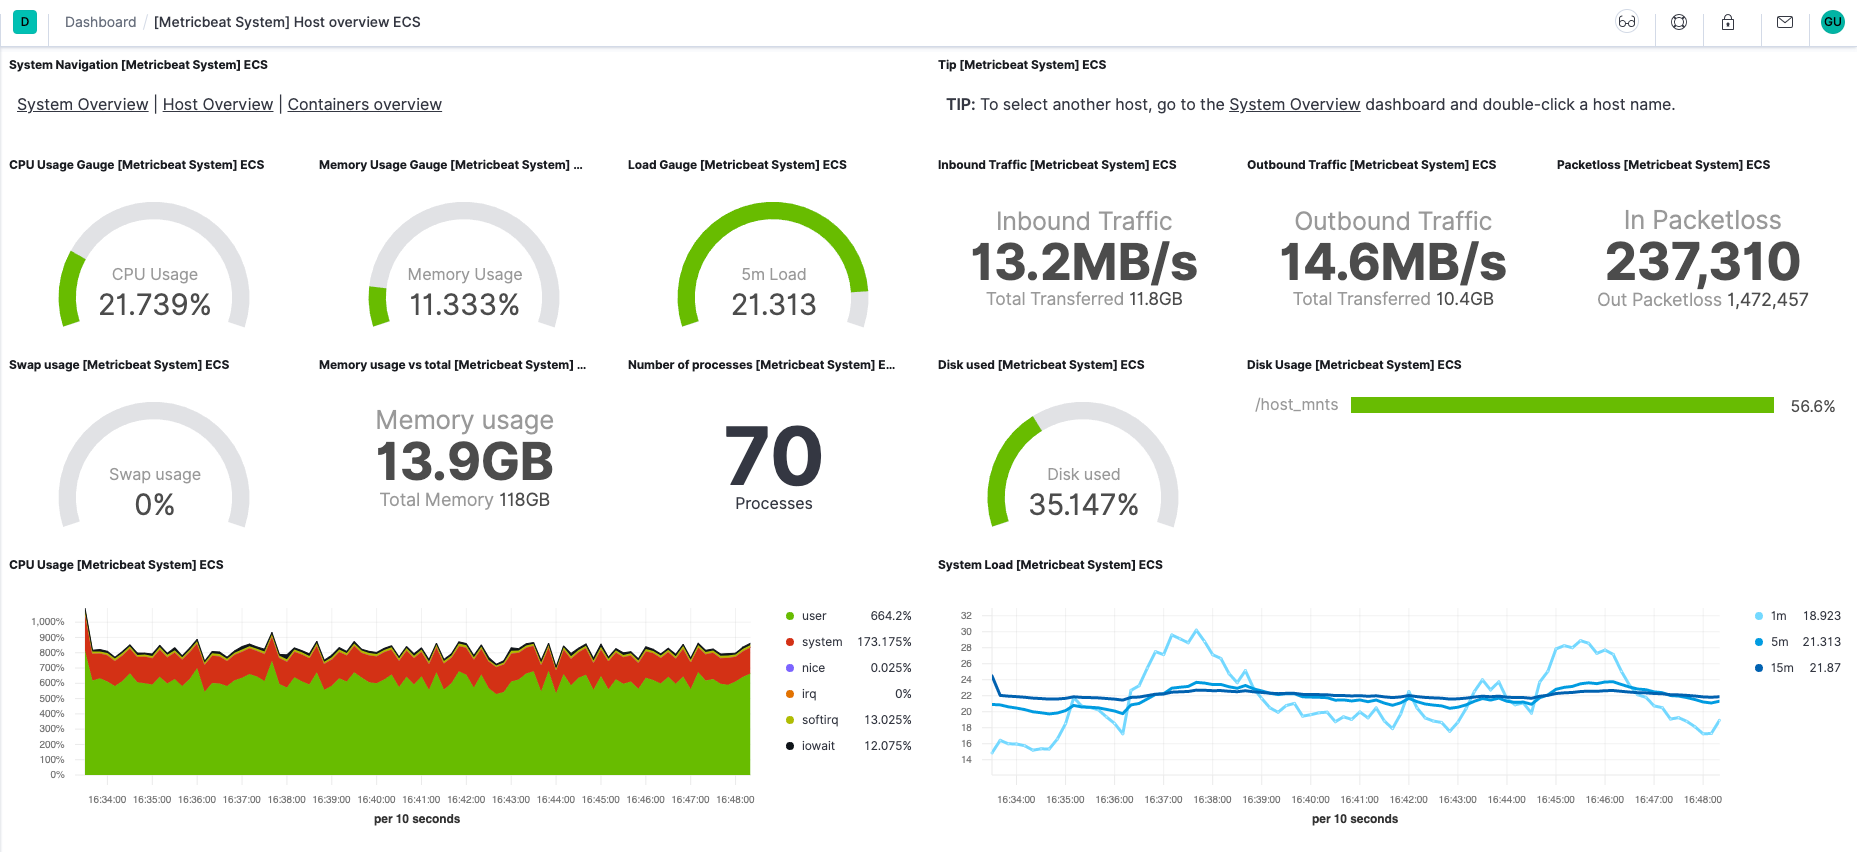
Step 6: View your data in Kibana
editMetricbeat comes with pre-built Kibana dashboards and UIs for visualizing log
data. You loaded the dashboards earlier when you ran the setup command.
To open the dashboards:
-
Launch Kibana:
- Log in to your Elastic Cloud account.
- Navigate to the Kibana endpoint in your deployment.
Point your browser to http://localhost:5601, replacing
localhostwith the name of the Kibana host. -
In the side navigation, click Discover. To see Metricbeat data, make sure the predefined
metricbeat-*index pattern is selected.If you don’t see data in Kibana, try changing the time filter to a larger range. By default, Kibana shows the last 15 minutes.
- In the side navigation, click Dashboard, then select the dashboard that you want to open.
The dashboards are provided as examples. We recommend that you customize them to meet your needs.
What’s next?
editNow that you have your infrastructure metrics streaming into Elasticsearch, learn how to unify your logs, metrics, uptime, and application performance data.
-
Ingest data from other sources by installing and configuring other Elastic Beats:
Elastic Beats To capture Logs
Windows event logs
Uptime information
Application performance metrics
Audit events
-
Use the Observability apps in Kibana to search across all your data:
Elastic apps Use to Explore metrics about systems and services across your ecosystem
Tail related log data in real time
Monitor availability issues across your apps and services
Monitor application performance
Analyze security events