Dashboard
editDashboard
editVisualize your data with dashboards.
The best way to understand your data is to visualize it. With dashboards, you can turn your data from one or more index patterns into a collection of panels that bring clarity to your data, tell a story about your data, and allow you to focus on only the data that’s important to you. Configure each panel to display your data in a chart, table, map, and more, then compare the panels side-by-side to identify the patterns and connections in your data.
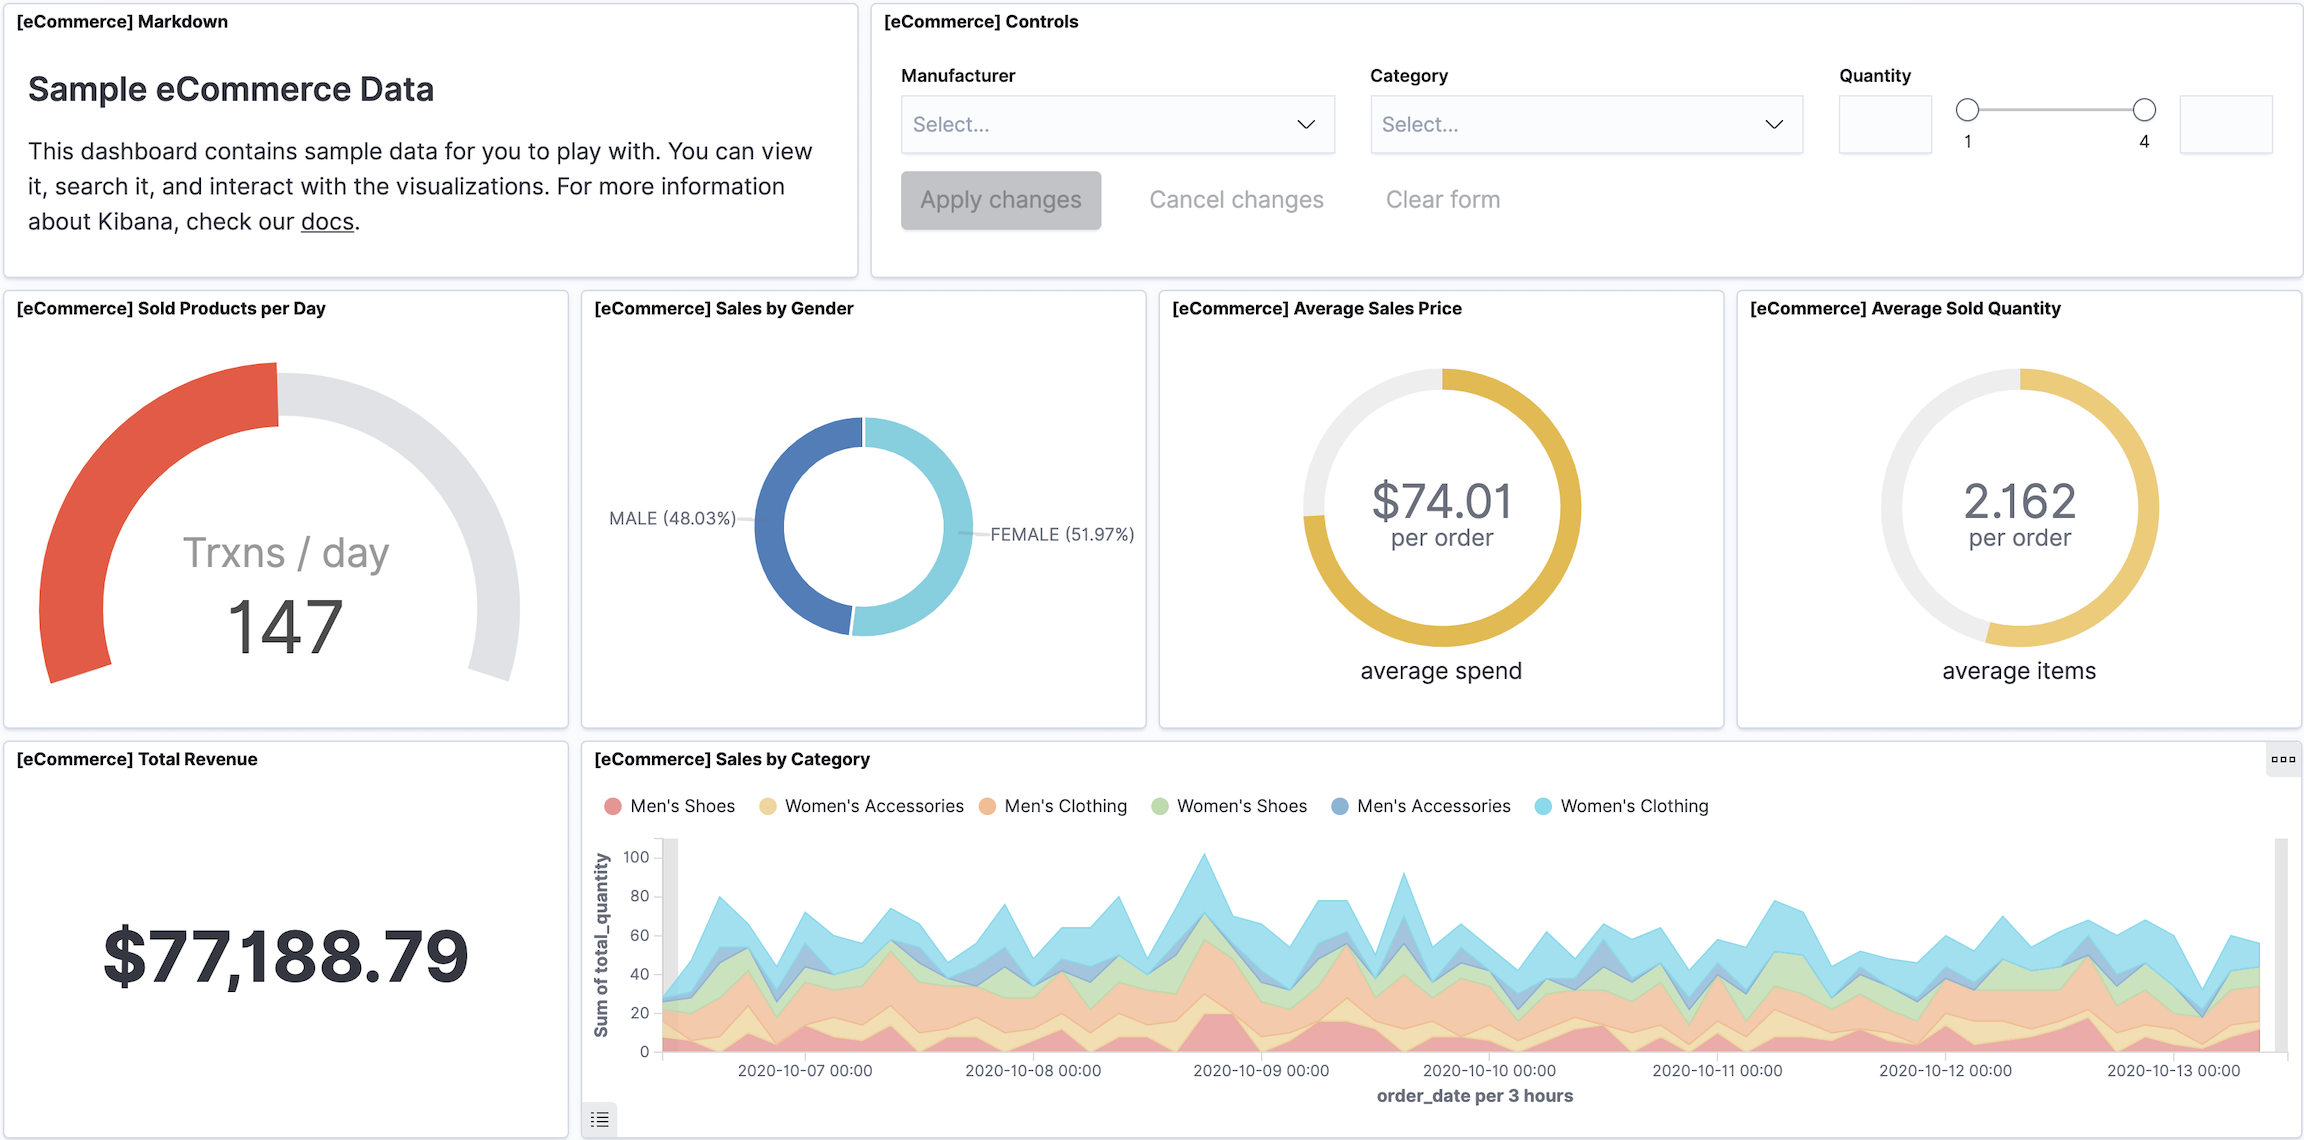
Dashboards support many types of panels, and provide several editors that you can use to create panels.
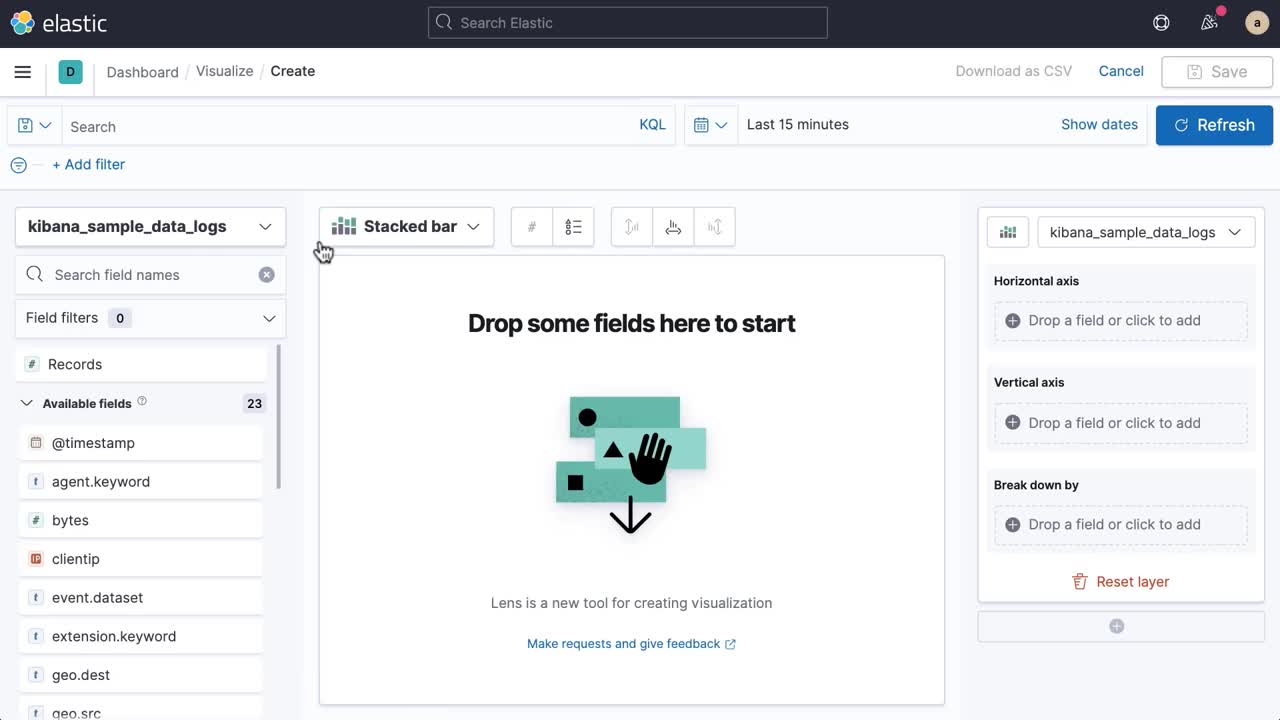
The drag and drop editor that creates visualizations of your data. Lens is recommended for most users. |
|
Create beautiful displays of your geographical data. |
|
Visualize time series data with TSVB or Timelion, or create a custom visualization using Vega or Vega-Lite. |
|
Build most visualization types using Elasticsearch aggregations. |
|
Add context to your panels with text, or add dynamic filters with Controls. |
|
Display a previously saved search table from Discover. The table results are not aggregated. |
|
Display a previously saved visualization of machine learning anomaly detection data. |
Create dashboards
editDashboards provide you with the space where you add panels of your data.
Minimum requirements
editTo create dashboards, you must meet the minimum requirements.
- If you need to set up Kibana, use our free trial.
- Make sure you have data indexed into Elasticsearch and an index pattern.
- Have an understanding of Elasticsearch documents and indices.
- When the read-only indicator appears, you have insufficient privileges to create or save dashboards. The options to create and save dashboards are not visible. For more information, refer to Granting access to Kibana.
Open the dashboard
editBegin with an empty dashboard, or open an existing dashboard.
- Open the main menu, then click Dashboard.
-
On the Dashboards page, choose one of the following options:
- To start with an empty dashboard, click Create dashboard.
- To open an existing dashboard, click the dashboard Title you want to open.
Create panels
editChoose the type of panel you want to create, then save the panel to the dashboard.
-
From the dashboard, choose one of the following options:
- To create a panel, click Create panel, then click the panel type on the New visualization window. Lens is recommended for most users.
- To add a saved panel, click Add from library, then select the panel you want to add. When a panel contains a stored query, both queries are applied.
-
To save the panel, click Save in the toolbar, then configure the Save visualization options.
- Enter the Title and optional Description.
- From the Tags drop down, select any applicable tags.
- Select Add to Dashboard after saving.
- Click Save and return.
To access your saved panels, open the main menu, then click Visualize.
Arrange panels
editTo compare the data in the panels, arrange the panels on the dashboard, or remove the panel from the dashboard.
-
From the toolbar, click Edit, then use the following options:
- To move, click and hold the panel header, then drag to the new location.
- To resize, click the resize control, then drag to the new dimensions.
- To delete, open the panel menu, then select Delete from dashboard.
- To save your changes, click Save in the toolbar.
Search or filter your data
editKibana provides you with several ways to search your data and apply Elasticsearch filters. You can combine the filters with any panel-specific filters to display the data want to you see.
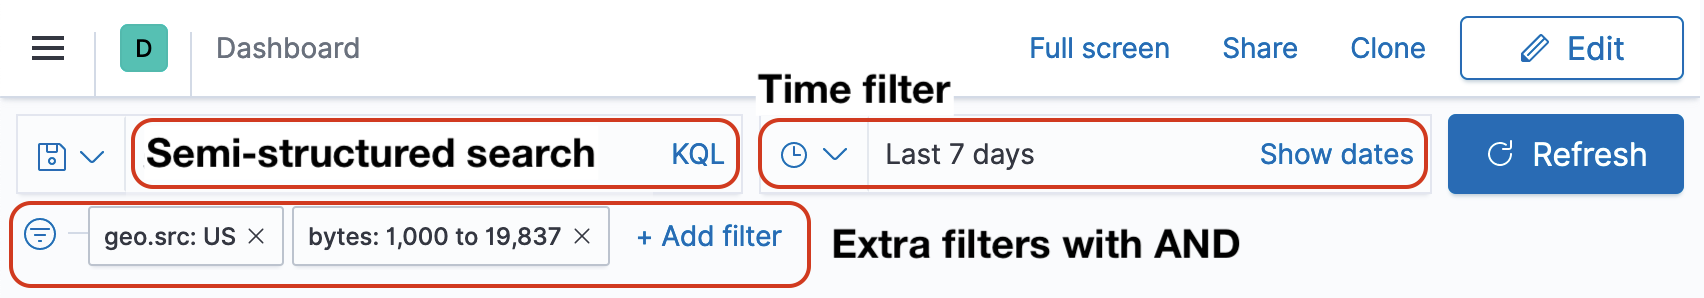
- Semi-structured search
-
Combine free text search with field-based search using the Kibana Query Language. Type a search term to match across all fields, or begin typing a field name to get prompted with field names and operators you can use to build a structured query. For example, in the sample web logs data, this query displays data only for the US:
-
Enter
g, then select geo.source. - Select equals some value and US, then click Update.
- For a more complex search, try:
-
Enter
geo.src : "US" and url.keyword : "https://www.elastic.co/downloads/beats/metricbeat"
- Time filter
-
Dashboards have a global time filter that restricts the data that displays, but individual panels can override the global time filter.
- To update the time filter, add a panel that displays time on the x-axis.
- Open the panel menu, then select More > Customize time range.
- On the Customize panel time range window, specify the new time range, then click Add to panel.
- Additional filters with AND
-
Add filters to a dashboard, or pin filters to multiple places in Kibana. To add filters, using a basic editor or an advanced JSON editor for the Elasticsearch query DSL. When you use more than one index pattern on a dashboard, the filter editor allows you to filter only one dashboard. To dynamically add filters, click a series on a dashboard. For example, to filter the dashboard to display only ios data:
- Click Add filter.
- Set Field to machine.os, Operator to is, and Value to ios.
- Save the filter.
- To remove the filter, click x.
Clone panels
editTo duplicate a panel and the configured functionality, clone the panel. Cloned panels continue to replicate all of the functionality from the original panel, including renaming, editing, and cloning. When you clone a panel, the clone appears beside the original panel, and moves other panels to provide a space on the dashboard.
- From the toolbar, click Edit.
-
Open the panel menu, then select Clone panel.
Kibana automatically saves the cloned panel in Visualize. To access the cloned panel, open the main menu, then click Visualize.
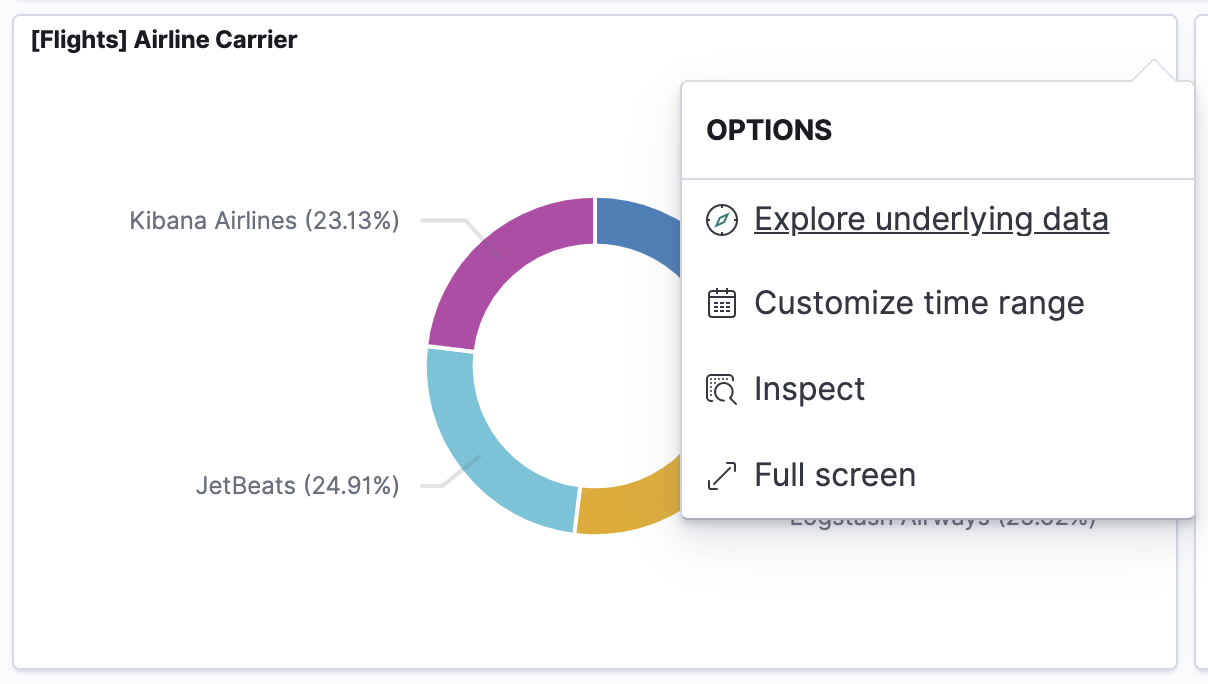
Explore the underlying documents
editDashboard panels have a shortcut to view the underlying documents in Discover. Open the panel menu, then click Explore underlying data. Discover will be opened with the same time range and filters as the panel.
A second shortcut is disabled by default, and creates a new interaction when clicking on a chart. This shortcut is similar to a drilldown, but can show you data for only one series. To enable the chart interactivity shortcut, add the following to kibana.yml:
xpack.discoverEnhanced.actions.exploreDataInChart.enabled: true
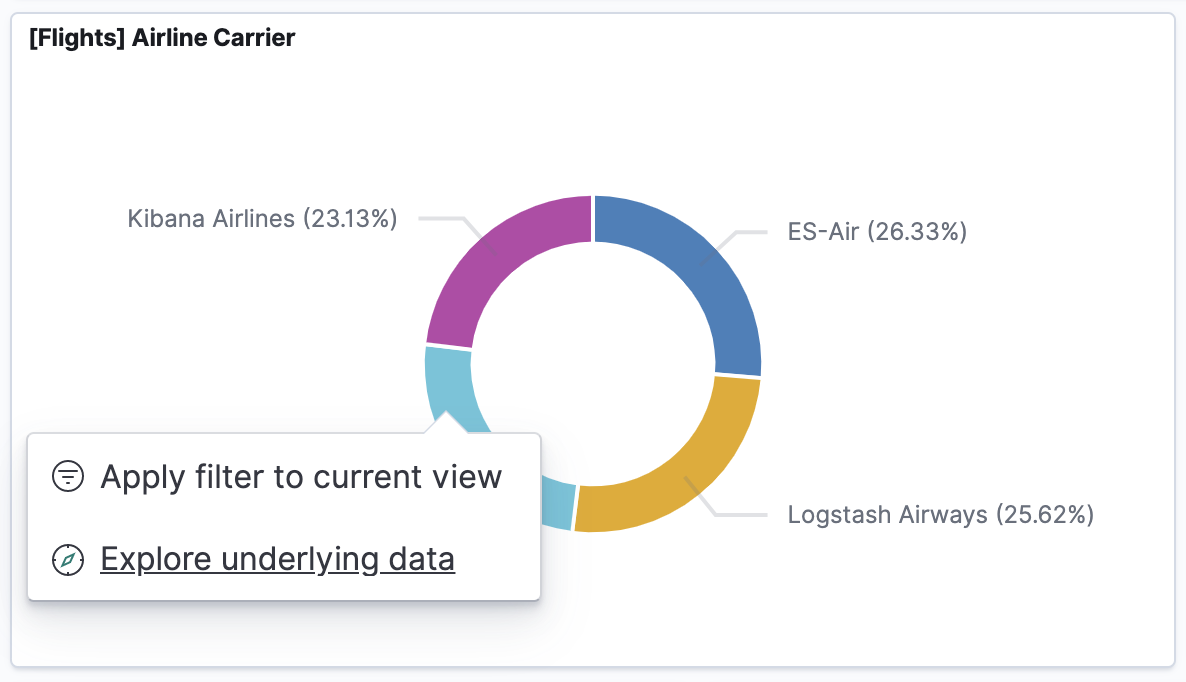
Explore underlying data is available only for visualization panels with a single index pattern.
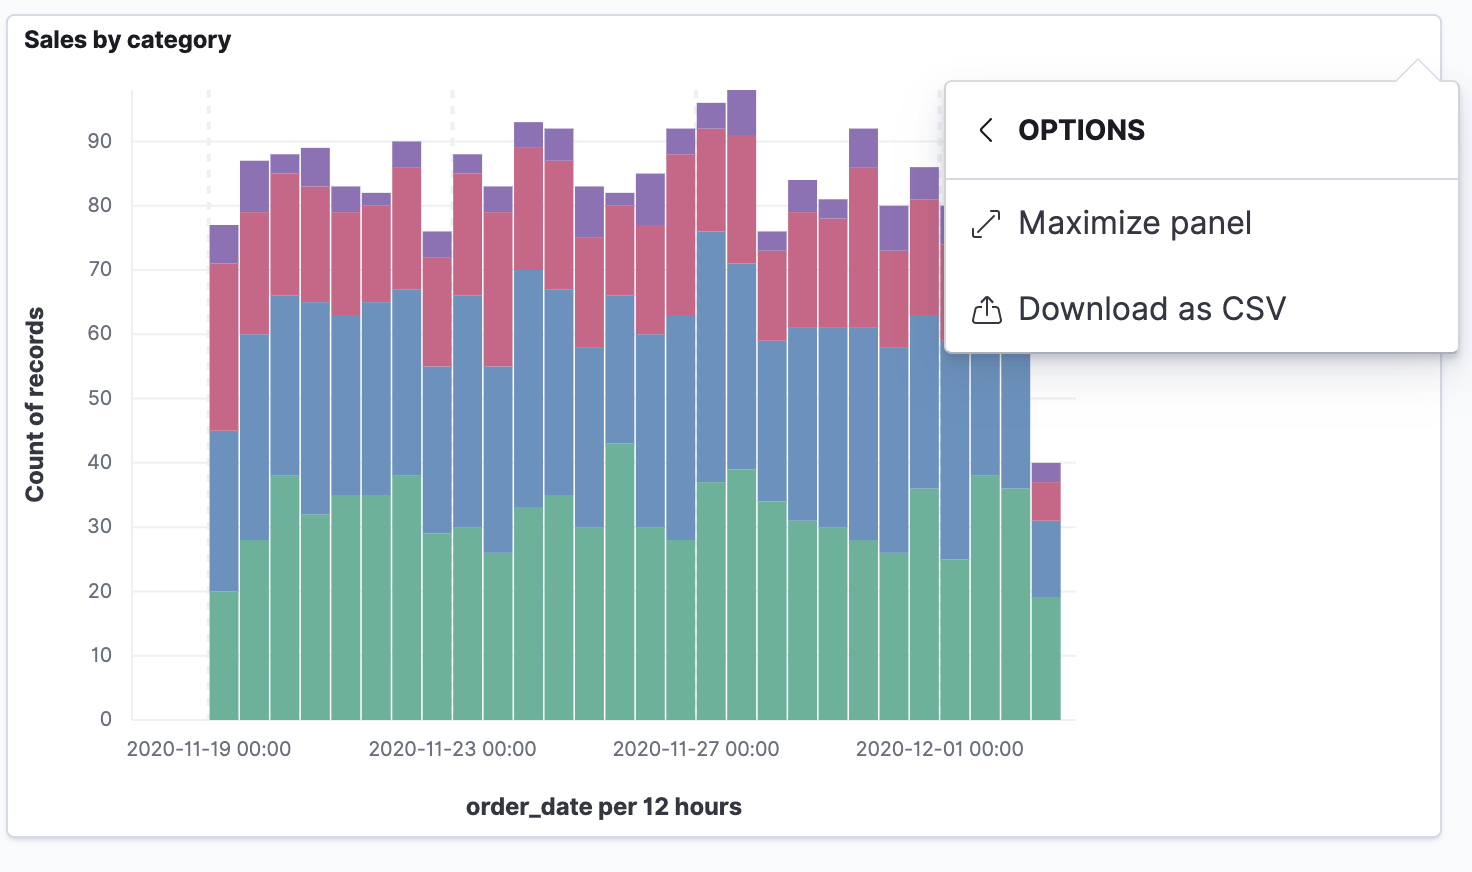
Download panel data as CSV
editDownload panel data in a CSV file. You can download most panels in a CSV file, but there is a shortcut available for Lens panels.
- Lens
-
Open the Lens panel menu, then select More > Download as CSV.
- All panels
-
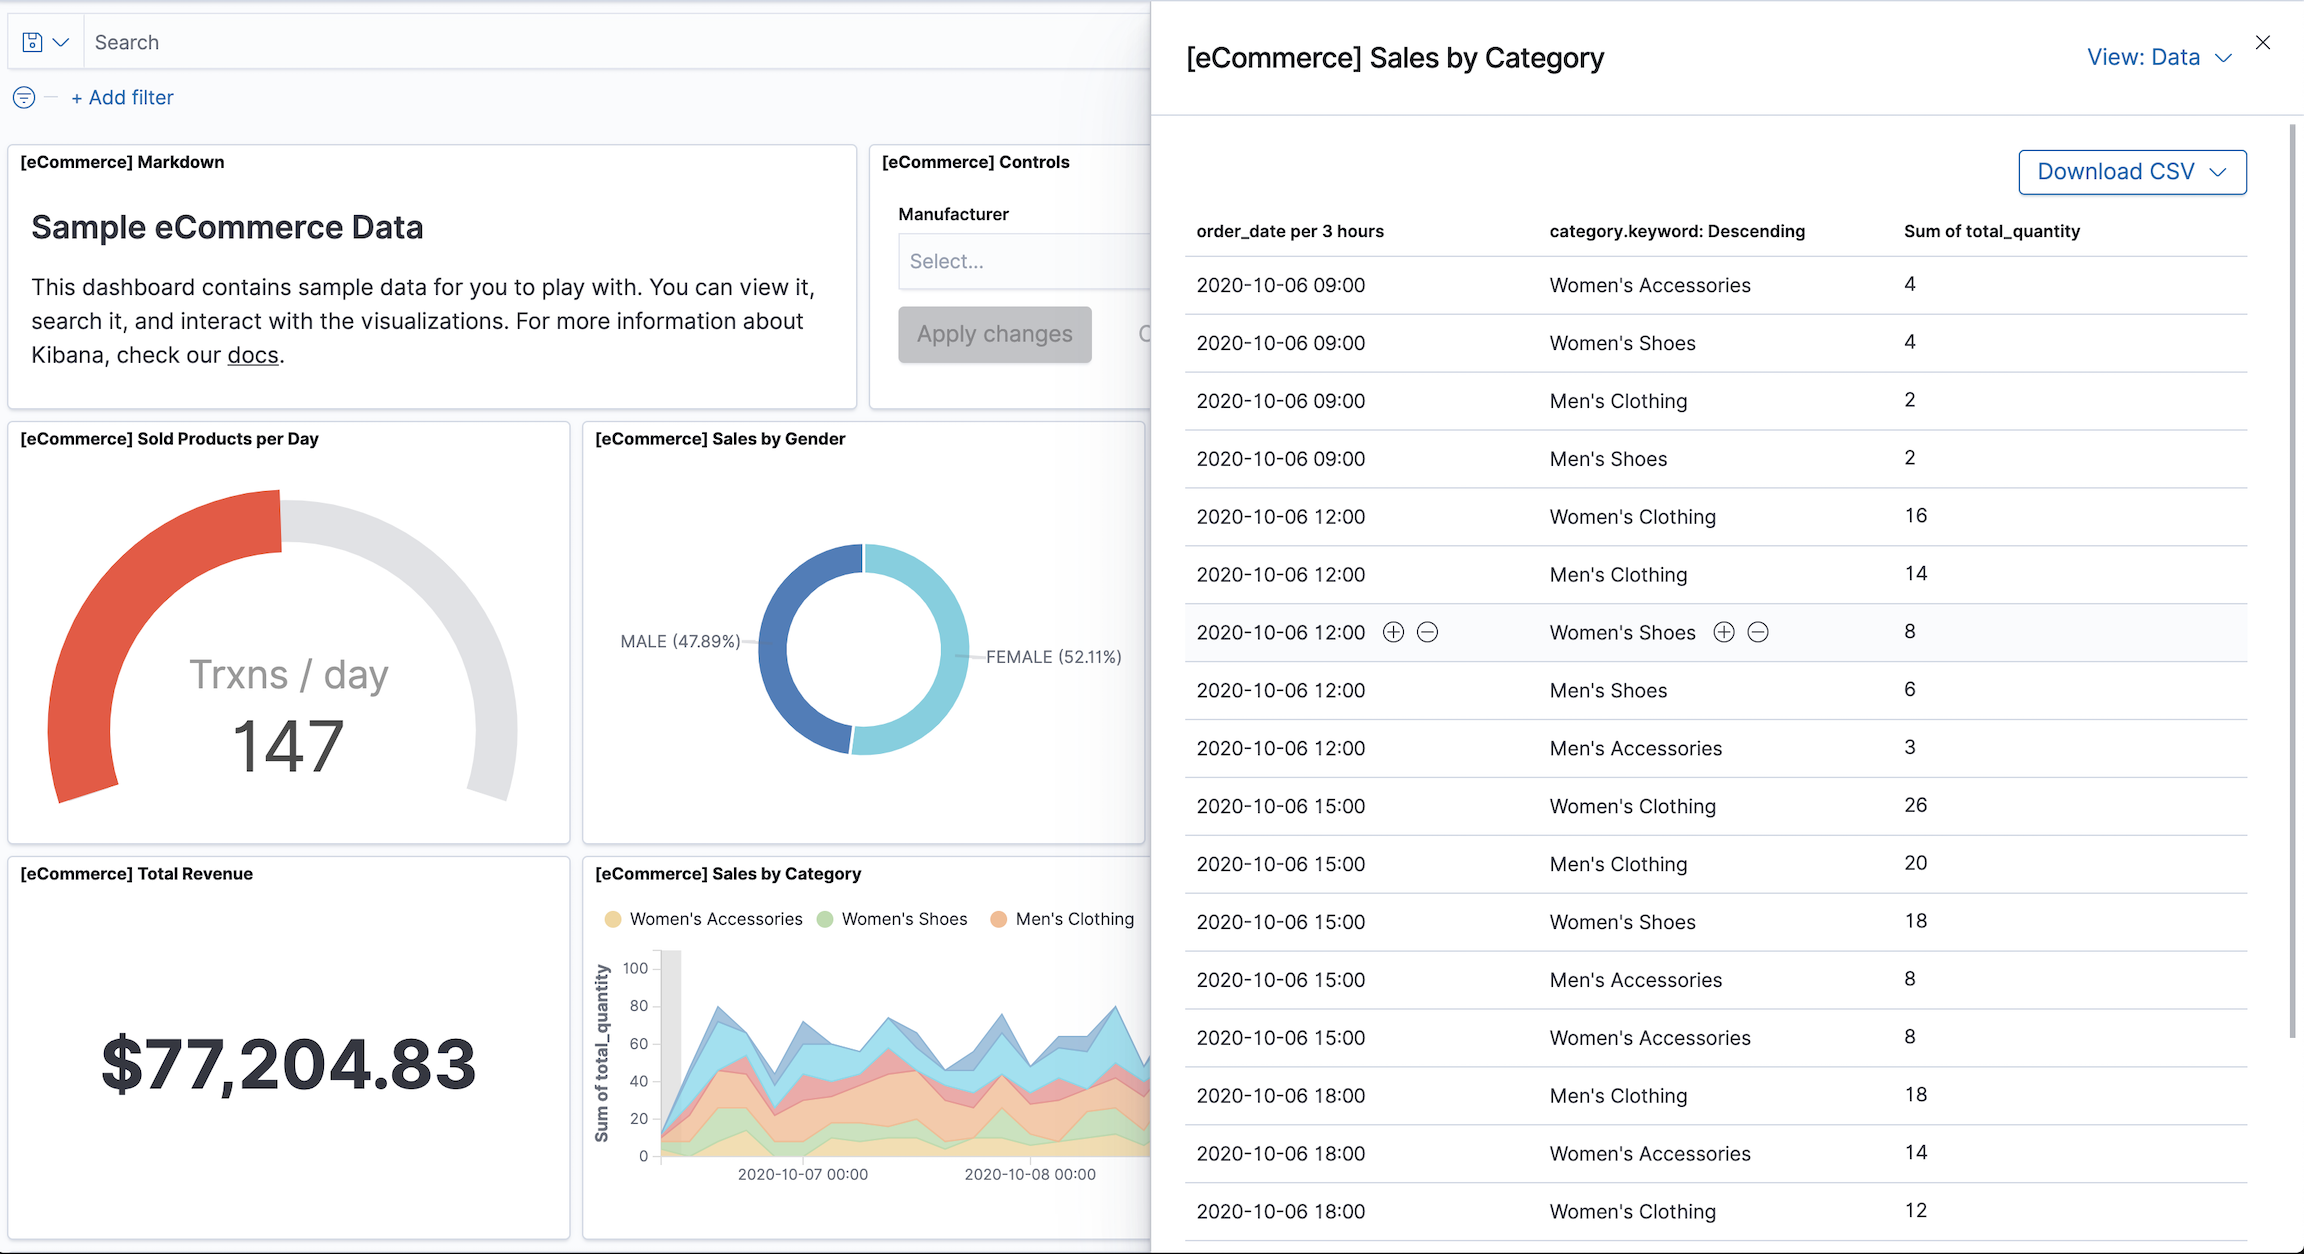
- Open the panel menu, then select Inspect.
- Click Download CSV, then select the CSV type from the dropdown. The Formatted CSV contains human-readable dates and numbers, while the Unformatted option is for computer use.
Save the dashboard
editWhen you’re finished making changes, save the dashboard.
- From the toolbar, click Save.
- Enter the dashboard Title and an optional Description.
- From the Tags dropdown, select the tags you want to apply.
- To save the time range, select Store time with dashboard.
- Click Save.
Share the dashboard
editTo share the dashboard with a larger audience, click Share in the toolbar, then choose one of the following options:
- Embed code — Embed the dashboard as an iframe on a web page. Embedded dashboards are fully interactive, but you can hide some parts of the dashboard using the menu options. User authentication is required, which the user provides or via reverse proxy. Anonymous access is also supported. For more details, learn about Authentication.
- Permalinks — Share a direct link to a Kibana dashboard. User authentication is required.
- PDF Reports — Generate a PDF report. For more information, refer to Reporting.
- PNG Reports — Generate a PNG report. For more information, refer to Reporting.
Export the dashboard
editTo automate Kibana, you can export dashboards as JSON using the import and export dashboard APIs. It is important to export dashboards with all references needed.