Create panels with the advanced editors
editCreate panels with the advanced editors
editKibana provides you with three advanced editors that you can use to manually create dashboard panels.
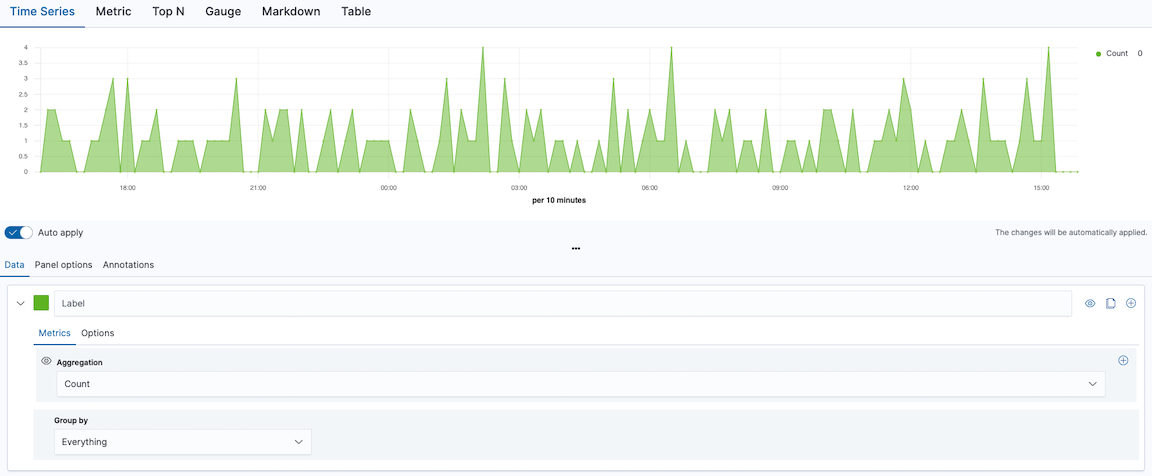
TSVB
editTSVB is a time series data visualization editor that allows you to use the full power of the Elasticsearch aggregation framework.
With TSVB, you can:
- Combine an infinite number of aggregations to display your data.
- Annotate time series data with timestamped events from an Elasticsearch index.
- View the data in several types of visualizations, including charts, data tables, and markdown panels.
- Display multiple index patterns in each visualization.
- Customize the data with labels and colors.
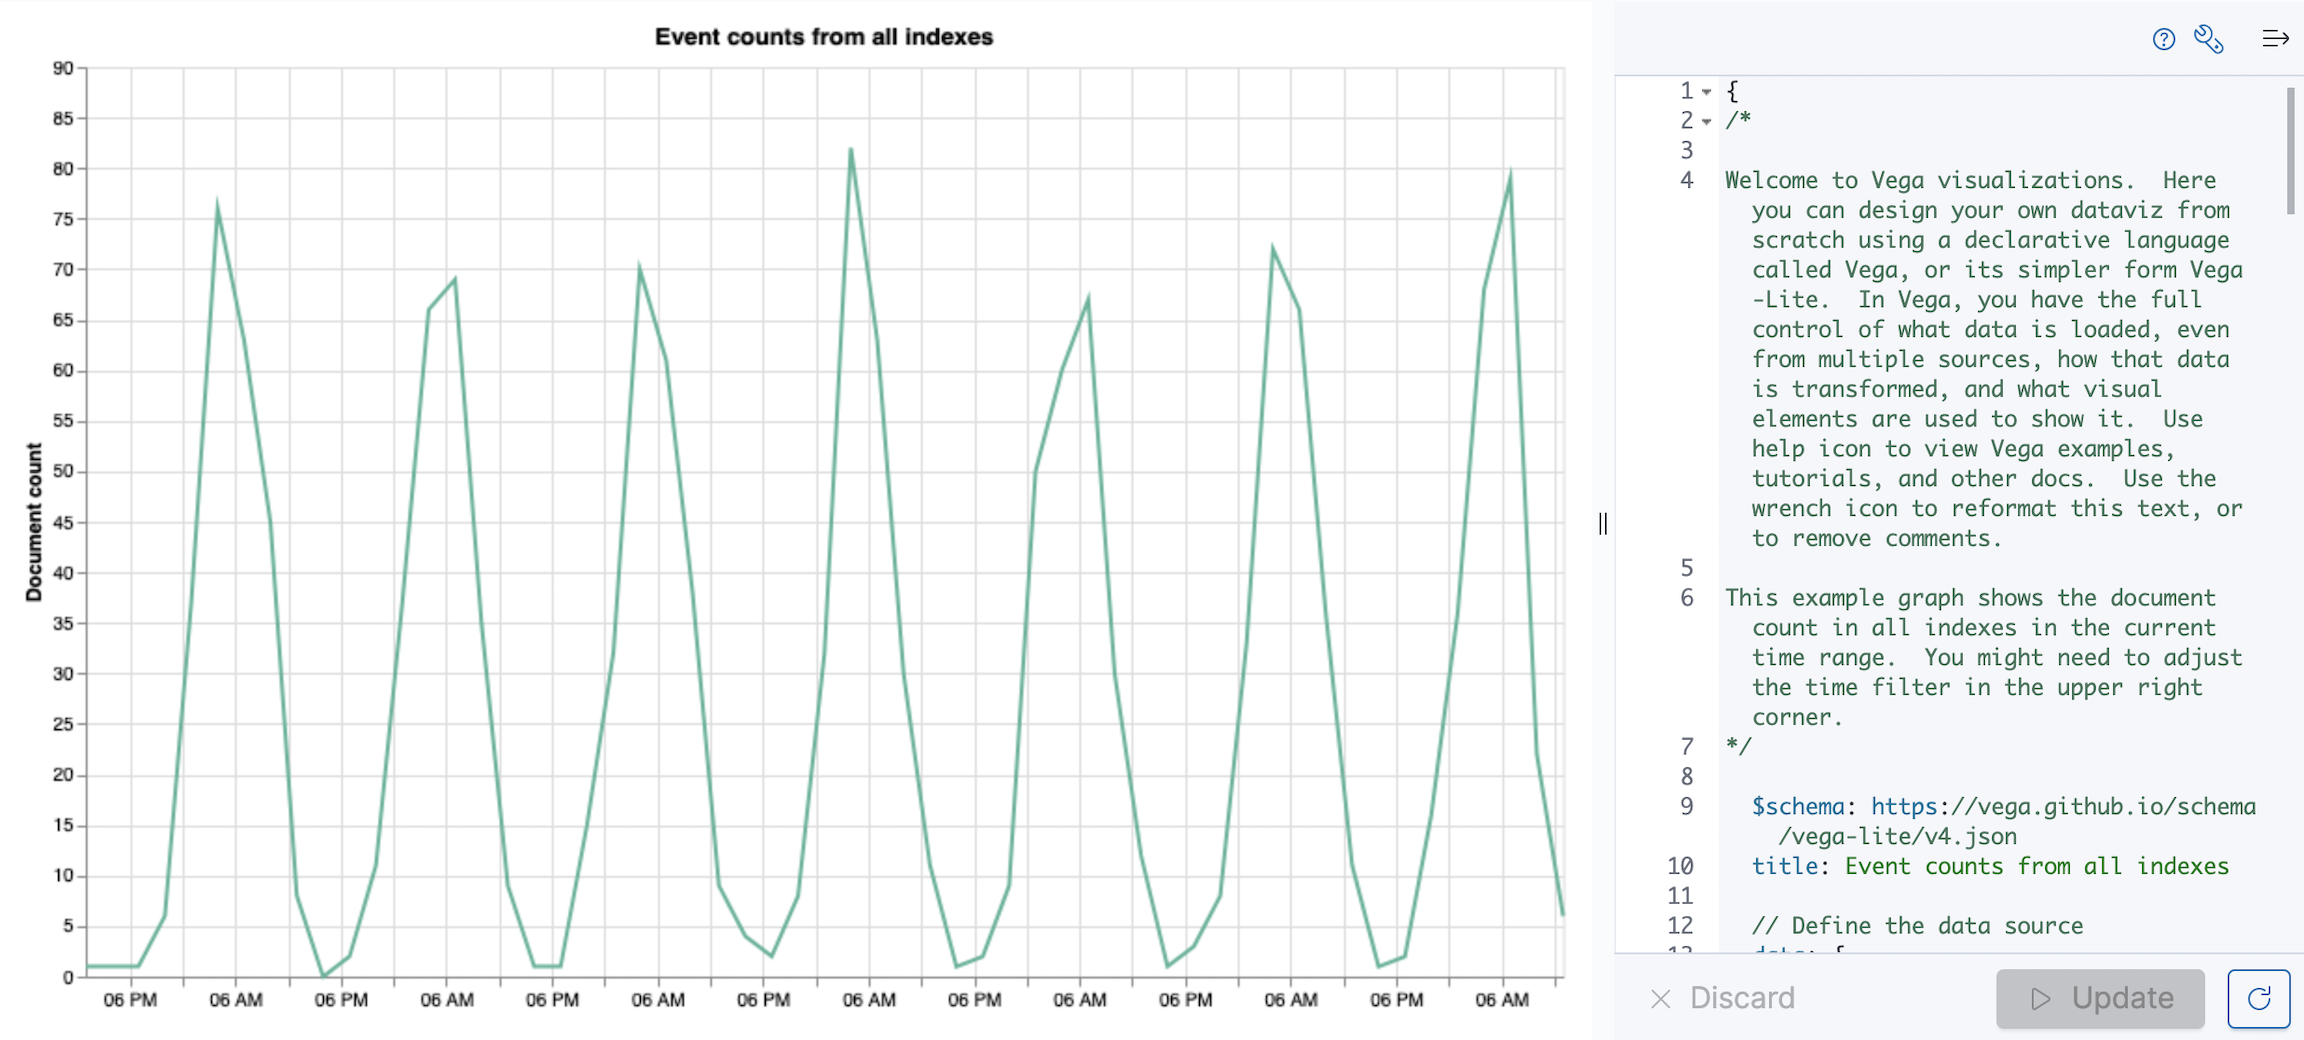
Custom visualizations
editVega and Vega-Lite are visualization grammars that are integrated into Kibana for custom visualizations.
- Vega-Lite — A high-level grammar for rapid analysis
- Vega — A declarative language with support for interactivity
Vega and Vega-Lite panels can display one or more data sources, including Elasticsearch, Elastic Map Service, URL, or static data, and support Kibana extensions that allow you to embed the panels on your dashboard and add interactive tools.
Use Vega or Vega-Lite when you want to create visualizations with:
-
Aggregations that use
nestedorparent/childmapping - Aggregations without an index pattern
- Queries that use custom time filters
- Complex calculations
- Extracted data from _source instead of aggregations
- Scatter charts, sankey charts, and custom maps
- An unsupported visual theme
These grammars have some limitations: they do not support tables, and can’t run queries conditionally.
For detailed Vega and Vega-Lite information and examples, refer to Resources and examples.
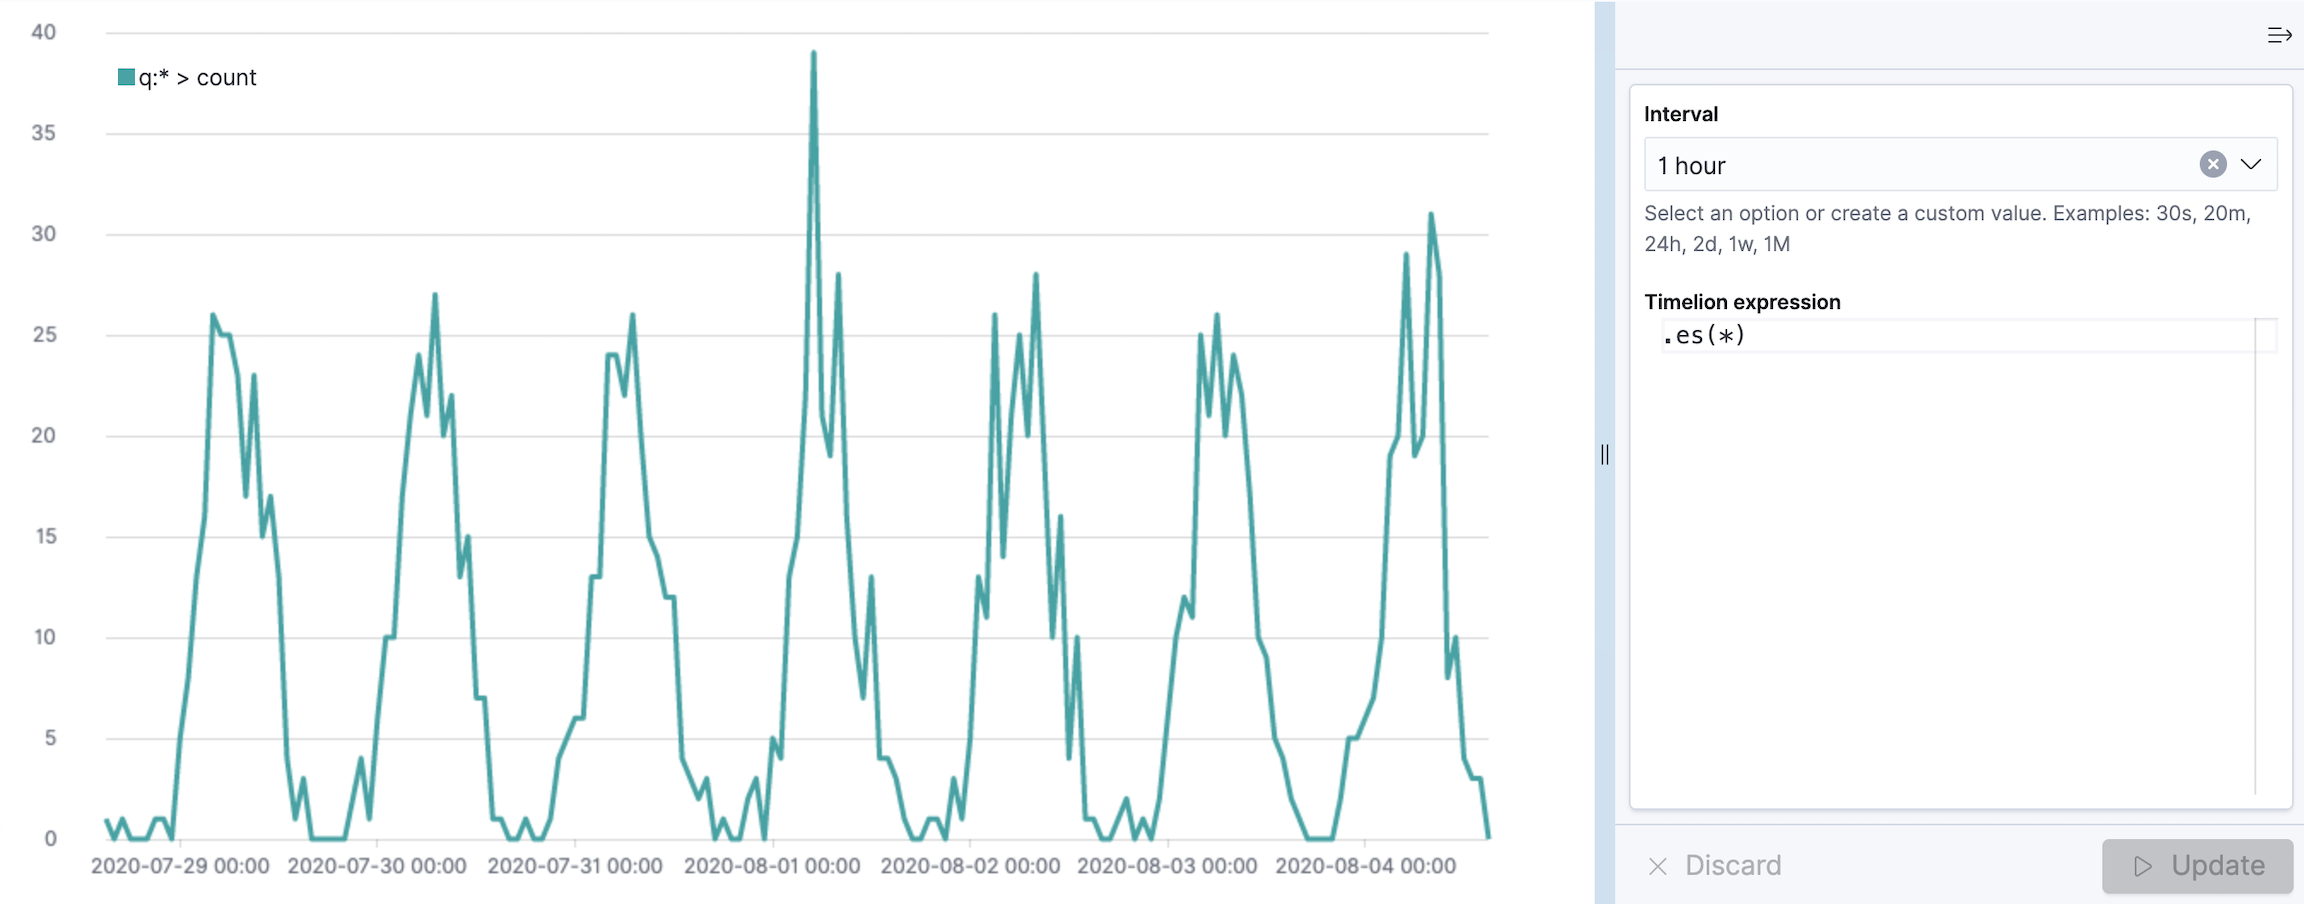
Timelion
editTimelion is driven by a simple expression language that you use to:
- Retrieve time series data from one or more indices
- Perform math across two or more time series
- Visualize the results