Discover
editDiscover
editTell Kibana where to find your data, then search and filter it for hidden insights and relationships.
You’ve added your data, and now you’re ready to dig in. You have questions about your data. What pages on your website contain a specific word or phrase? What events were logged most recently? What processes take longer than 500 milliseconds to respond? This tutorial shows you how to use Discover to quickly search large amounts of data and understand what’s going on at any given time.
You’ll learn to:
- Select data for your exploration, and then set a time range for that data, search it with the Kibana Query Language, and filter the results.
- Explore the details of your data, view individual documents, and create tables that summarize the contents of the data.
- Present your findings in a visualization.
At the end of this tutorial, you’ll be ready to start exploring with your own data in Discover.
Prerequisites
edit- If you don’t already have Kibana, set it up with our free trial.
- You must have data in Elasticsearch. This tutorial uses the ecommerce sample data set, but you can use your own data.
- You should have an understanding of Elasticsearch documents and indices.
Define your goal
editWhen you explore your data in Discover, it’s common to start with one or two goals:
- Get an overview of what is happening. For example, you might look for information on the overall health and performance of your ecommerce business, and then share your findings in a report.
- Find an answer to a specific question. You want to determine your customers' shopping preferences, and then visualize your findings on a dashboard.
For this tutorial, your goal is to better manage your product inventory. You want to know the top-selling products and on what day of the week these products sell the most.
Find your data
editTell Kibana where to find the data you want to explore, and then specify the time range in which to view that data.
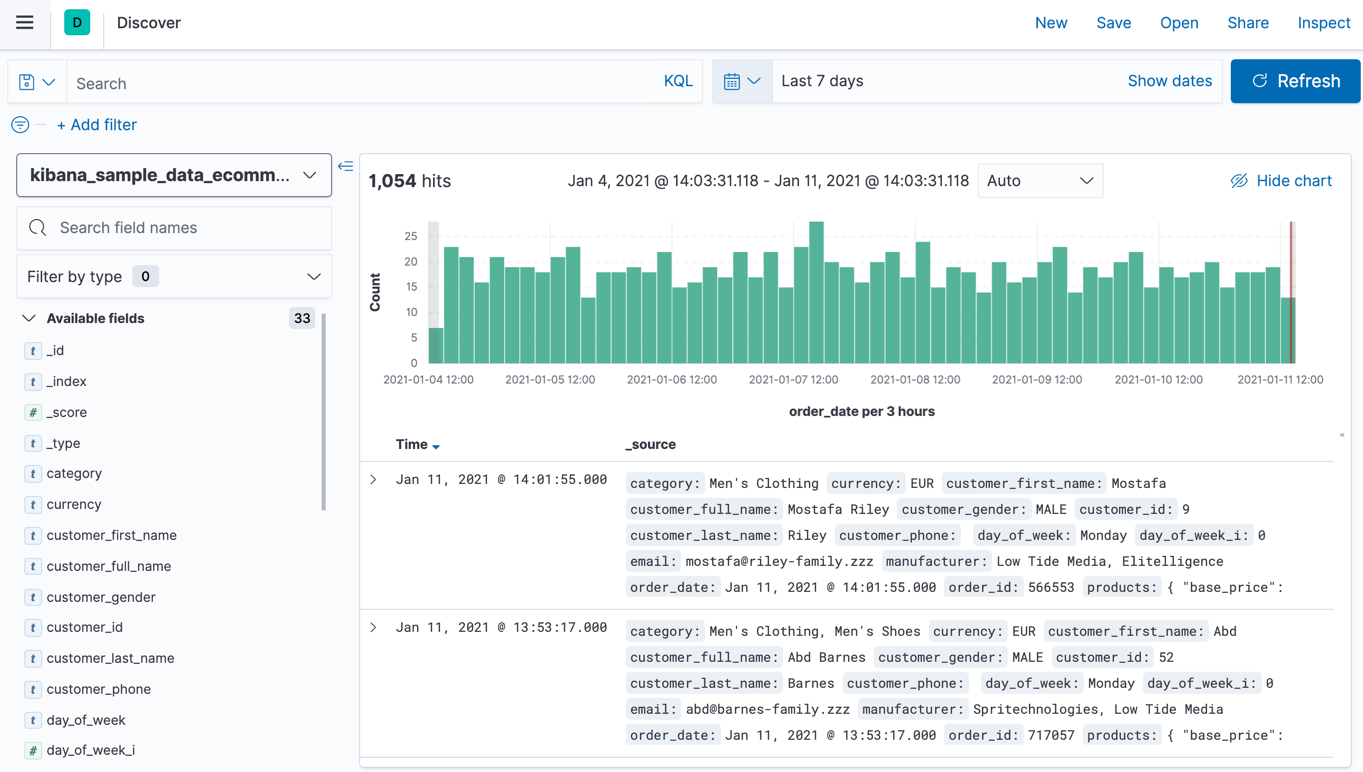
- Open the main menu, and select Discover.
-
Select the data you want to work with.
Kibana uses an index pattern to tell it where to find your Elasticsearch data. To view the ecommerce sample data, make sure the index pattern is set to kibana_sample_data_ecommerce.
-
Adjust the time range to view data for the Last 7 days.
The range selection is based on the default time field in your data. If you are using the sample data, this value was set when you added the data. If you are using your own data, and it does not have a time field, the range selection is not available.
- To view the count of documents for a given time in the specified range, click and drag the mouse over the histogram.
Explore the fields in your data
editDiscover includes a table that shows all the documents that match your search.
By default, the table includes columns for the time field and the document _source,
which can be overwhelming. You’ll modify this table to display only your fields of interest.
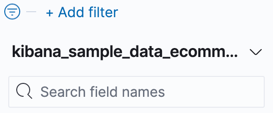
- Scan through the list of Available fields to see what’s in your data. You can also search for a field by name.
-
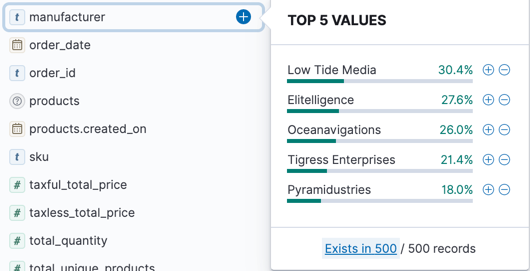
Find the
manufacturerfield, and then click it to view the five most popular values for that field.Discover fetches a maximum of 500 documents, which it uses to calculate the popular values.
-
Click
 to toggle the field into the document table.
-
Add
day of weekso your document table looks like this: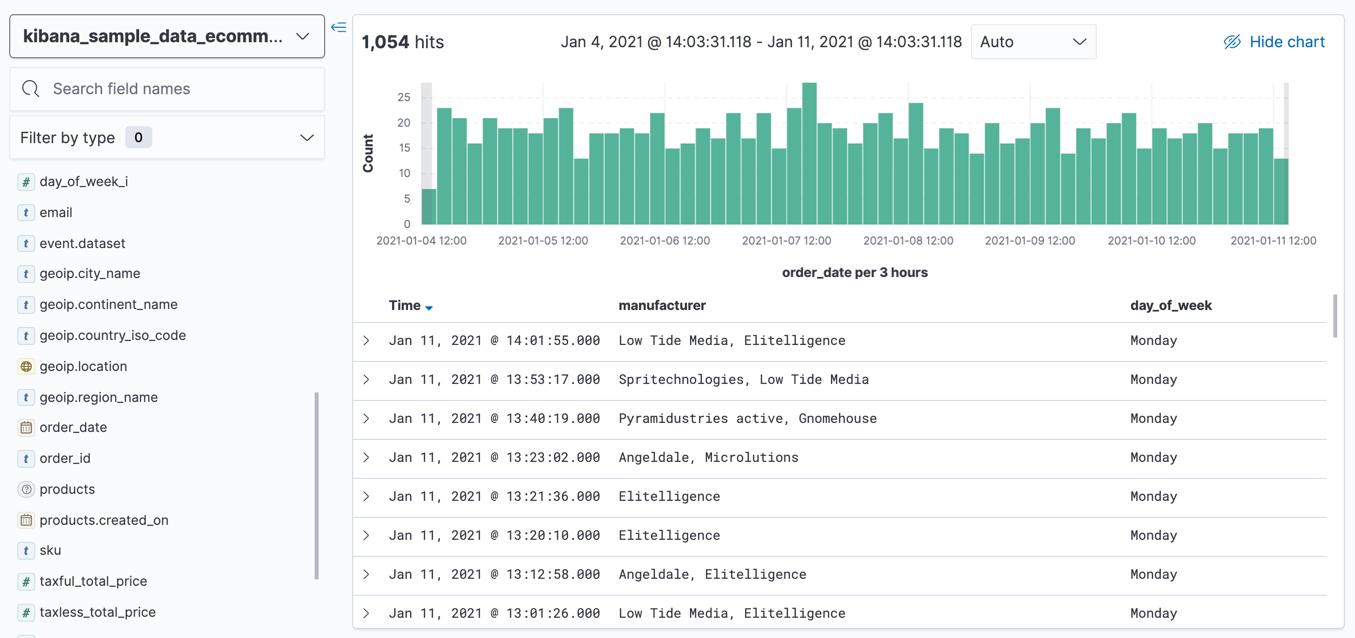
- To rearrange the table columns, hover the mouse over a column header, and then use the move and sort controls.
Search your data
editOne of the unique capabilities of Discover is the ability to combine free text search with filtering based on structured data. To search all fields, enter a simple string in the Search field. To search particular fields and build more complex queries, use the Kibana Query language. As you type, KQL prompts you with the fields you can search and the operators you can use to build a structured query.
Search the ecommerce data for documents where the country matches US:
-
Enter
g, and then select geoip.country_iso_code. - Select equals some value and US, and then click Update.
-
For a more complex search, try:
geoip.country_iso_code : US and products.taxless_price >= 75
Filter your data
editWhereas the query defines the set of documents you are interested in, filters enable you to zero in on different subsets of those documents. You can filter results to include or exclude specific fields, filter for a value in a range, and more. The Add filter popup prompts you with the fields you can filter and the operators you can use.
Exclude documents where day of week is not Wednesday:
- Click Add filter.
- Set Field to day_of_week, Operator to is not, and Value to Wednesday.
- Save the filter.
- Continue your exploration by adding more filters.
- To remove a filter, click the close icon (x) next to its name in the filter bar.
Look inside a document
editDive into an individual document to view its fields and the documents that occurred before and after it.
-
In the document table, expand any document.
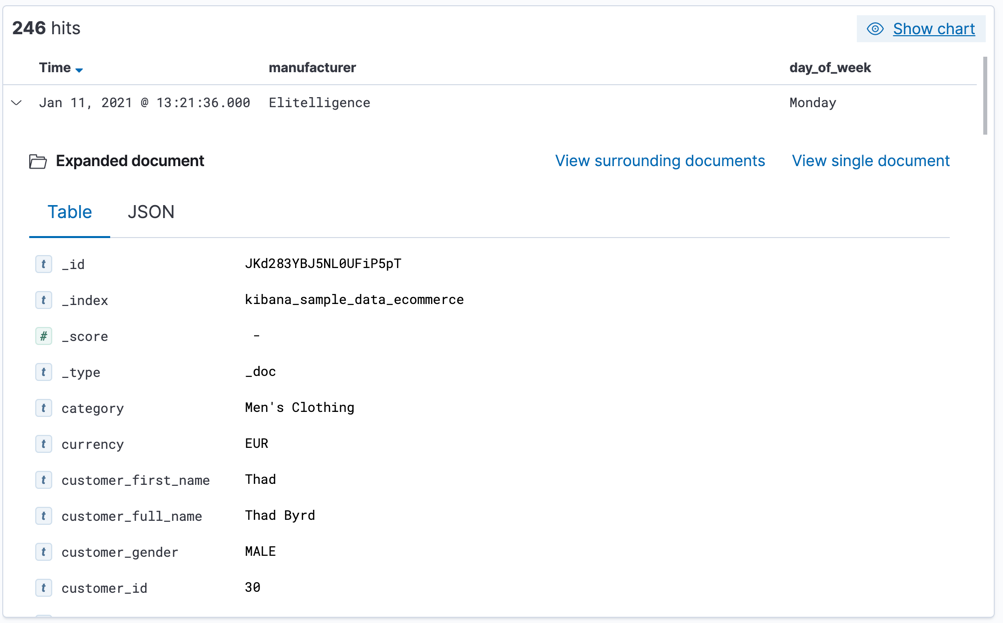
- Scan through the fields and their values. If you find a field of interest, hover of its name for filters and other controls.
- To view documents that occurred before or after the event you are looking at, click View surrounding documents.
-
For direct access to a particular document, click View single document.
You can bookmark this document and share the link.
Save your search for later use
editSave your search so you can repeat it later, generate a CSV report, or use it in visualizations, dashboards, and Canvas workpads. Saving a search saves the query and the filters.
- In the toolbar, click Save.
- Give your search a title, and then click Save.
Visualize your findings
editIf a field can be aggregated, you can quickly visualize it from Discover.
-
From the Selected fields list, click
day_of_week, and then click Visualize.Kibana creates a visualization best suited for this field.
-
Drag
manufacturer.keywordfrom the field list and drop it on the visualization builder pane.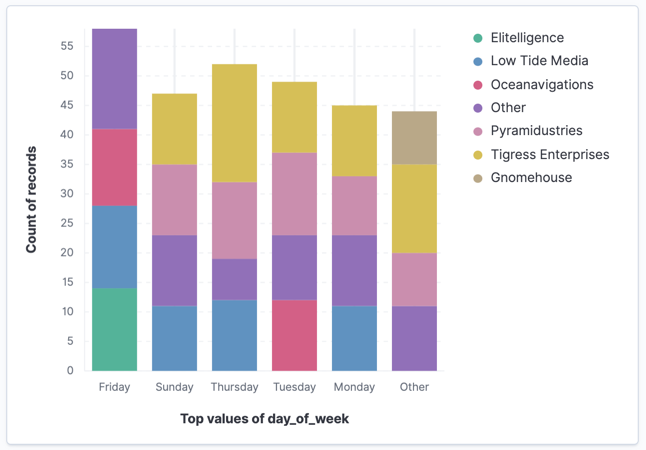
- Save your visualization for use on a dashboard.
What’s next?
edit- Learn more about the structure of a KQL query.
- Configure Discover to better meet your needs. In Advanced Settings, you can configure the number of documents to show, the table columns that display by default, and more.
- Create a dashboard with even more visualizations of your findings, such as treemaps, metrics, and tables.
- Present your findings in a report.