Elastic Uptime Monitoring 7.2.0 released
We are pleased to announce a new release of Elastic Uptime Monitoring, version 7.2.0, available on the Elasticsearch Service, or as part of the default distribution of Elastic Stack. In this release we added location support, so you can monitor and compare your site availability from where it matters most. We had also added bi-directional links between Uptime and Logs, Infrastructure, and APM, to leverage the full observability capabilities of the Elastic Stack.
Location support
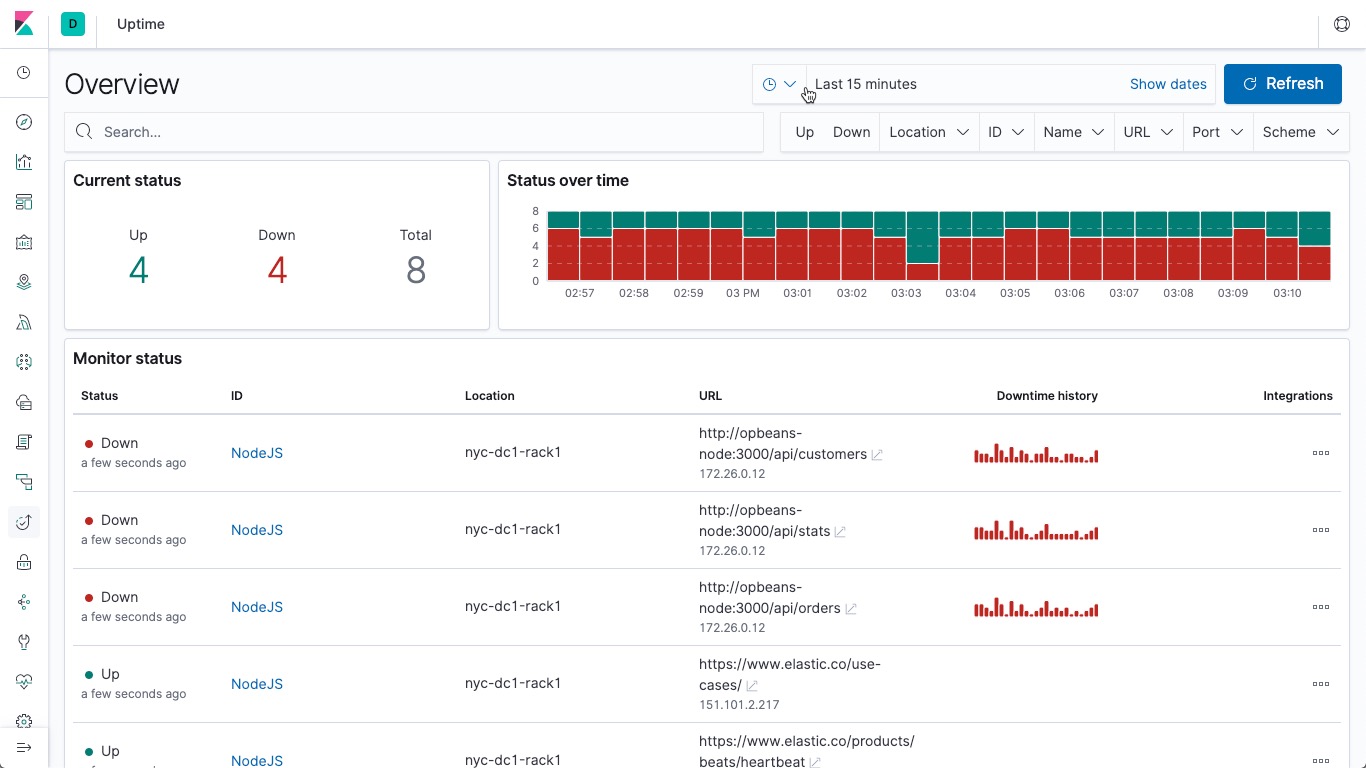
When it comes to monitoring applications with Uptime, users often set up several geographically-dispersed monitors to get multiple perspectives on user experience. To analyze results from status checks from these different locations, it helps to have "location" as first-class meta-data. In 7.2 it is possible to add location information to Heartbeat data and the Uptime app in Kibana, simply by adding these four lines to heartbeat.yml file in the processors section.
processors:
   - add_observer_metadata:
       geo:
         name: Heartbeat_location_name
Once Heartbeat sends its information to Elasticsearch you will immediately see the configured locations on our Overview and Monitor pages in the Uptime app in Kibana.
More information on how to use add_observer_metadata processor can be found in Heartbeat documentation.
Integration with other observability solutions
Got Logs? Metrics? APM Traces? In 7.2, we are doubling down on the value of using all of these apps together, by providing bi-directional links between Uptime and Logs, Infrastructure, and APM apps. These links provide an easy way to navigate to all solutions while preserving the right context.
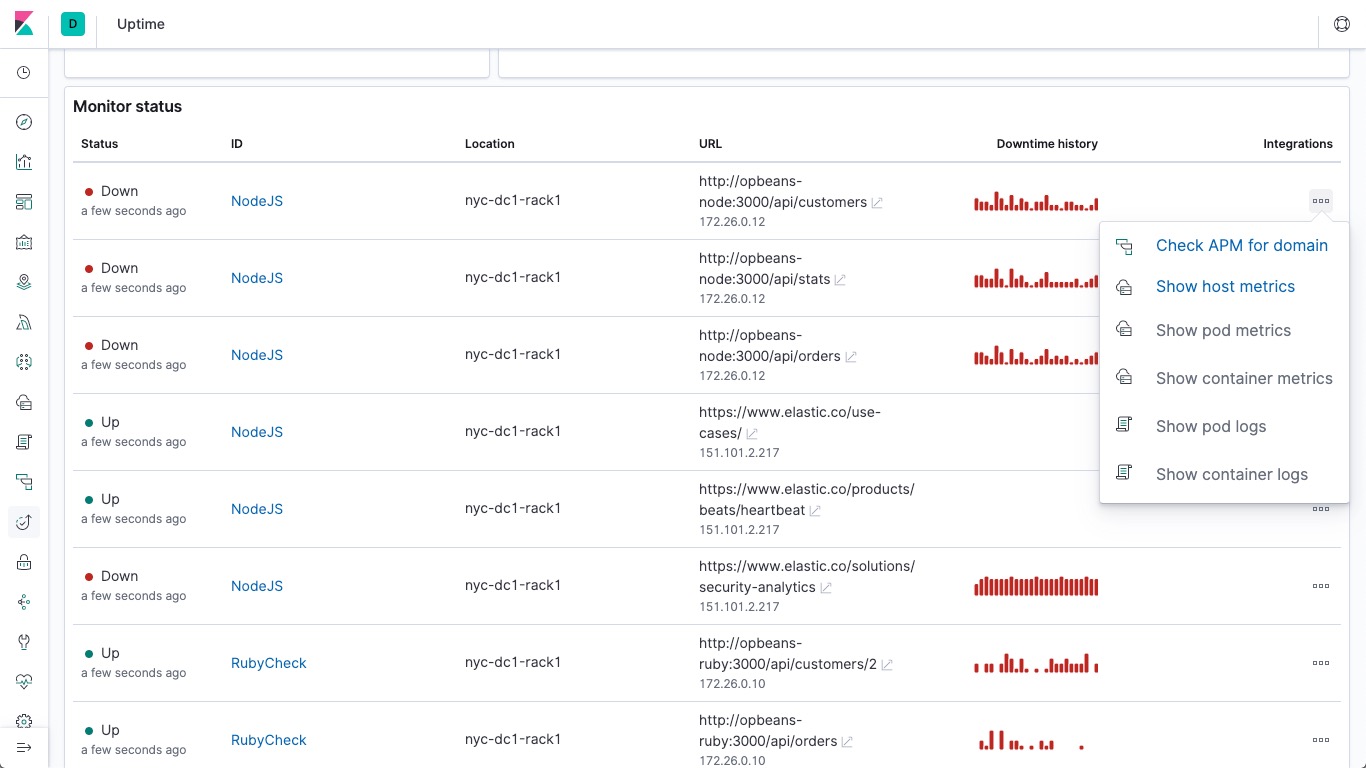
When you start collecting logs, metrics, and APM traces on endpoints monitored by Uptime, you can navigate from familiar Uptime views to the rest of Observability UIs with a single click. This allows you to start with Uptime and expand to leveraging the full observability capabilities of the Elastic Stack for better troubleshooting and root cause analysis.
Ready to see it action?
You can access the 7.2.0 Elastic Uptime application on the Elasticsearch Service on Elastic Cloud, or you can download it as part of the default distribution of the Elastic Stack. Download Heartbeat, follow the instructions on how to set it up, and start monitoring your applications and services today.