Monitor Your System with Metricbeat and Elastic Cloud
Elastic Cloud is the official hosted Elasticsearch and Kibana offering, from the creators of Elasticsearch, Kibana, Beats, and Logstash. This is not the same as Amazon's AWS Elasticsearch Service. You can see details in this post.
Elastic Cloud offers a 14-day free trial. Your email address is all that you need to sign up, no credit card is required.
In this post, we will see how to:
- Create an Elasticsearch deployment in Elastic Cloud
- Add a new user leveraging Elastic security features
- Use Metricbeat to collect system metrics, ship the metrics to the Elasticsearch deployment running in Elastic Cloud, and visualize the metrics in Kibana dashboards that automatically loaded by Metricbeat.
1. Create an Elastic Cloud account
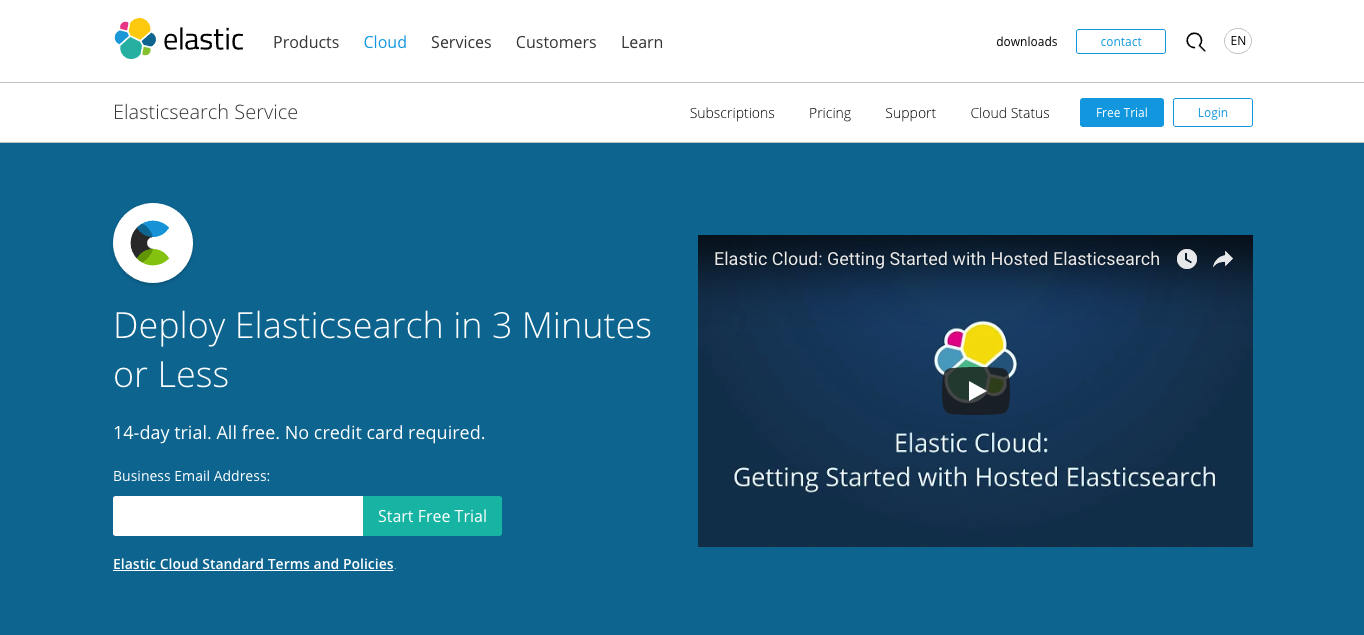
Go to the Elastic Cloud web page. Start an Elastic Cloud Free Trial. Note: You can skip to step 2 if you have already have an Elastic Cloud account.
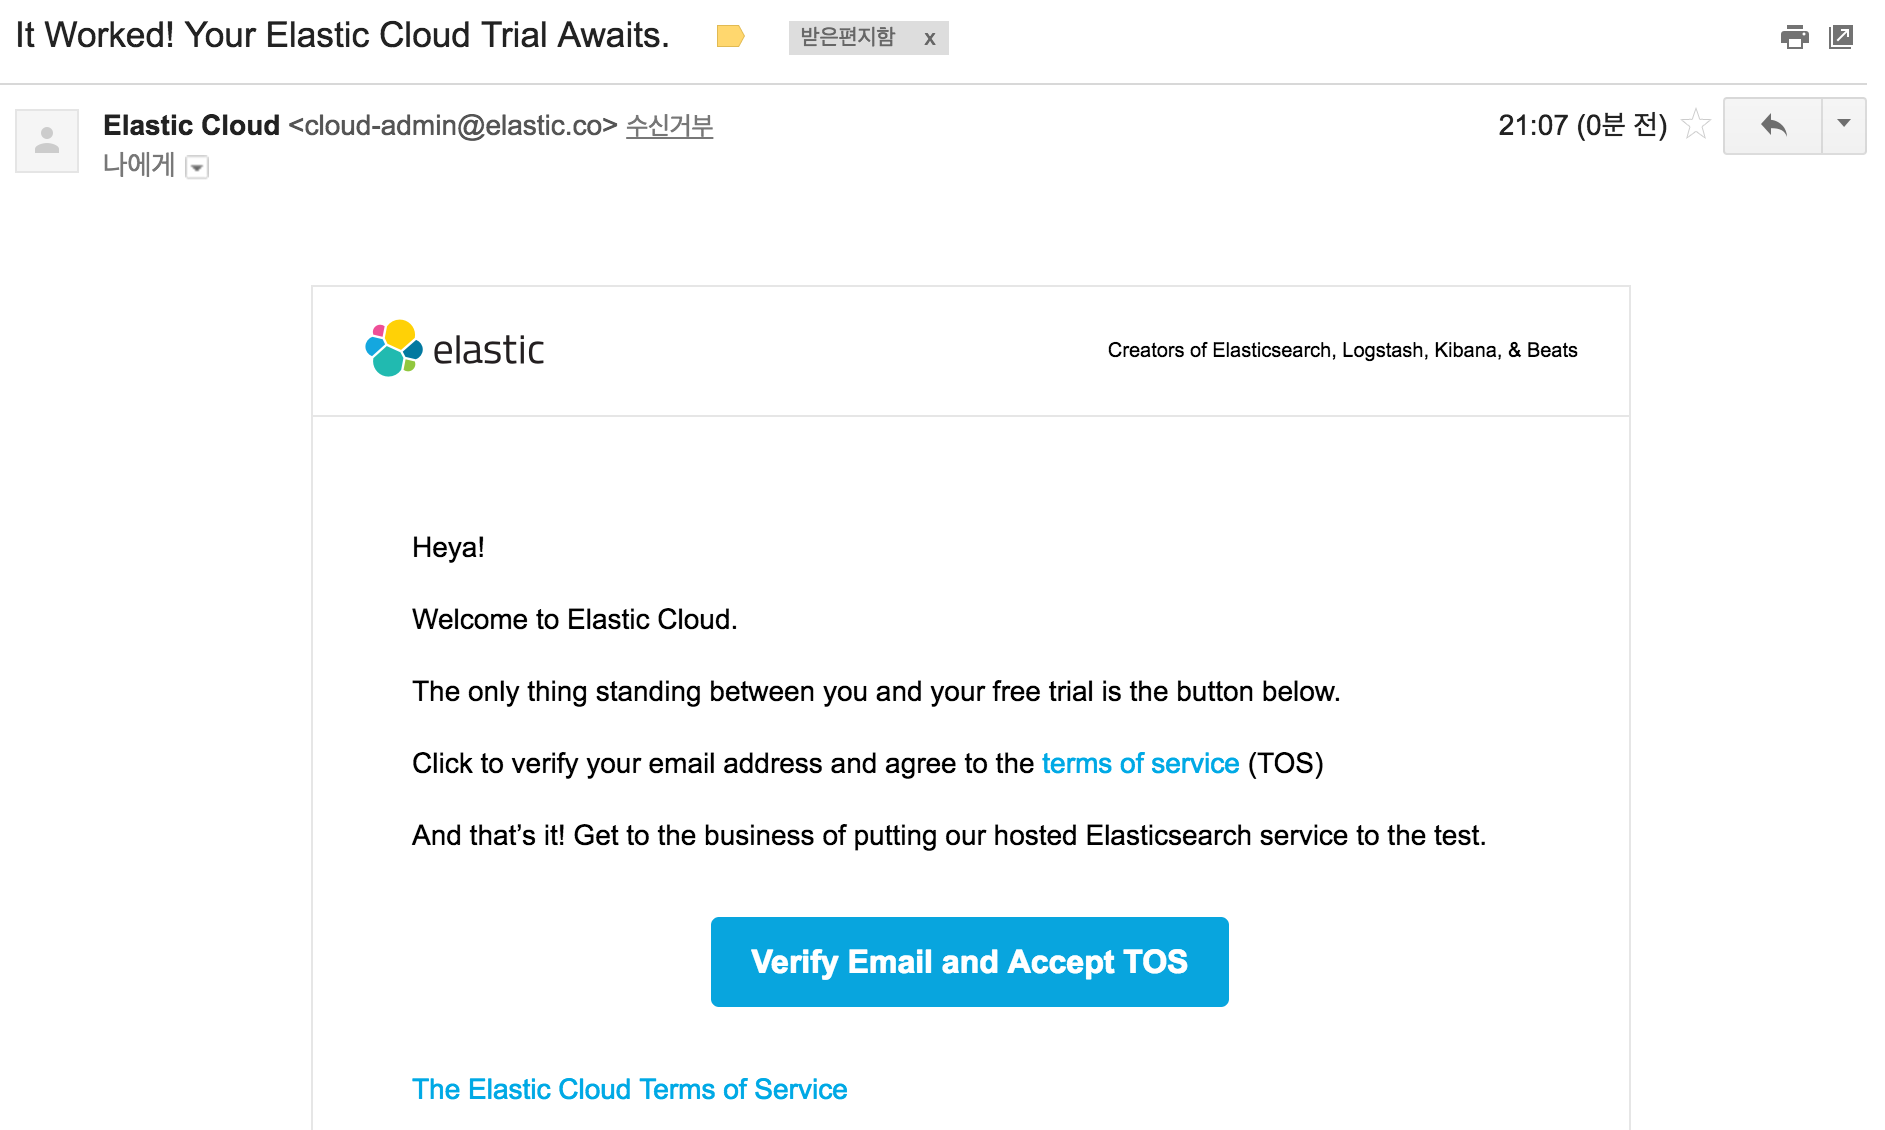
Enter your email address and click the Start Free Trial button. You will receive an email verification message in your inbox. Click the Verify Email and Accept TOS button to continue.
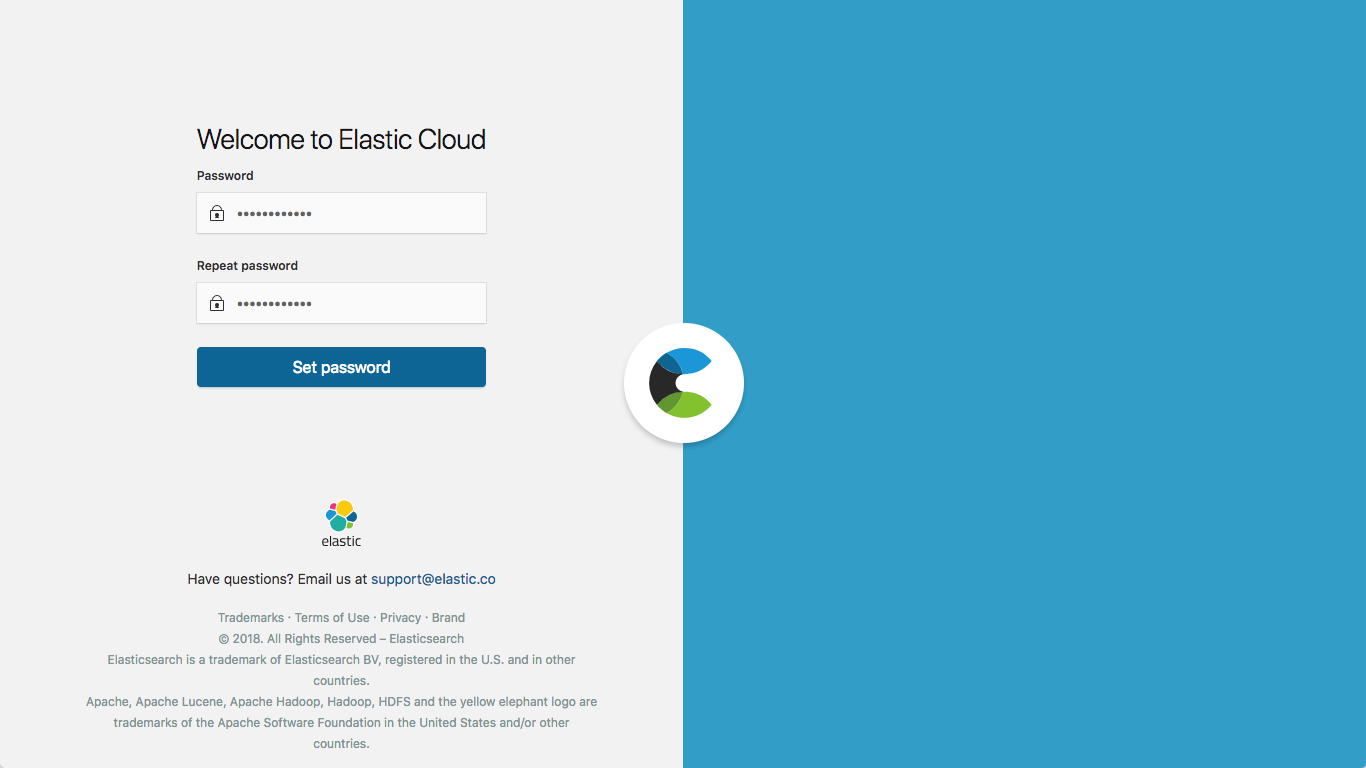
Then set the password for your Elastic Cloud account.
2. Create an Elasticsearch Deployment
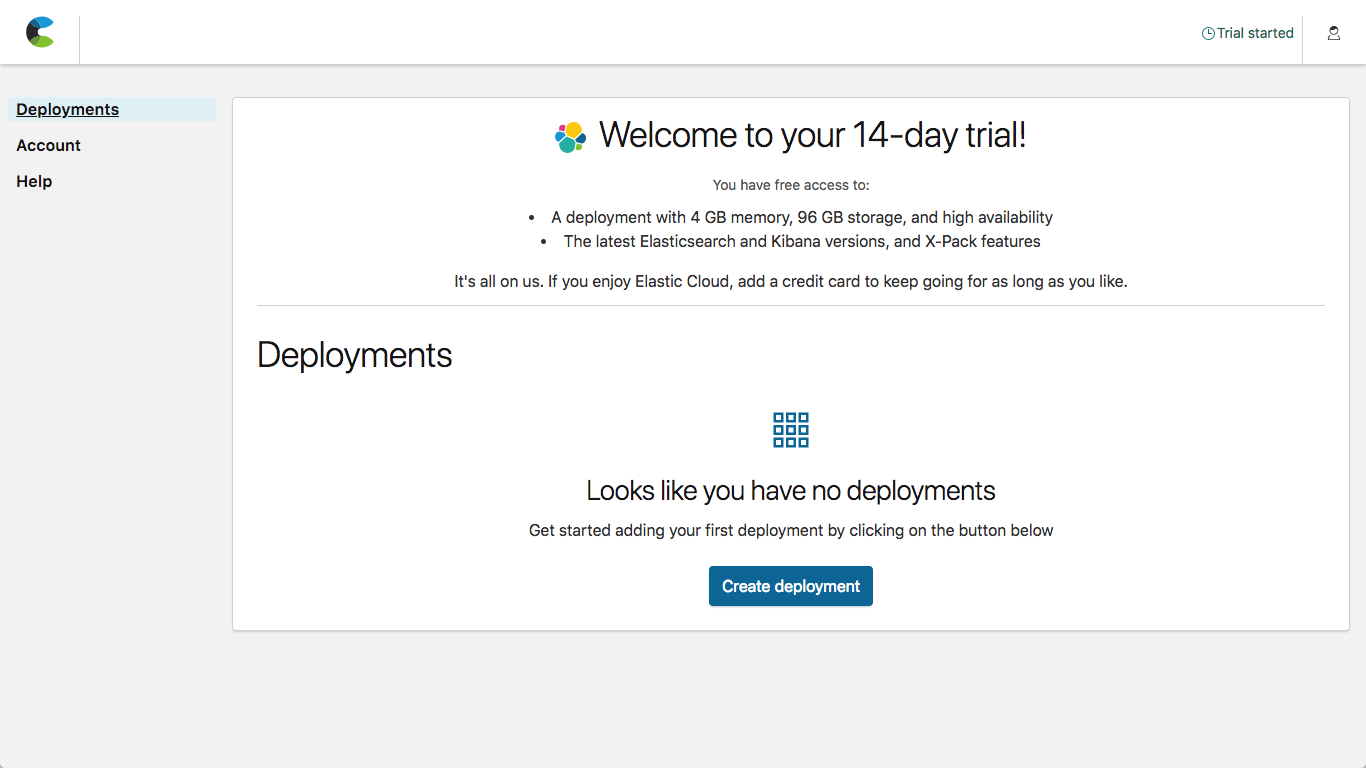
Once you've created your Elastic Cloud account password, it will automatically take you to the Elastic Cloud UI. You can get back later by visiting https://cloud.elastic.co.
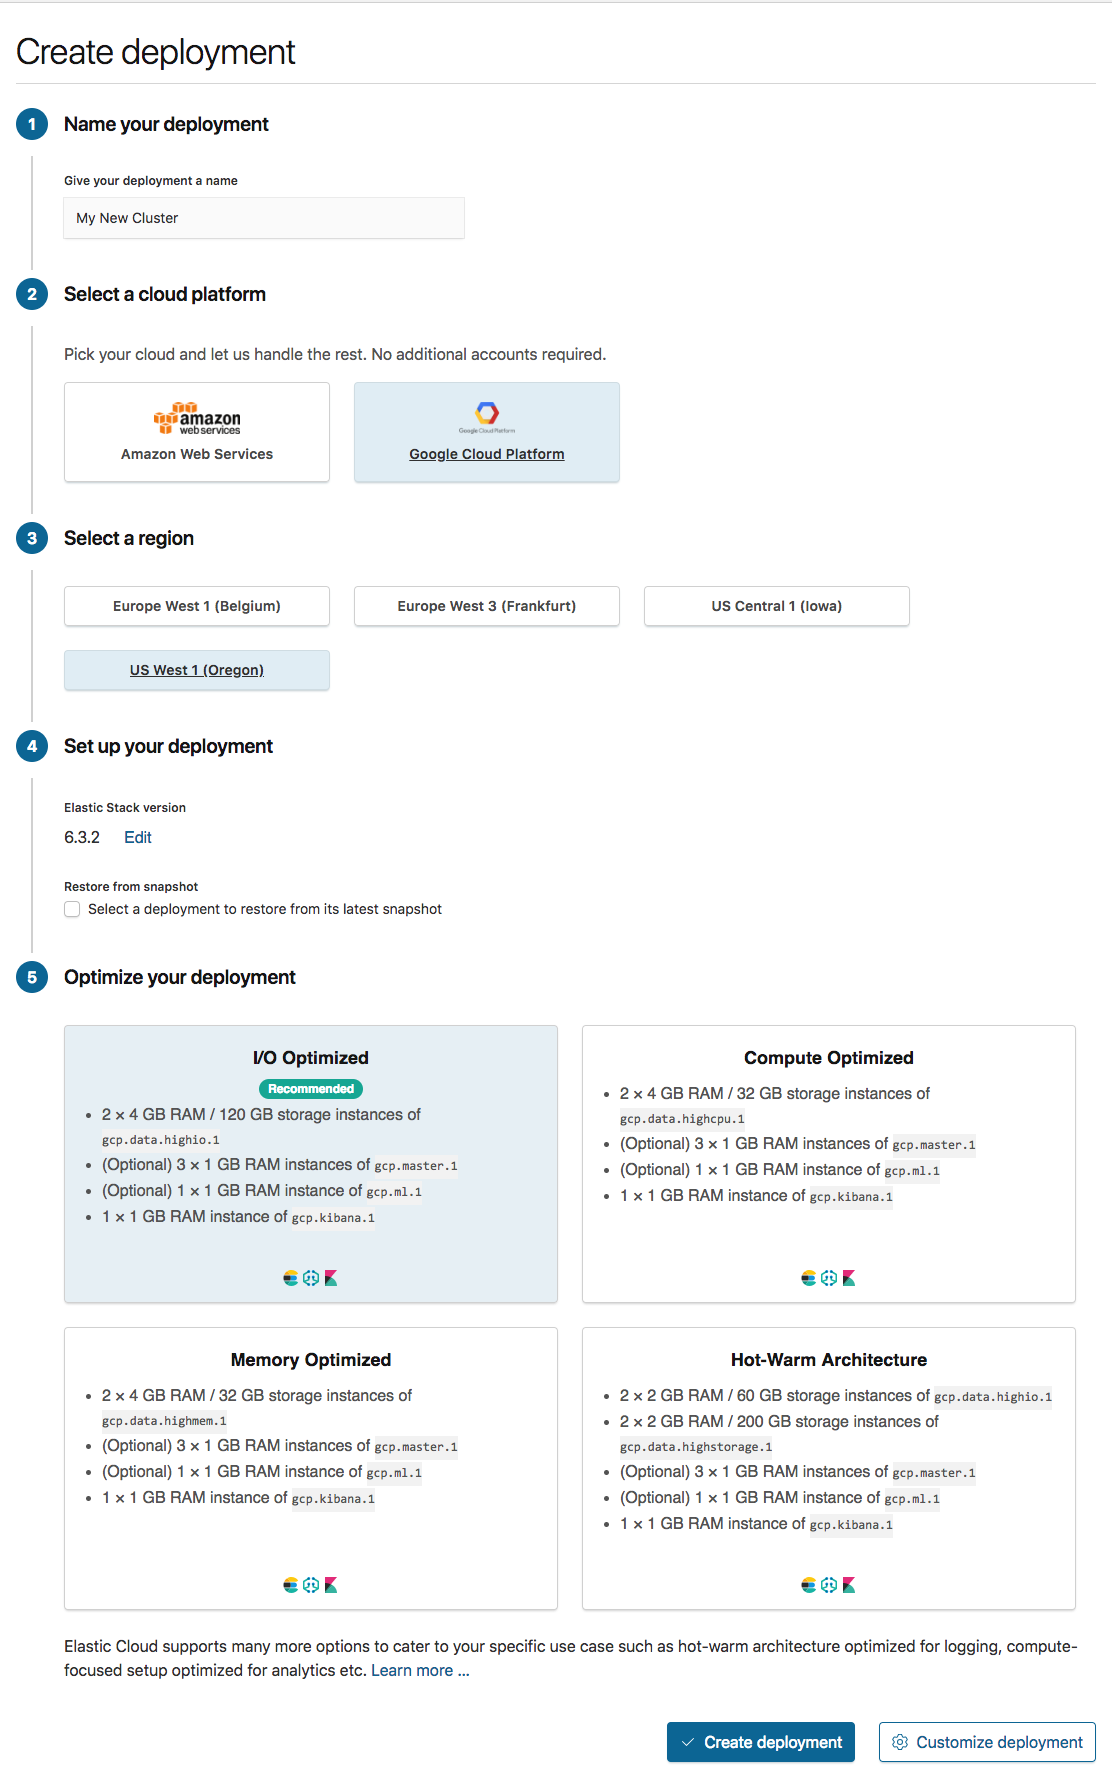
Click on Create deployment to create your first deployment.
Give your deployment a name, then choose the provider, region, and version for your deployment. The latest version of the Elastic Stack is available the day they are released. You also have the option to select different deployment templates. You can optionally customize your deployment, including the number of nodes and zones, along with the amount of RAM (if you are on the trial it selects the size for you). It's fine to stick with the "I/O Optimized" template, then click Create . While creating your Elasticsearch deployment you have the option to view the details of the provisioning status.
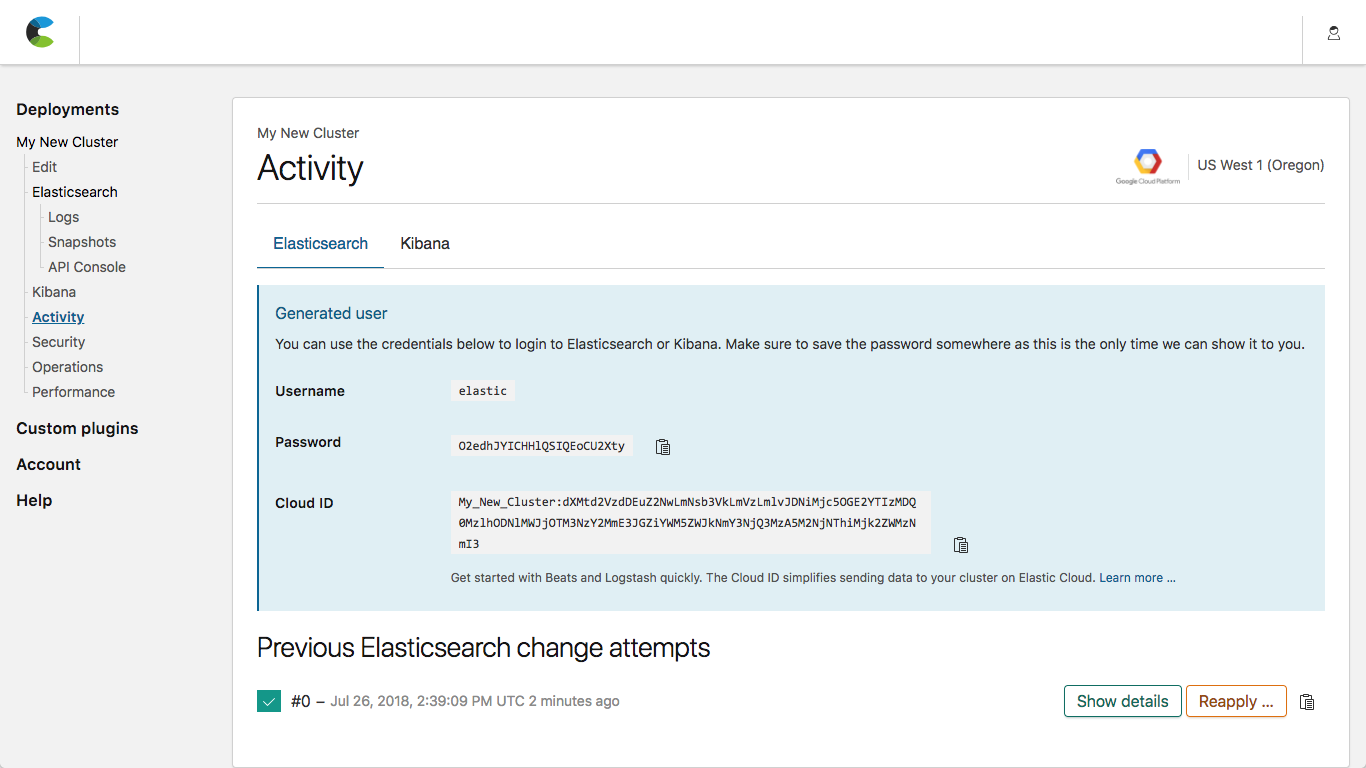
Once you've finished creating your Elasticsearch deployment it will show the generated password for the superuser, elastic. You will not be able to come back to this password again, so copy it somewhere safe.
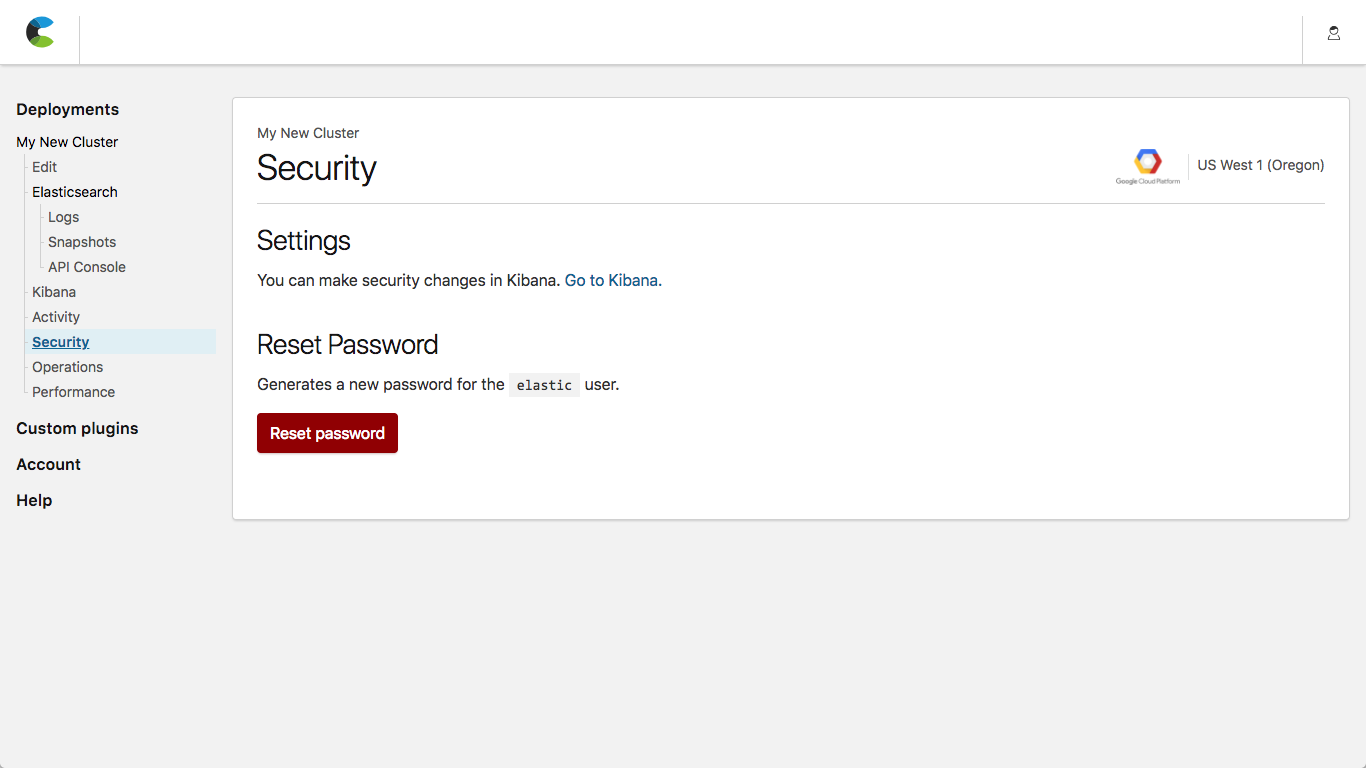
If you lose the password, you can reset it from the Security menu in the Elastic Cloud console.
Navigate to the Overview menu by clicking on your deployment's name in the left sidebar (if you didn't give it a name it generated one for you).
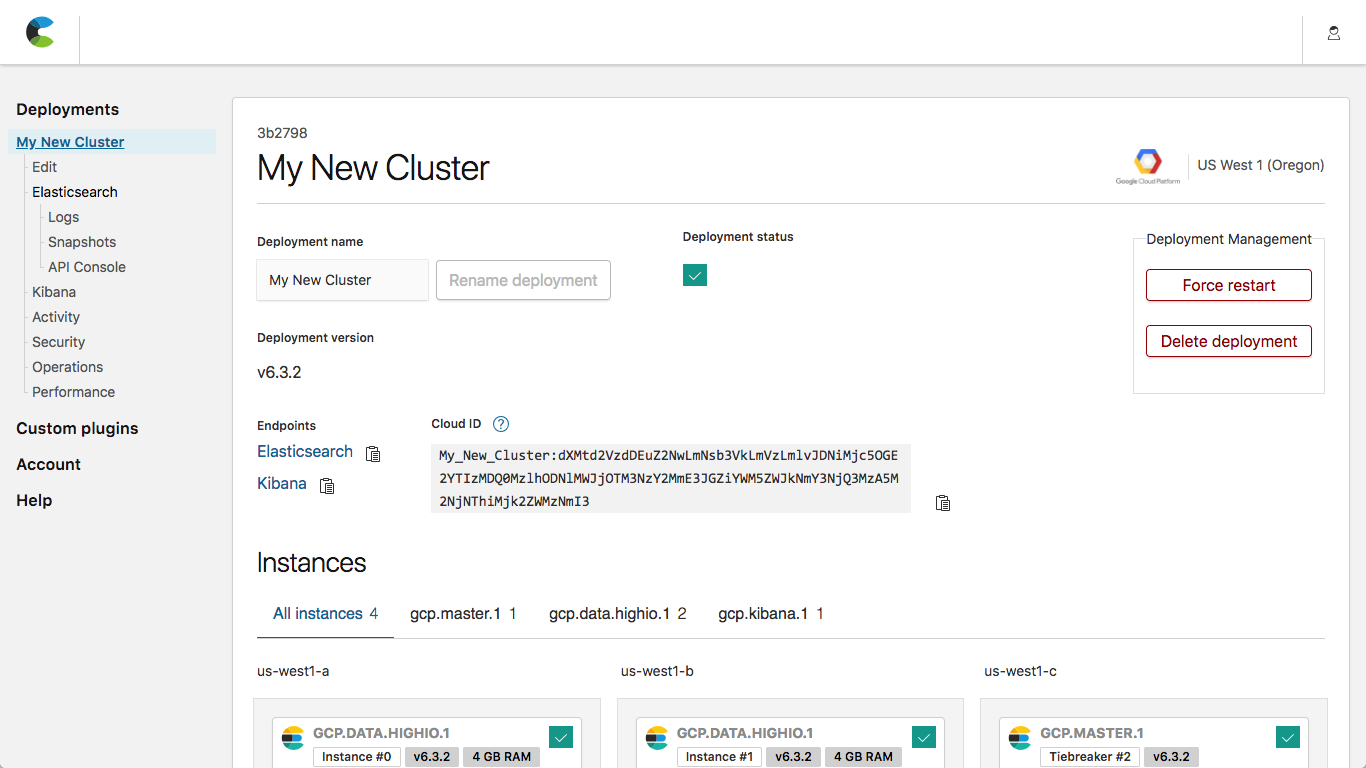
This has your your Elasticsearch and Kibana access URLs, along with a clipboard icon to quickly copy them.
3. Create a new superuser
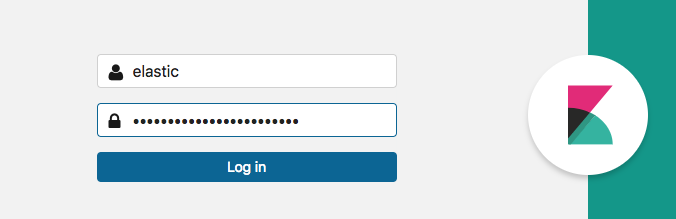
Click on the Kibana URL, which will take you to the Kibana login screen. Use elastic for the user, along with the automatically generated password (which you copied somewhere safe) to log in.
Elastic Cloud includes several helpful features, such as security and monitoring.
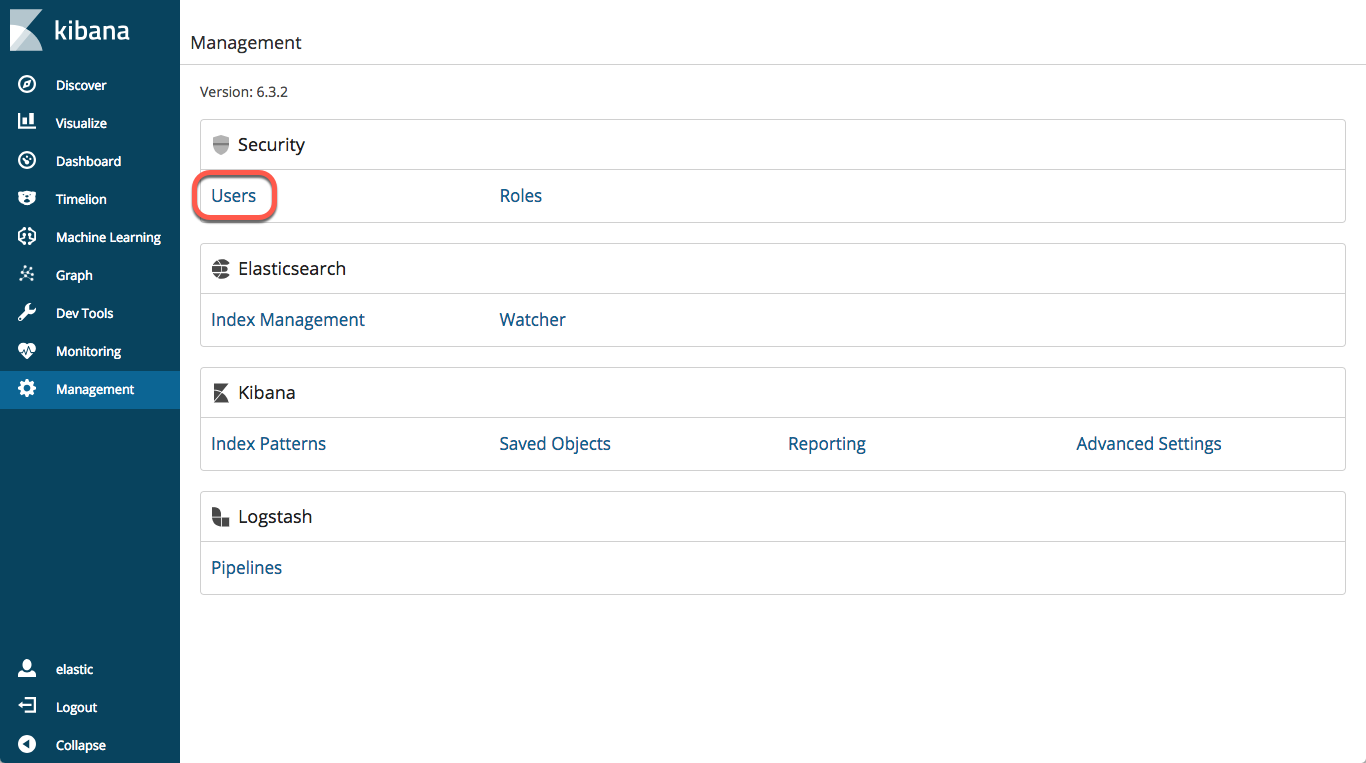
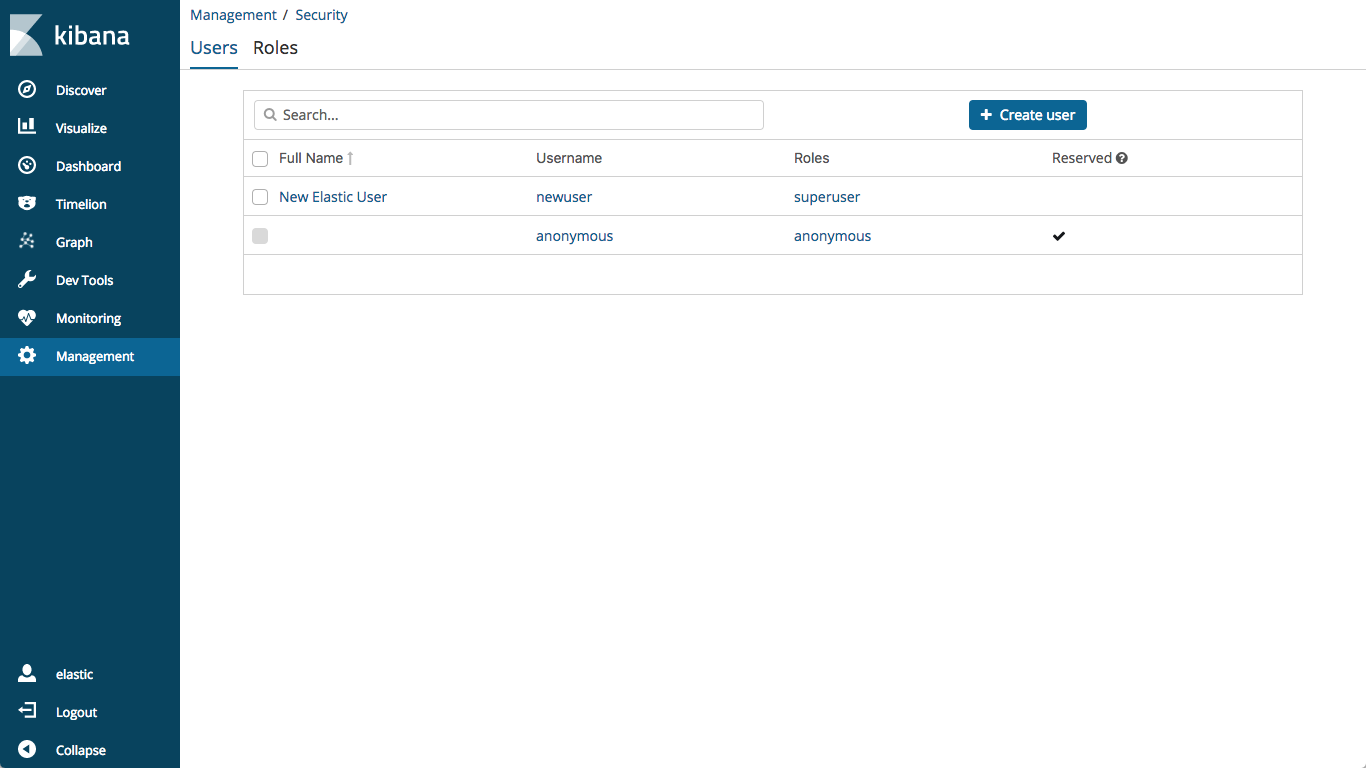
If you prefer to use a more familiar username and password, you can create a new superuser using the Role Based Access Control functionality. Visit the Management tab, and select Users in the Security section:
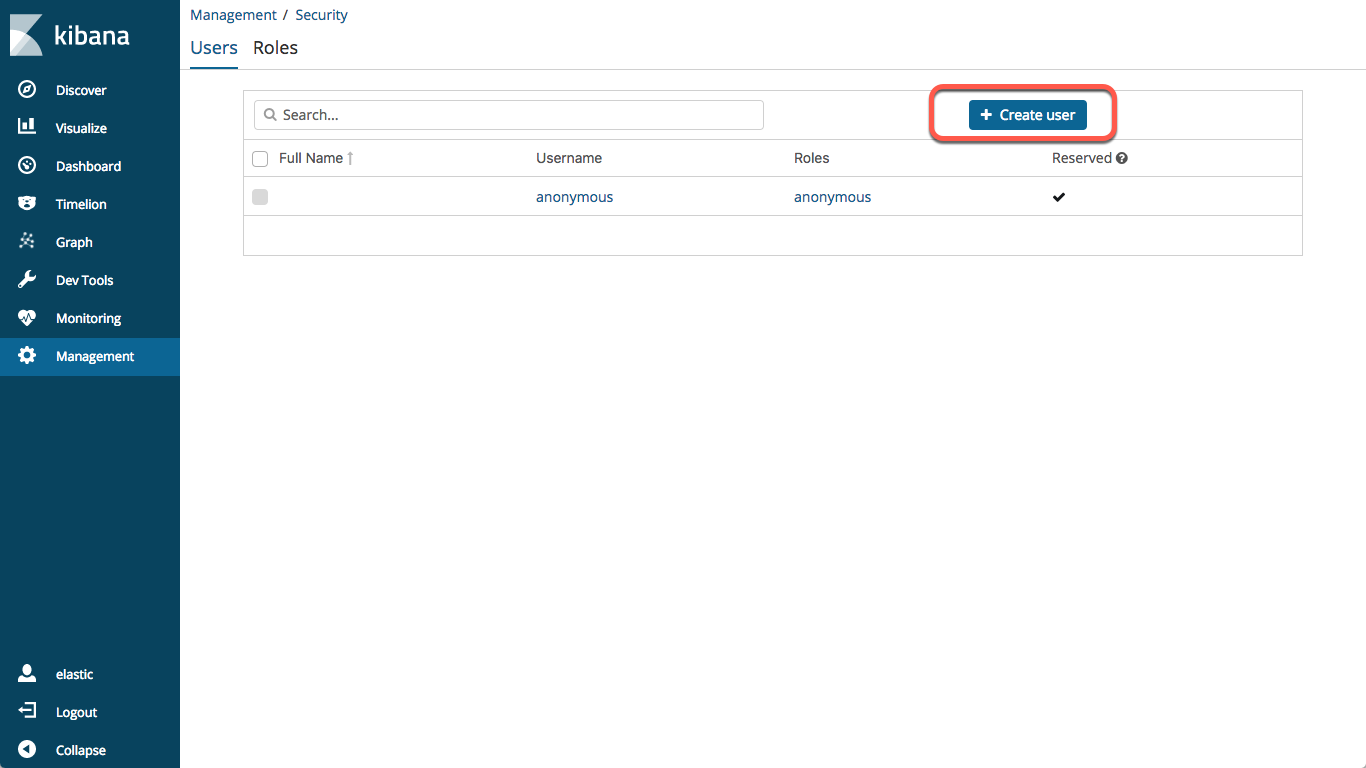
Click the + Create User button.
Fill in the username, password, full name, email, enter superuser for the Role, and save the new user.
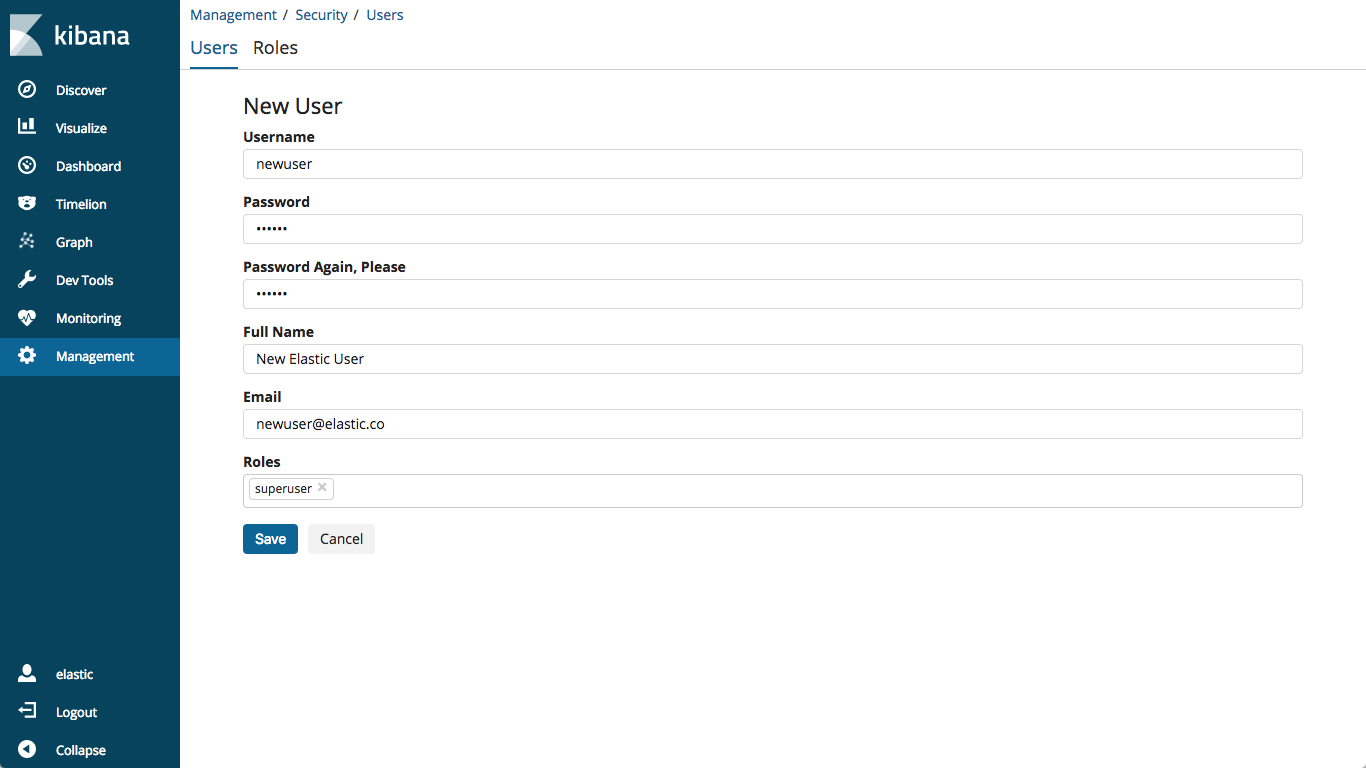
This will create your favorite new superuser account
Try to log out and log back in with your new account to make sure everything works (if not you can still log in as elastic).
4. Configure and run Metricbeat
Now that we have Elasticsearch and Kibana configured, let's send some data its way. In this tutorial, we will use Metricbeat for this purpose.
Kibana has a great new set of instructions to help you get different kinds of data into your Elastic Cloud deployment.
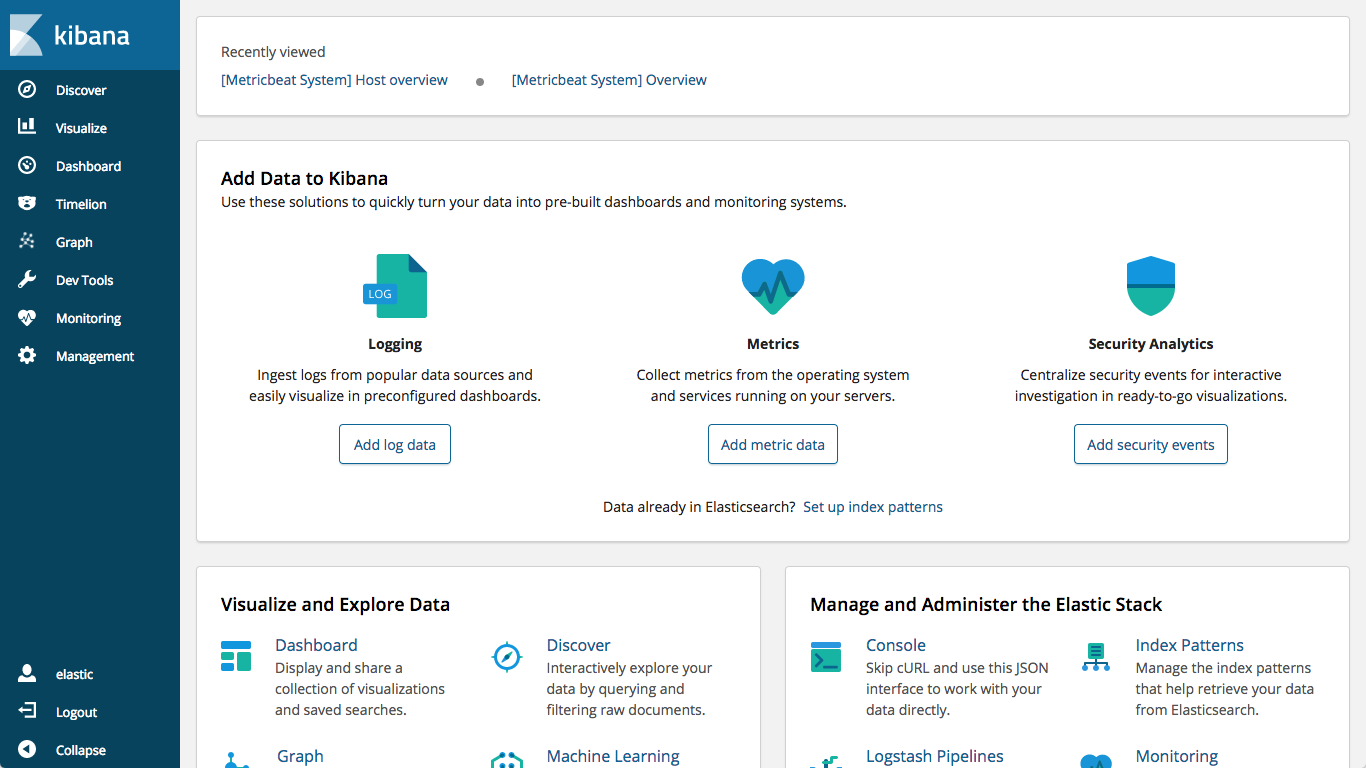
We will walk through the "Metrics" path and use our newly created user. Click on the "Add metric data":
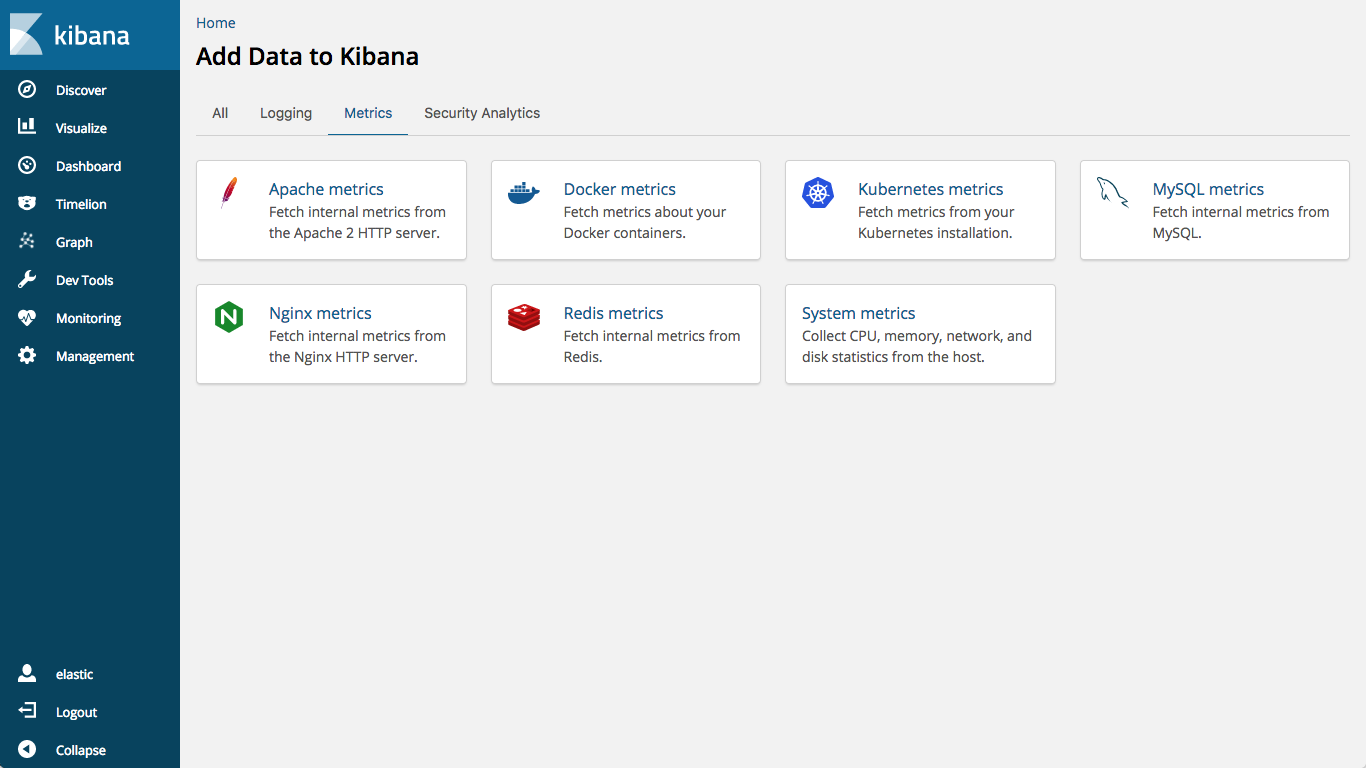
then "System metrics" to see the steps that we will be following
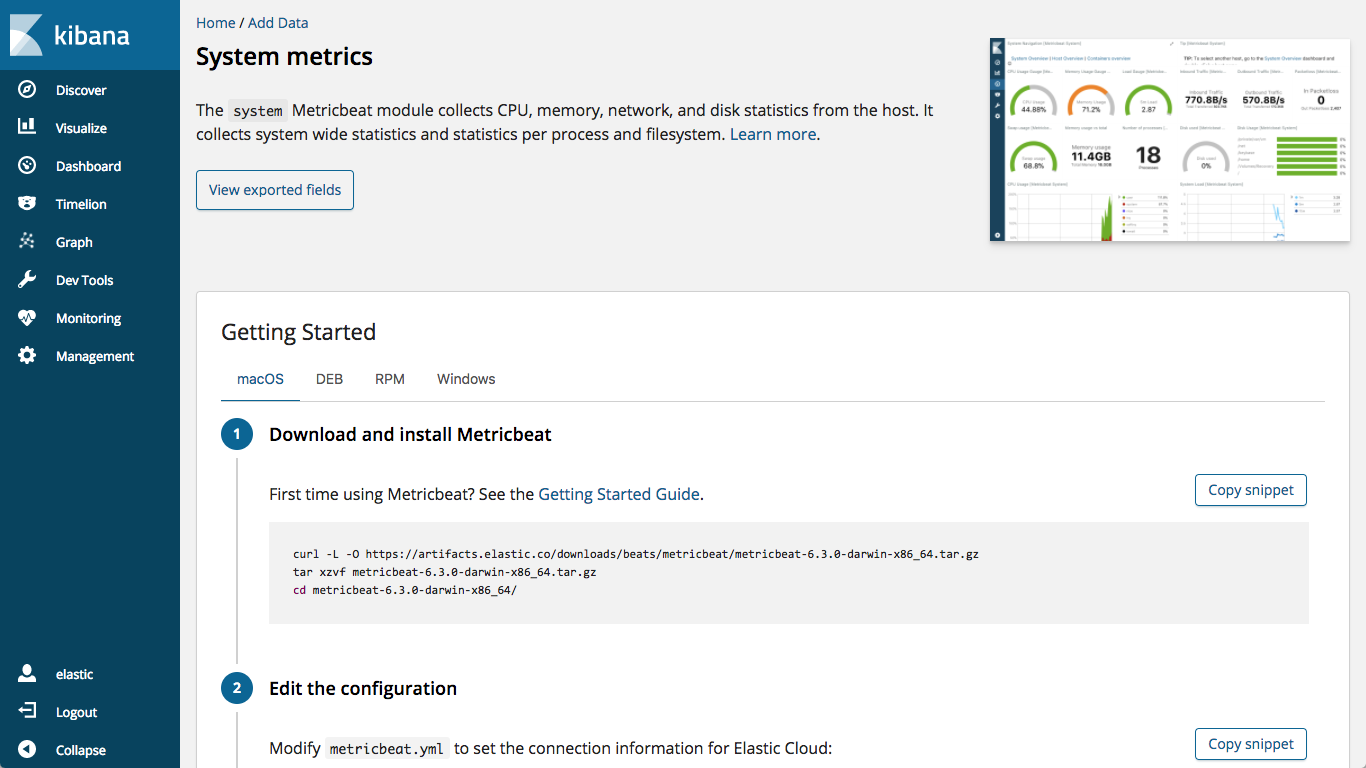
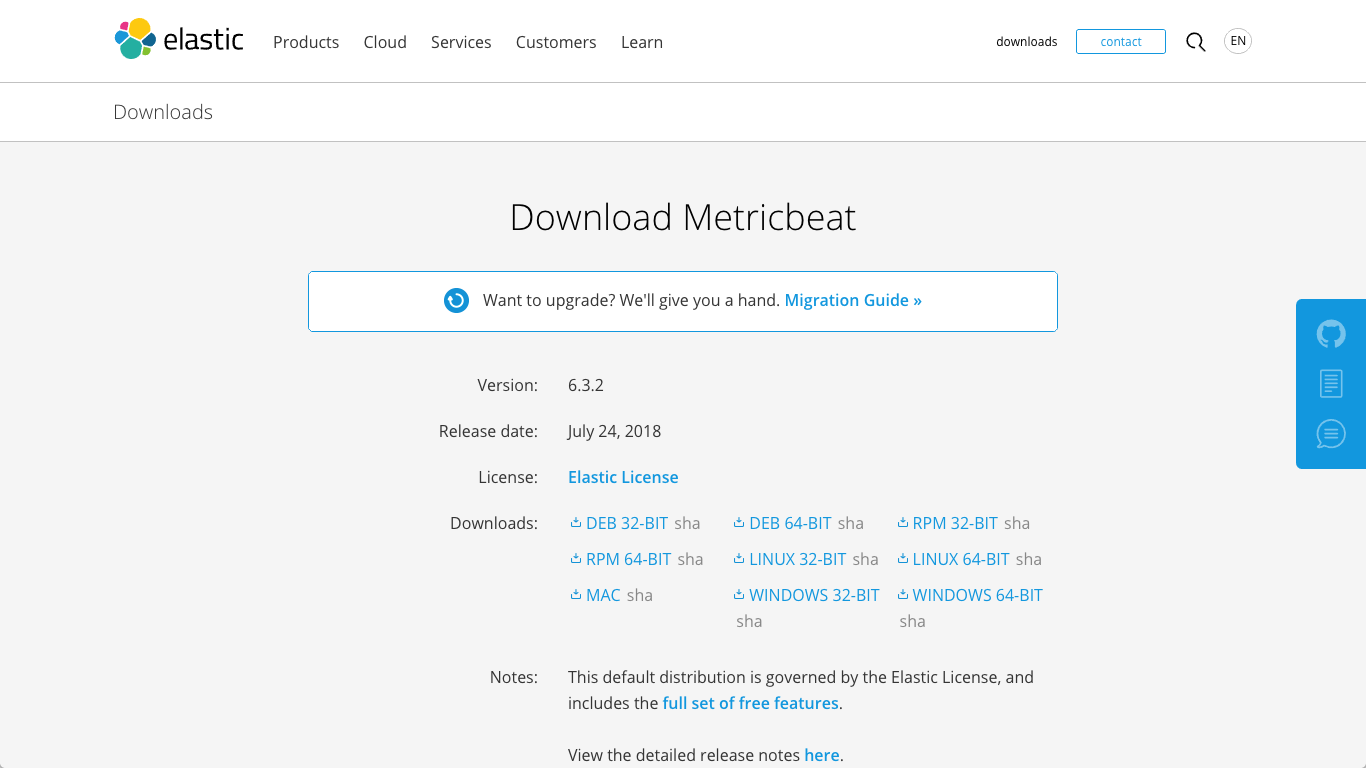
Metricbeat collects various kinds of metrics from your system and ships them to your Elasticsearch deployment. It runs as a Binary file, so you will have to download the correct file for your operating system.
You can download using curl as described in the instructions, or you can visit the Metricbeat download page to download the correct binary for your OS. Once you have it, unpack it.
Once unpacked, you will find several files in the metricbeat directory:
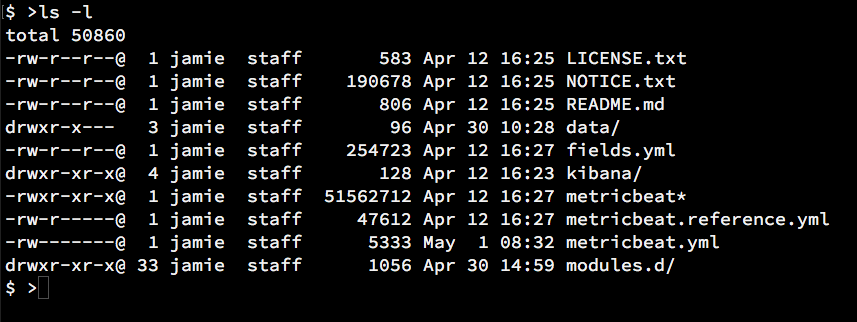
The file metricbeat (or metricbeat.exe for Windows OS) will start your Metricbeat. The default configuration is set to send data to Elasticsearch running at http://localhost:9200 by default, so we will have to change the configuration to send it to our Elastic Cloud deployment.
Open metricbeat.yml with your favorite code editor.
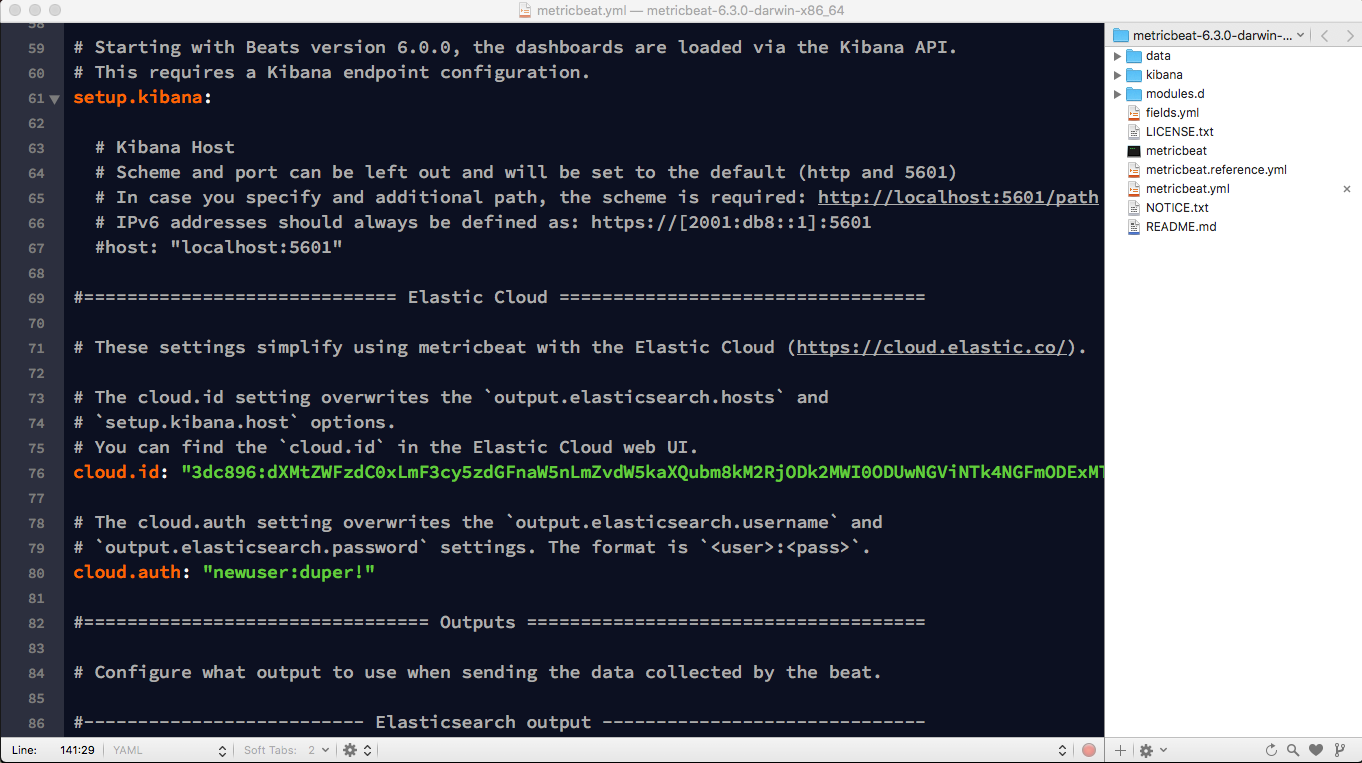
You have to change configuration similar to the above. The configuration is easy using Elastic Cloud, we can simply use the Cloud ID to connect.
Uncomment #cloud.id and enter the Cloud ID from the deployment overview page.
cloud.id: "My_Cluster:dXMtZWFzdC0xLmF3cy5zdGFnaW5nLmZvdW5kaXQubm8kYzQ…"
Then uncomment #cloud.auth and enter your newly created username and password (if you skipped the user creation you can use elastic and the auto-generated password).
cloud.auth: "newuser:<supersecretpassword>"
Be careful with yaml grammar, you have to use the right spacing on each line. in this case, neither of the cloud fields should be indented.
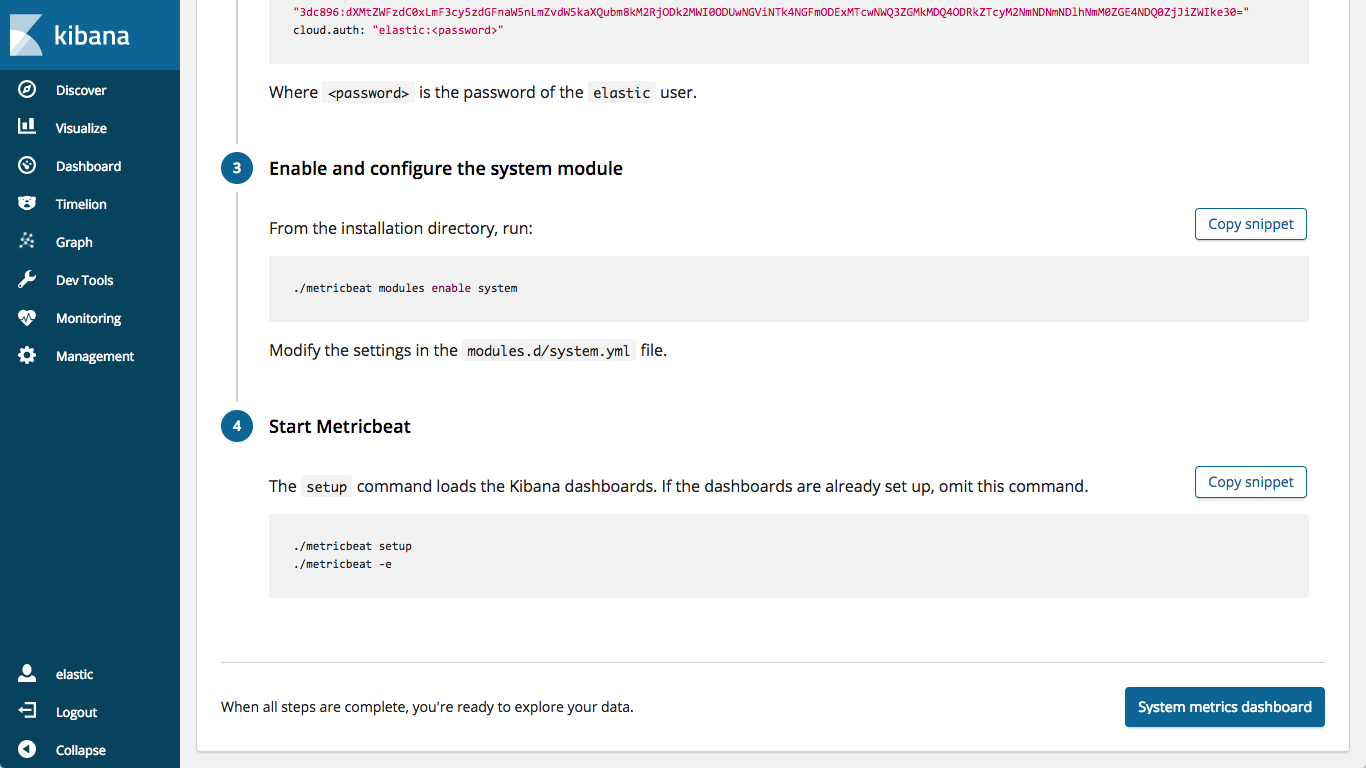
Save the metricbeat.yml file. Then run metricbeat, supplying the -setup option, which will tell the system to load the default metrics dashboards to Kibana.
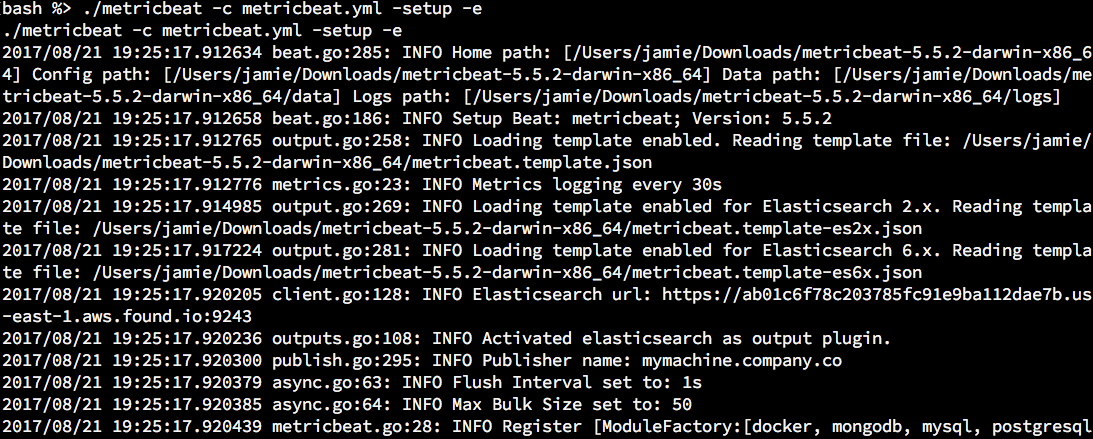
TIP: if you add the -e option when running Metricbeat you can see the logs while running.
5. Check the Metricbeat dashboards
We added the -setup option when we started Metricbeat, so it automatically loaded the Metricbeat dashboards and visualizations to Kibana. The System metrics instructions has a handy link at the bottom to take us to the system overview:
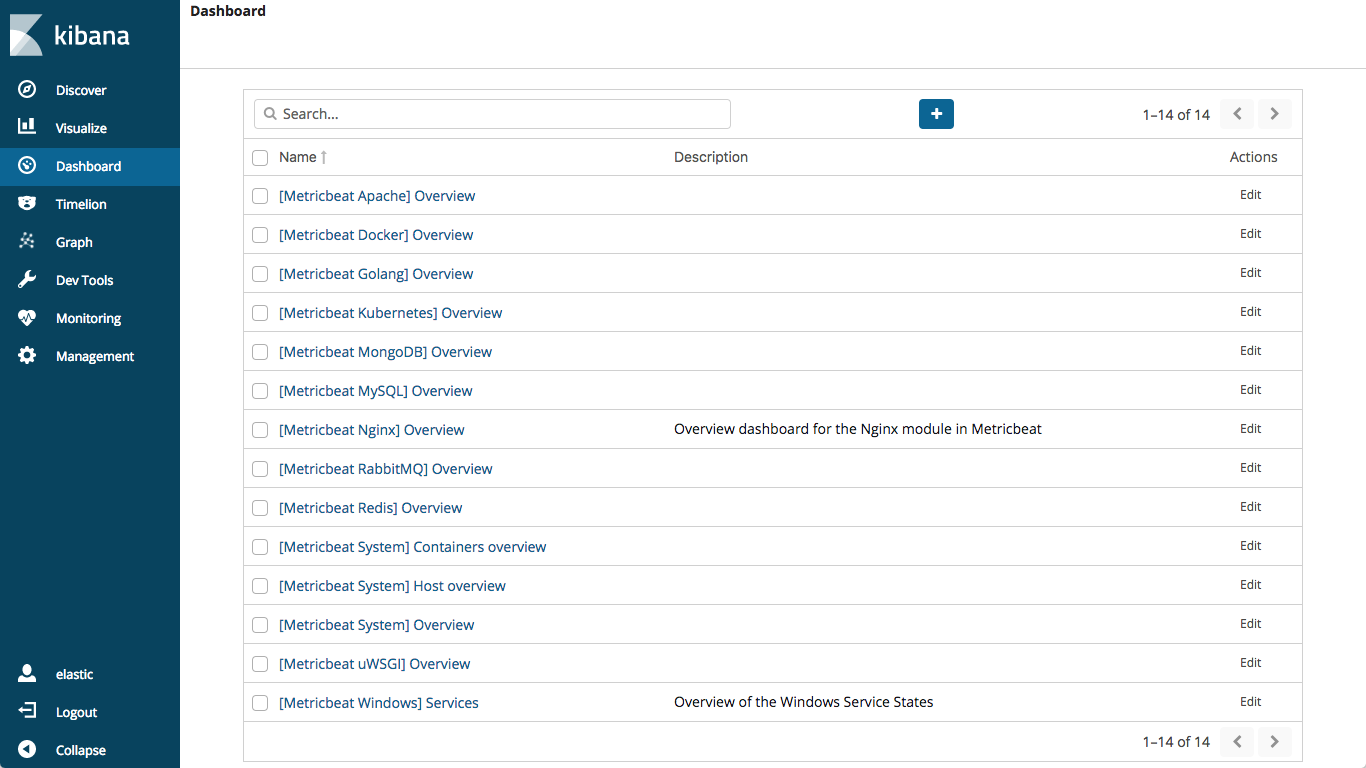
Or you can go click on the "Dashboard" tab in the sidebar to see all of the different types of dashboards that ship with Metricbeat:
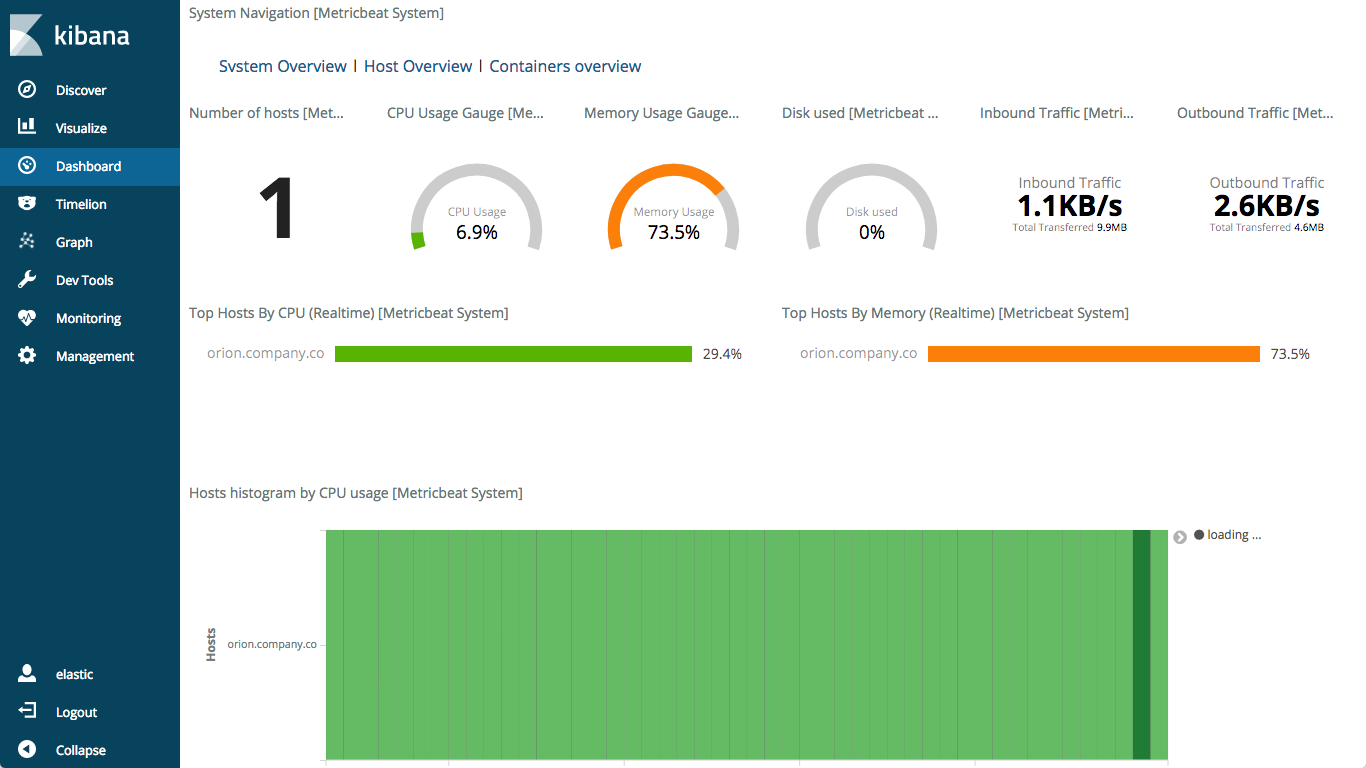
Verify that your systems metrics are being delivered to Elasticsearch, with a system overview:
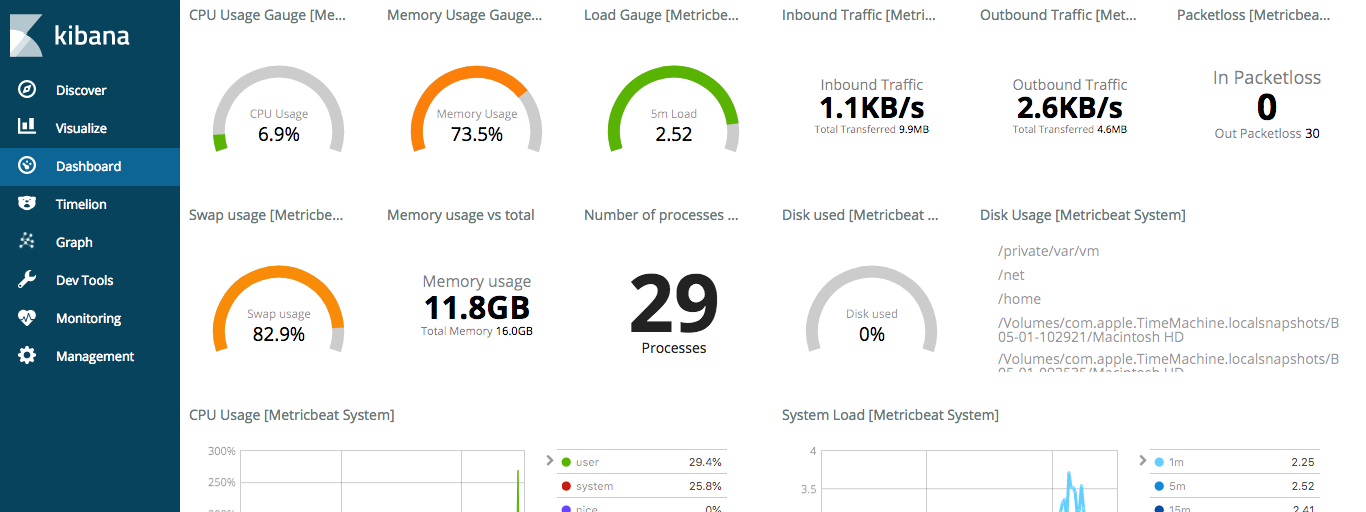
and a host overview:
Now that you have seen how it works, you can deploy Metricbeat to your other systems. Give it a try!