Kibana and a Custom Tile Server for NHL Data
| Note: For a more detailed and flexible approach using geo-referenced vectors, the reader should follow the steps outlined in this blog post. |
The National Hockey League (NHL) provides public access to each game’s play-by-play data, in convenient JSON format (see sample doc* for 1 game), which we can ingest into Elasticsearch with minimal effort. In this blog post, we will explore approximately 73 thousand plays made (so far) in the 2016-2017 NHL Season.
Each play contains the following information:
- Time of Play
- Type of Play (Goal, Shot, Hit, Penalty, Fight)
- Who made the play
- Who else was involved in the play
- Who was on the ice at the time of the play
- X,Y coordinates of play location on the ice.
- A text description of the play.
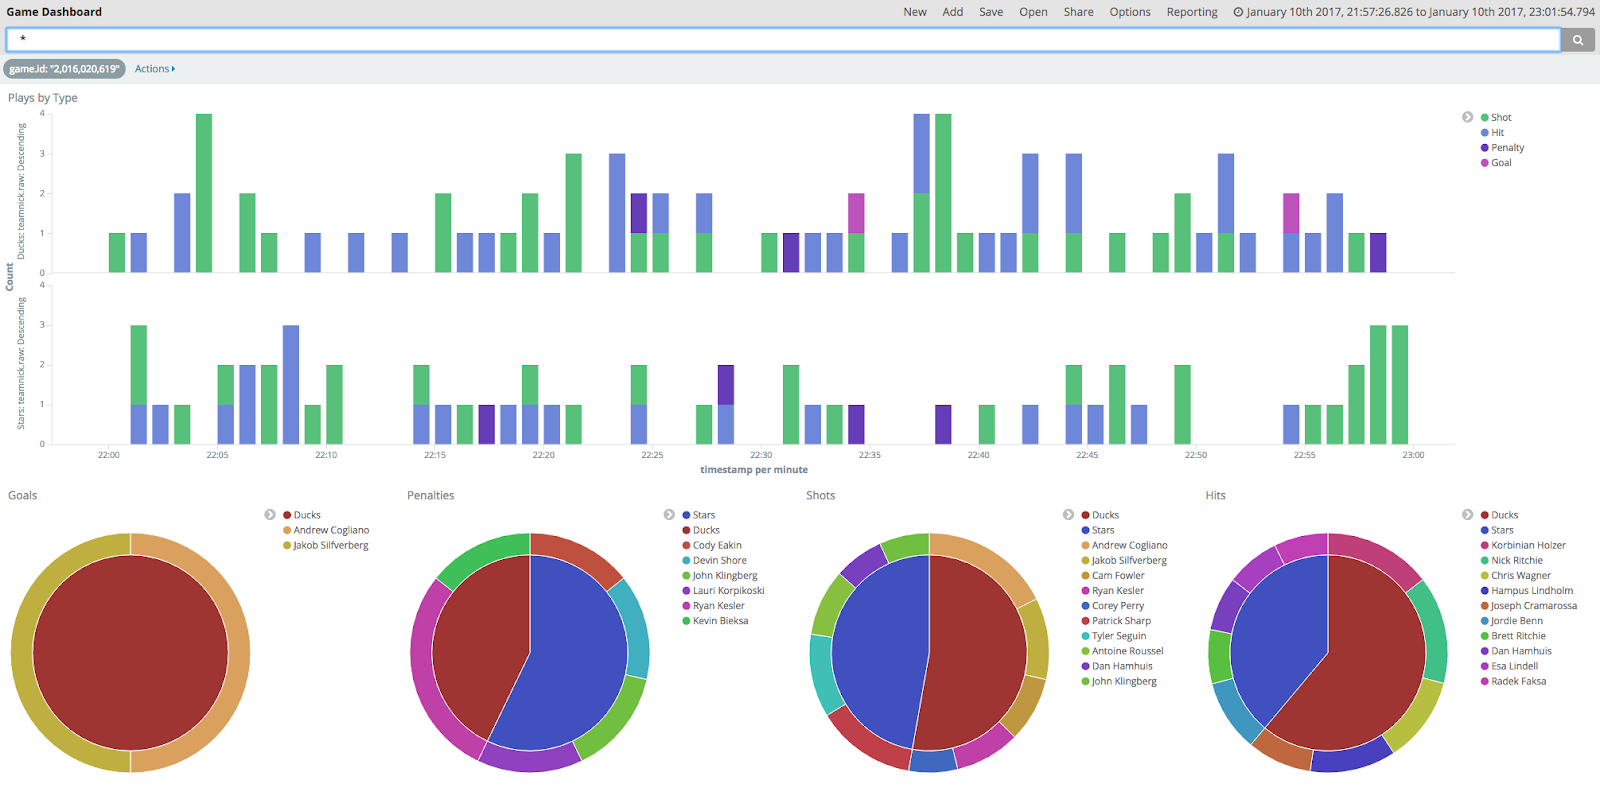
Using Kibana dashboard with some basic visualizations, we can drill down on a specific game. Let’s see a timeline of plays, colour coded by type and split by team, then some pie charts of each play, also split by team. The first pie shows us that only the Ducks scored in this game. Gogliano and Silfverberg made this a 2-0 win over the Stars.
A hockey rink is 200 Feet by 85 Feet, which conveniently equates closely to longitude and latitude (180 by 90). In the case that your data does not equate naturally, you could use Logstash to translate the coordinates to a compatible longitude and latitude range. The following visualization shows the location of all goals scored, but something’s not right - Latitude and Longitude is a nice coordinate hack, but we need the correct backdrop.
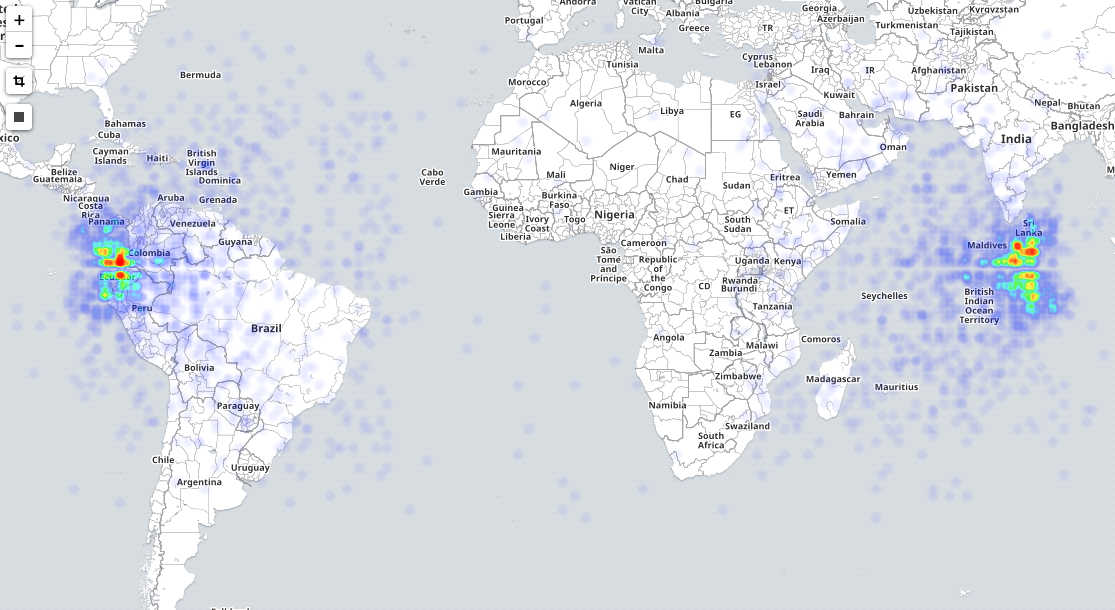
As of Kibana 4.2, we added support for custom map tiles, so we can turn our world into a hockey rink (for those of us who haven’t already).
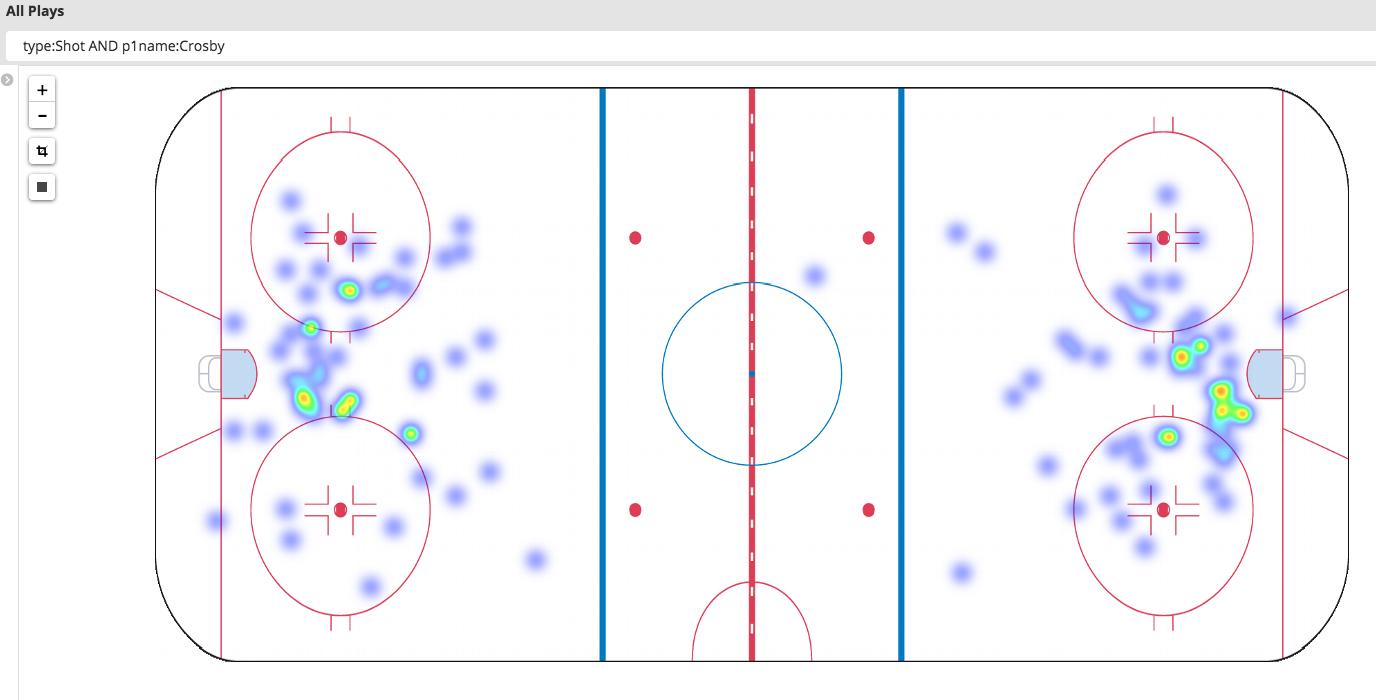
Sidney Crosby’s Shot Locations
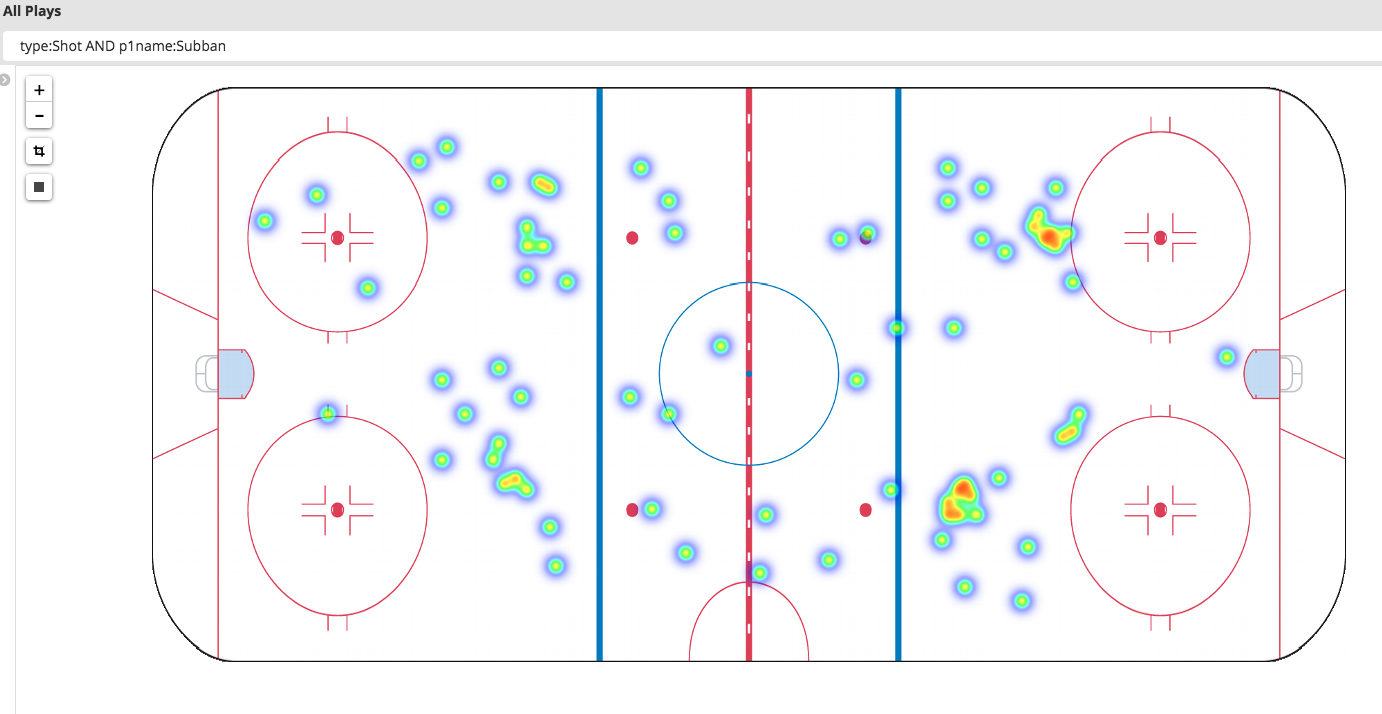
P.K. Subban’s Shot Locations
Setting up a custom Tile Server
Let’s now outline the process used to load this custom map into the Kibana visualization.
Step 1) Create a GeoTIFF version of the Arena image
gdal_translate -of GTiff -a_srs EPSG:4326 -a_ullr -105 45 105 -45 nhl_rink.gif nhl_rink_gtiff.tiff
gdal_warp -t_srs EPSG:4326 nhl_rink_gtiff.tiff nhl_rink.tiff
The gdal_translate and gdalwarp commands are used in conjunction to encode longitude/latitude points into the image, and to “reproject”, or set control points.
Step 2) Set up GeoServer
GeoServer is a free and open-source WMS server, which makes it compatible with Kibana. Downloading and installing this software onto your favourite platform is easy, and results in a Web Front end that you can log into to manage your tile service. Once the server is running, you can log into via http://<hostname>:8080/geoserver. In the screenshots, we are working with GeoServer 2.7.2.
Step 3) Create a new Workspace
From the Data->Workspaces menu, click “Add new Workspace”. In this example, we name it “NHL”, and also set the Namespace URI to “NHL”
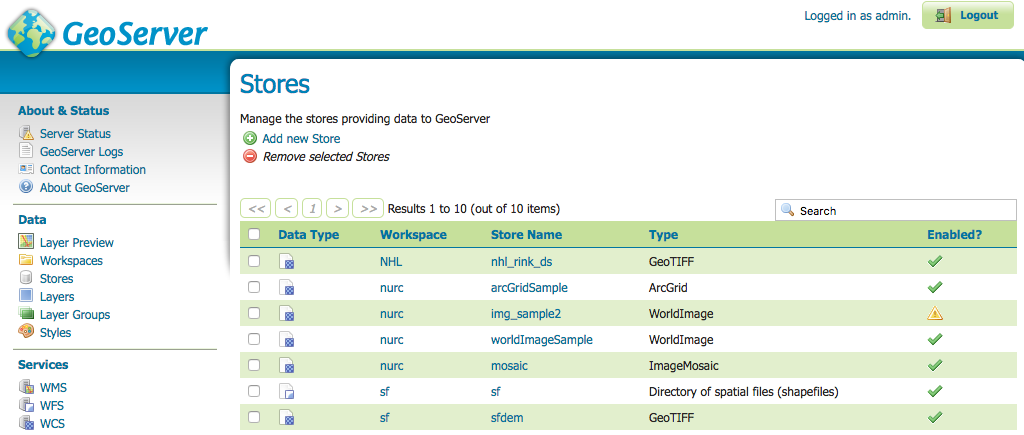
Step 4) Import the GeoTIFF into Data Stores.
From the Data->Stores menu, click “Add new Store”. Select GeoTIFF. Select the Workspace you just created, and set a datasource name. For this example, we use the DS name “nhl_rink_ds”. Browse to select your nhl_rink.tiff file, and press Save.
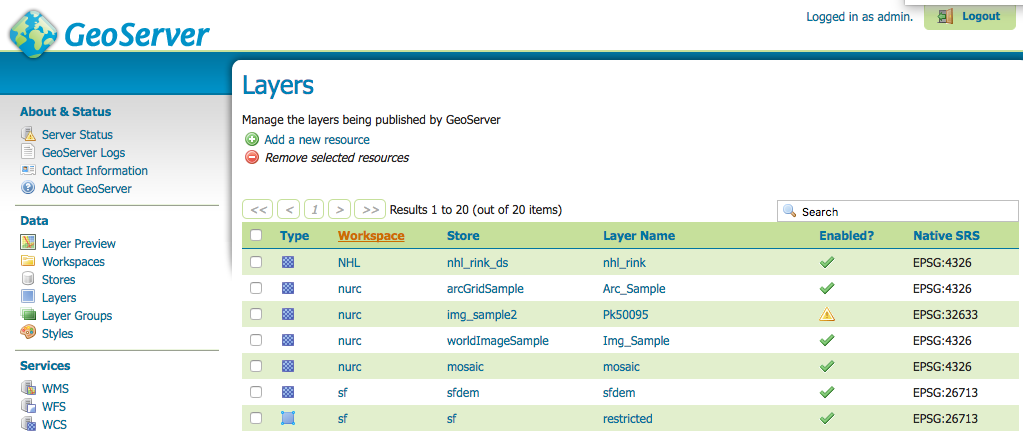
Step 5) Create the WMS Layer
From the Data->Layers menu, click “Add new Resource”. Select your newly created data source (NHL:nhl_rink_ds). By default, the Layer will be named the same as the store image name, without the file extension. (nhl_rink). Click Publish (which then opens up the Layer Settings) then Click Save.
That’s it, your tile service is ready to go!
Step 6) Configure Kibana to use the new tile server
Finally, create a tile map visualization in Kibana and configure a custom WMS compliant map server.
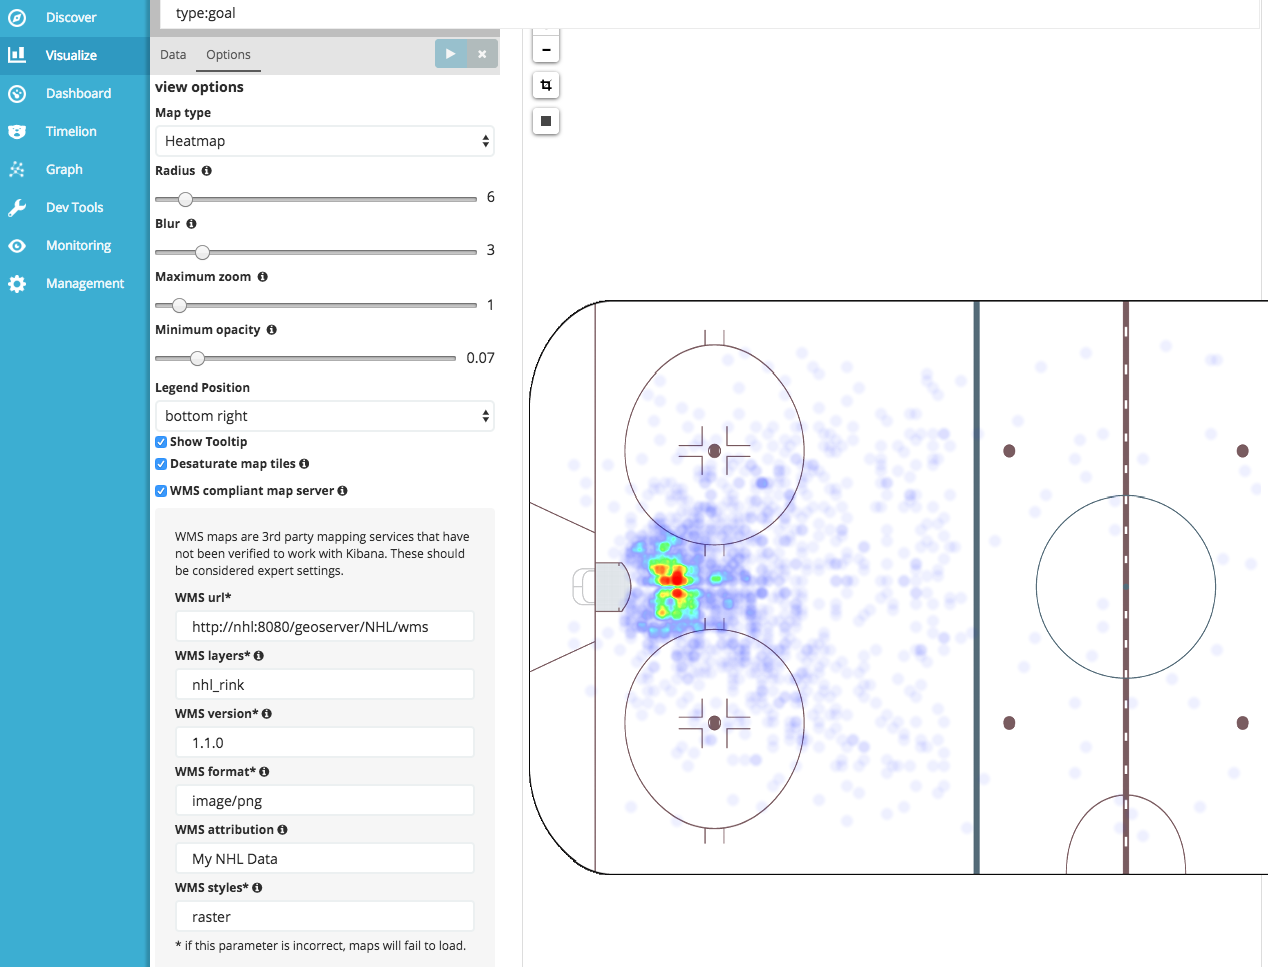
WMS url | http://<hostname>:8080/geoserver/NHL/wms |
WMS layers | nhl_rink |
WMS version | 1.1.0 |
WMS format | image/png |
WMS attribution | My NHL Data |
WMS styles | raster |
Exploring Further
Consider the possibilities for drawing conclusions about the data set:
- Which goalies are vulnerable to shots from certain players shooting from certain locations?
- Who is drawing the most penalties (Aggregating by p2name.raw where type.raw:penalty)?
- Time Series Analysis in Timelion to show relationships between stats
Try Importing the data into Elasticsearch yourself: Find the source code with instructions on GitHub.
As always, we appreciate your feedback, so feel free to ping us on Discuss or Twitter. Or, if you want to kick it up a notch and meet us in person, please come to our big user conference Elastic{ON} in March 2017!
* - The game data was previously available from http://live.nhl.com/GameData/20142015/2014021136/PlayByPlay.json