Elastic vs. Grafana
Elastic Observability unifies logs, metrics, traces, and AI in a single platform. Grafana's self-managed stack requires assembling five separate products, each with its own deployment, scaling, and query language. Even in Grafana Cloud, teams still operate across three query languages with no shared data model.
Blazingly fast metrics on a unified data platform
A fast, reliable, and unified platform
 Elastic Observability:
Ship any data, in any format, including OpenTelemetry (OTel), and let our AI-powered automated pipelines effortlessly parse and structure it all. No custom parsers, no schema headaches.
 Grafana (self-managed):
Five separate products. Five separate configurations. Three separate query languages (LogQL, PromQL, TraceQL). Grafana Cloud abstracts deployment but not query language fragmentation.
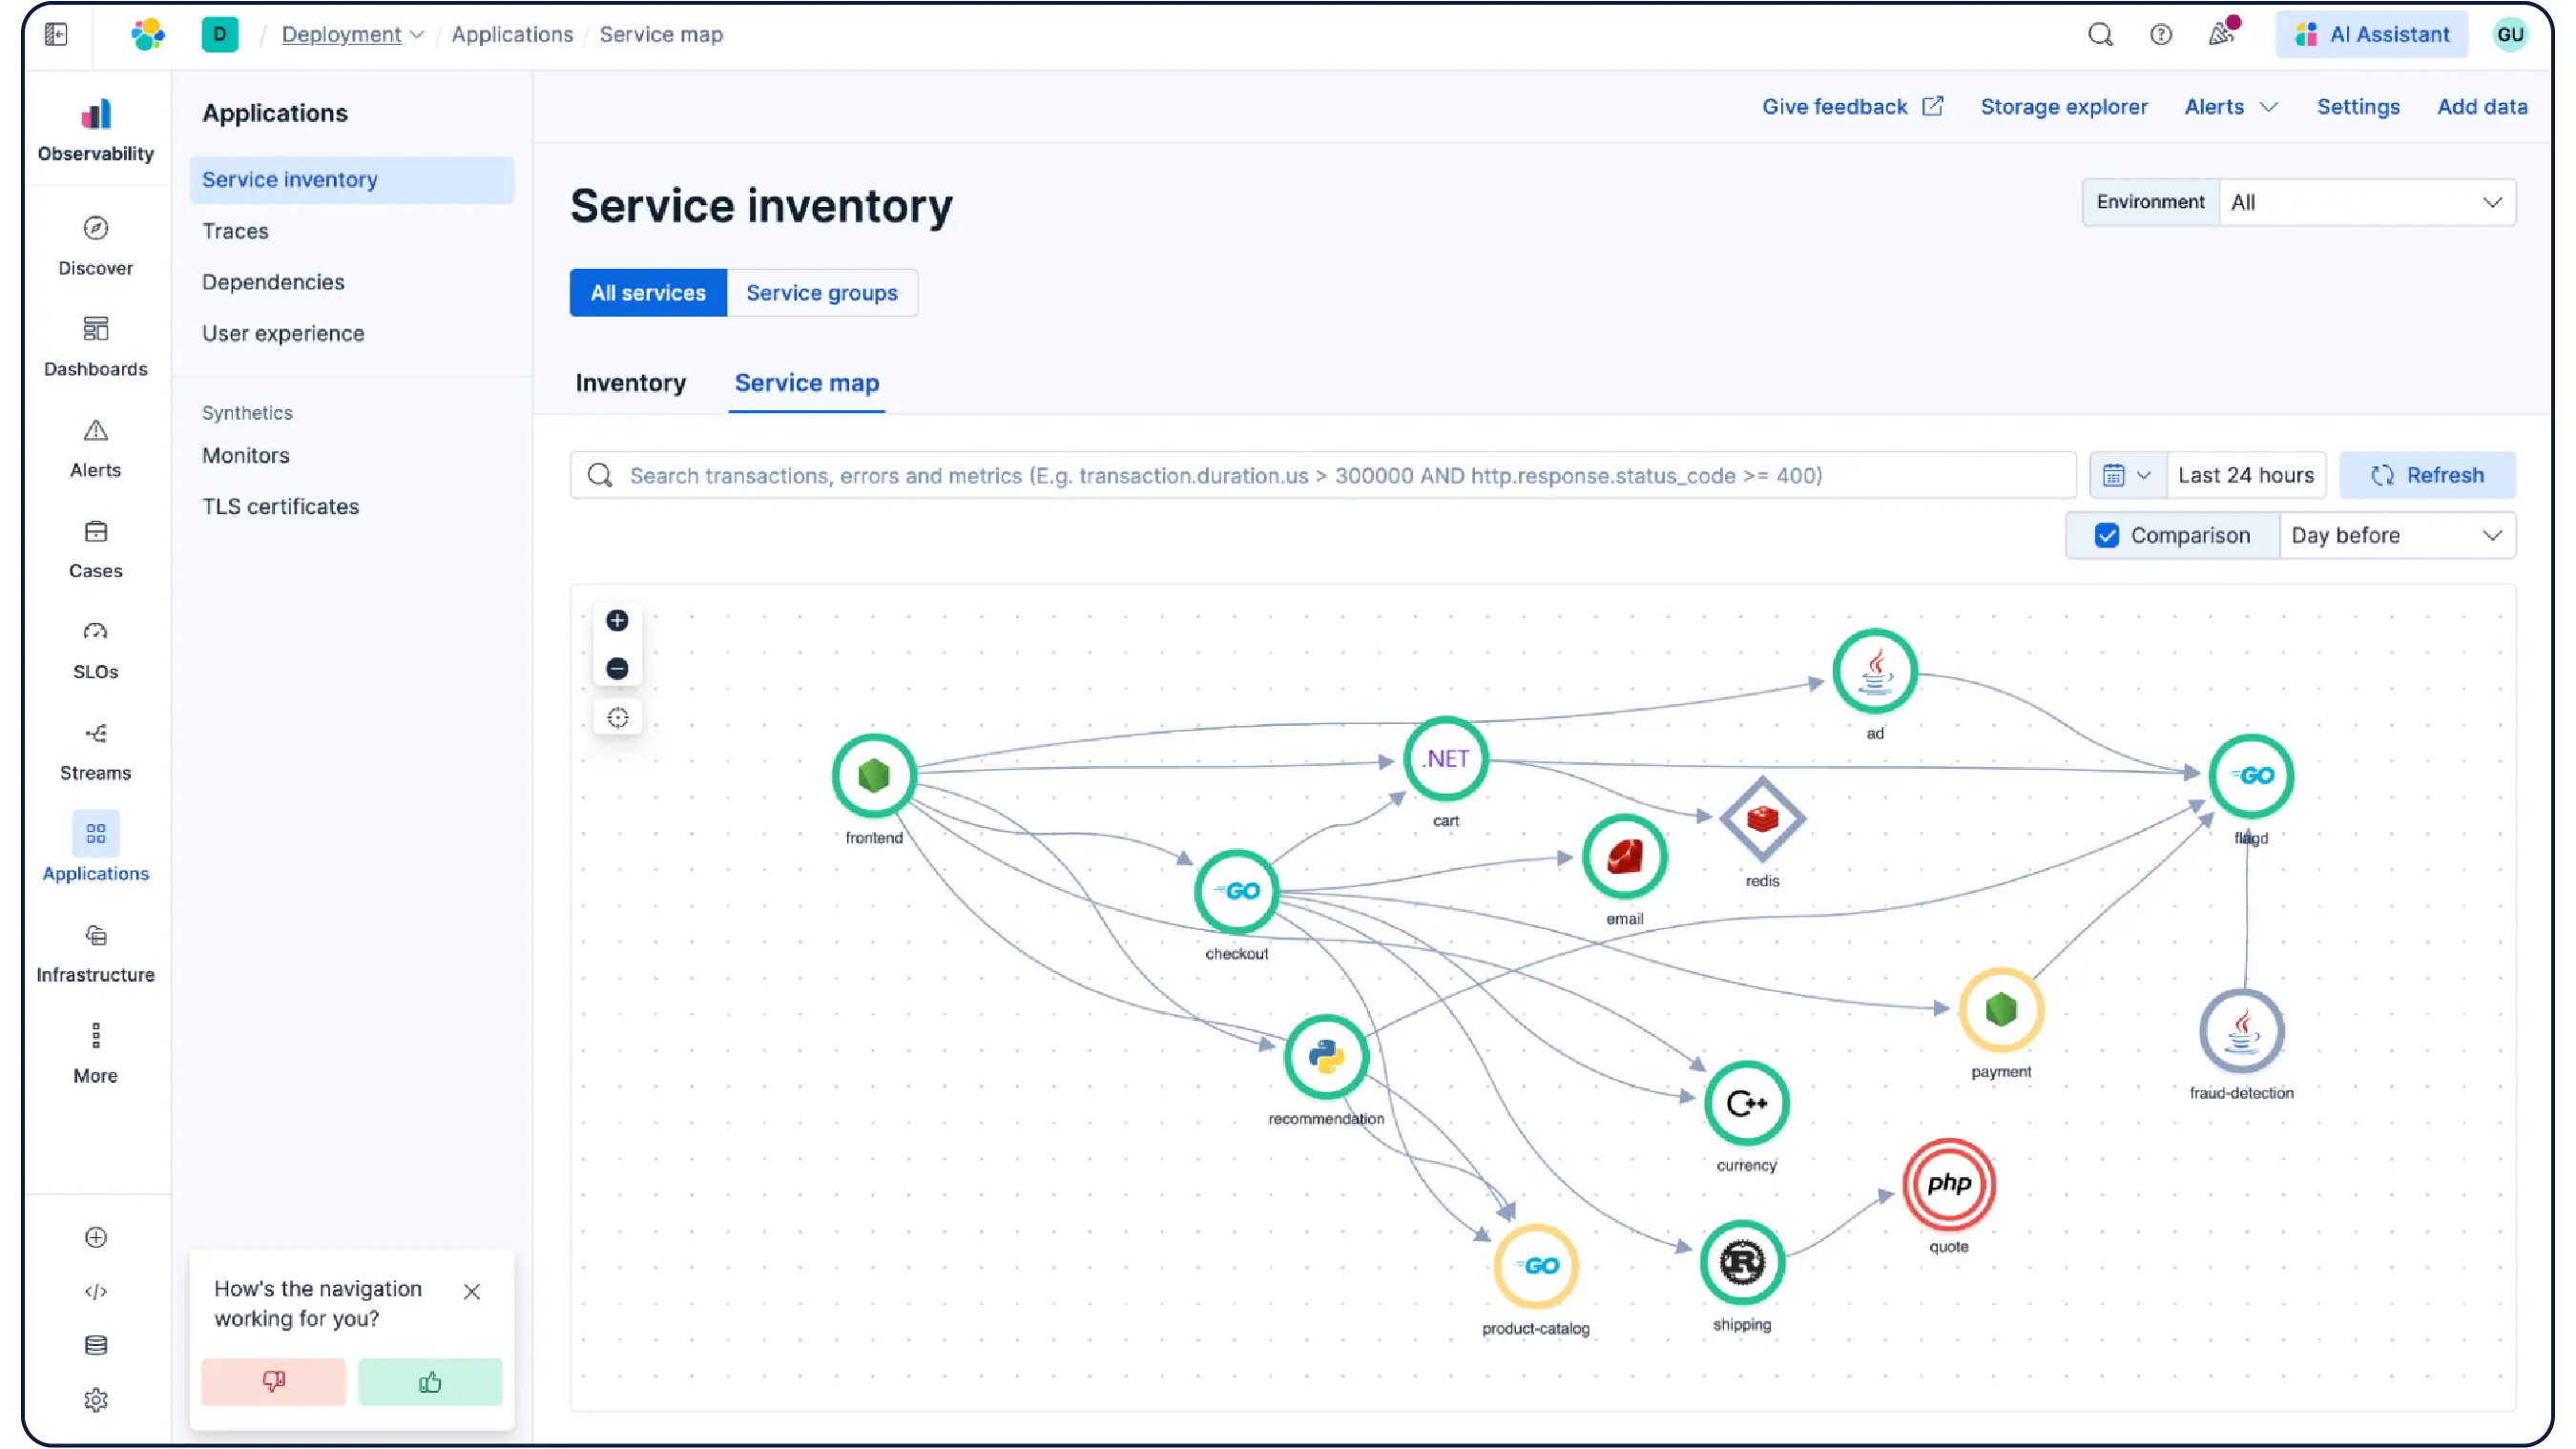
Get instant AI-driven answers, not query chaos
Elastic Observability:
Go from SLO alert to answer in minutes. Our agentic AI surfaces the likely root cause as the starting point for your investigation, complete with the unified context of your infrastructure and application health.
Grafana:
Root-cause analysis quality is constrained by physically separate Loki, Tempo, and Mimir back ends with no shared data model. AI context remains fragmented at incident speed.
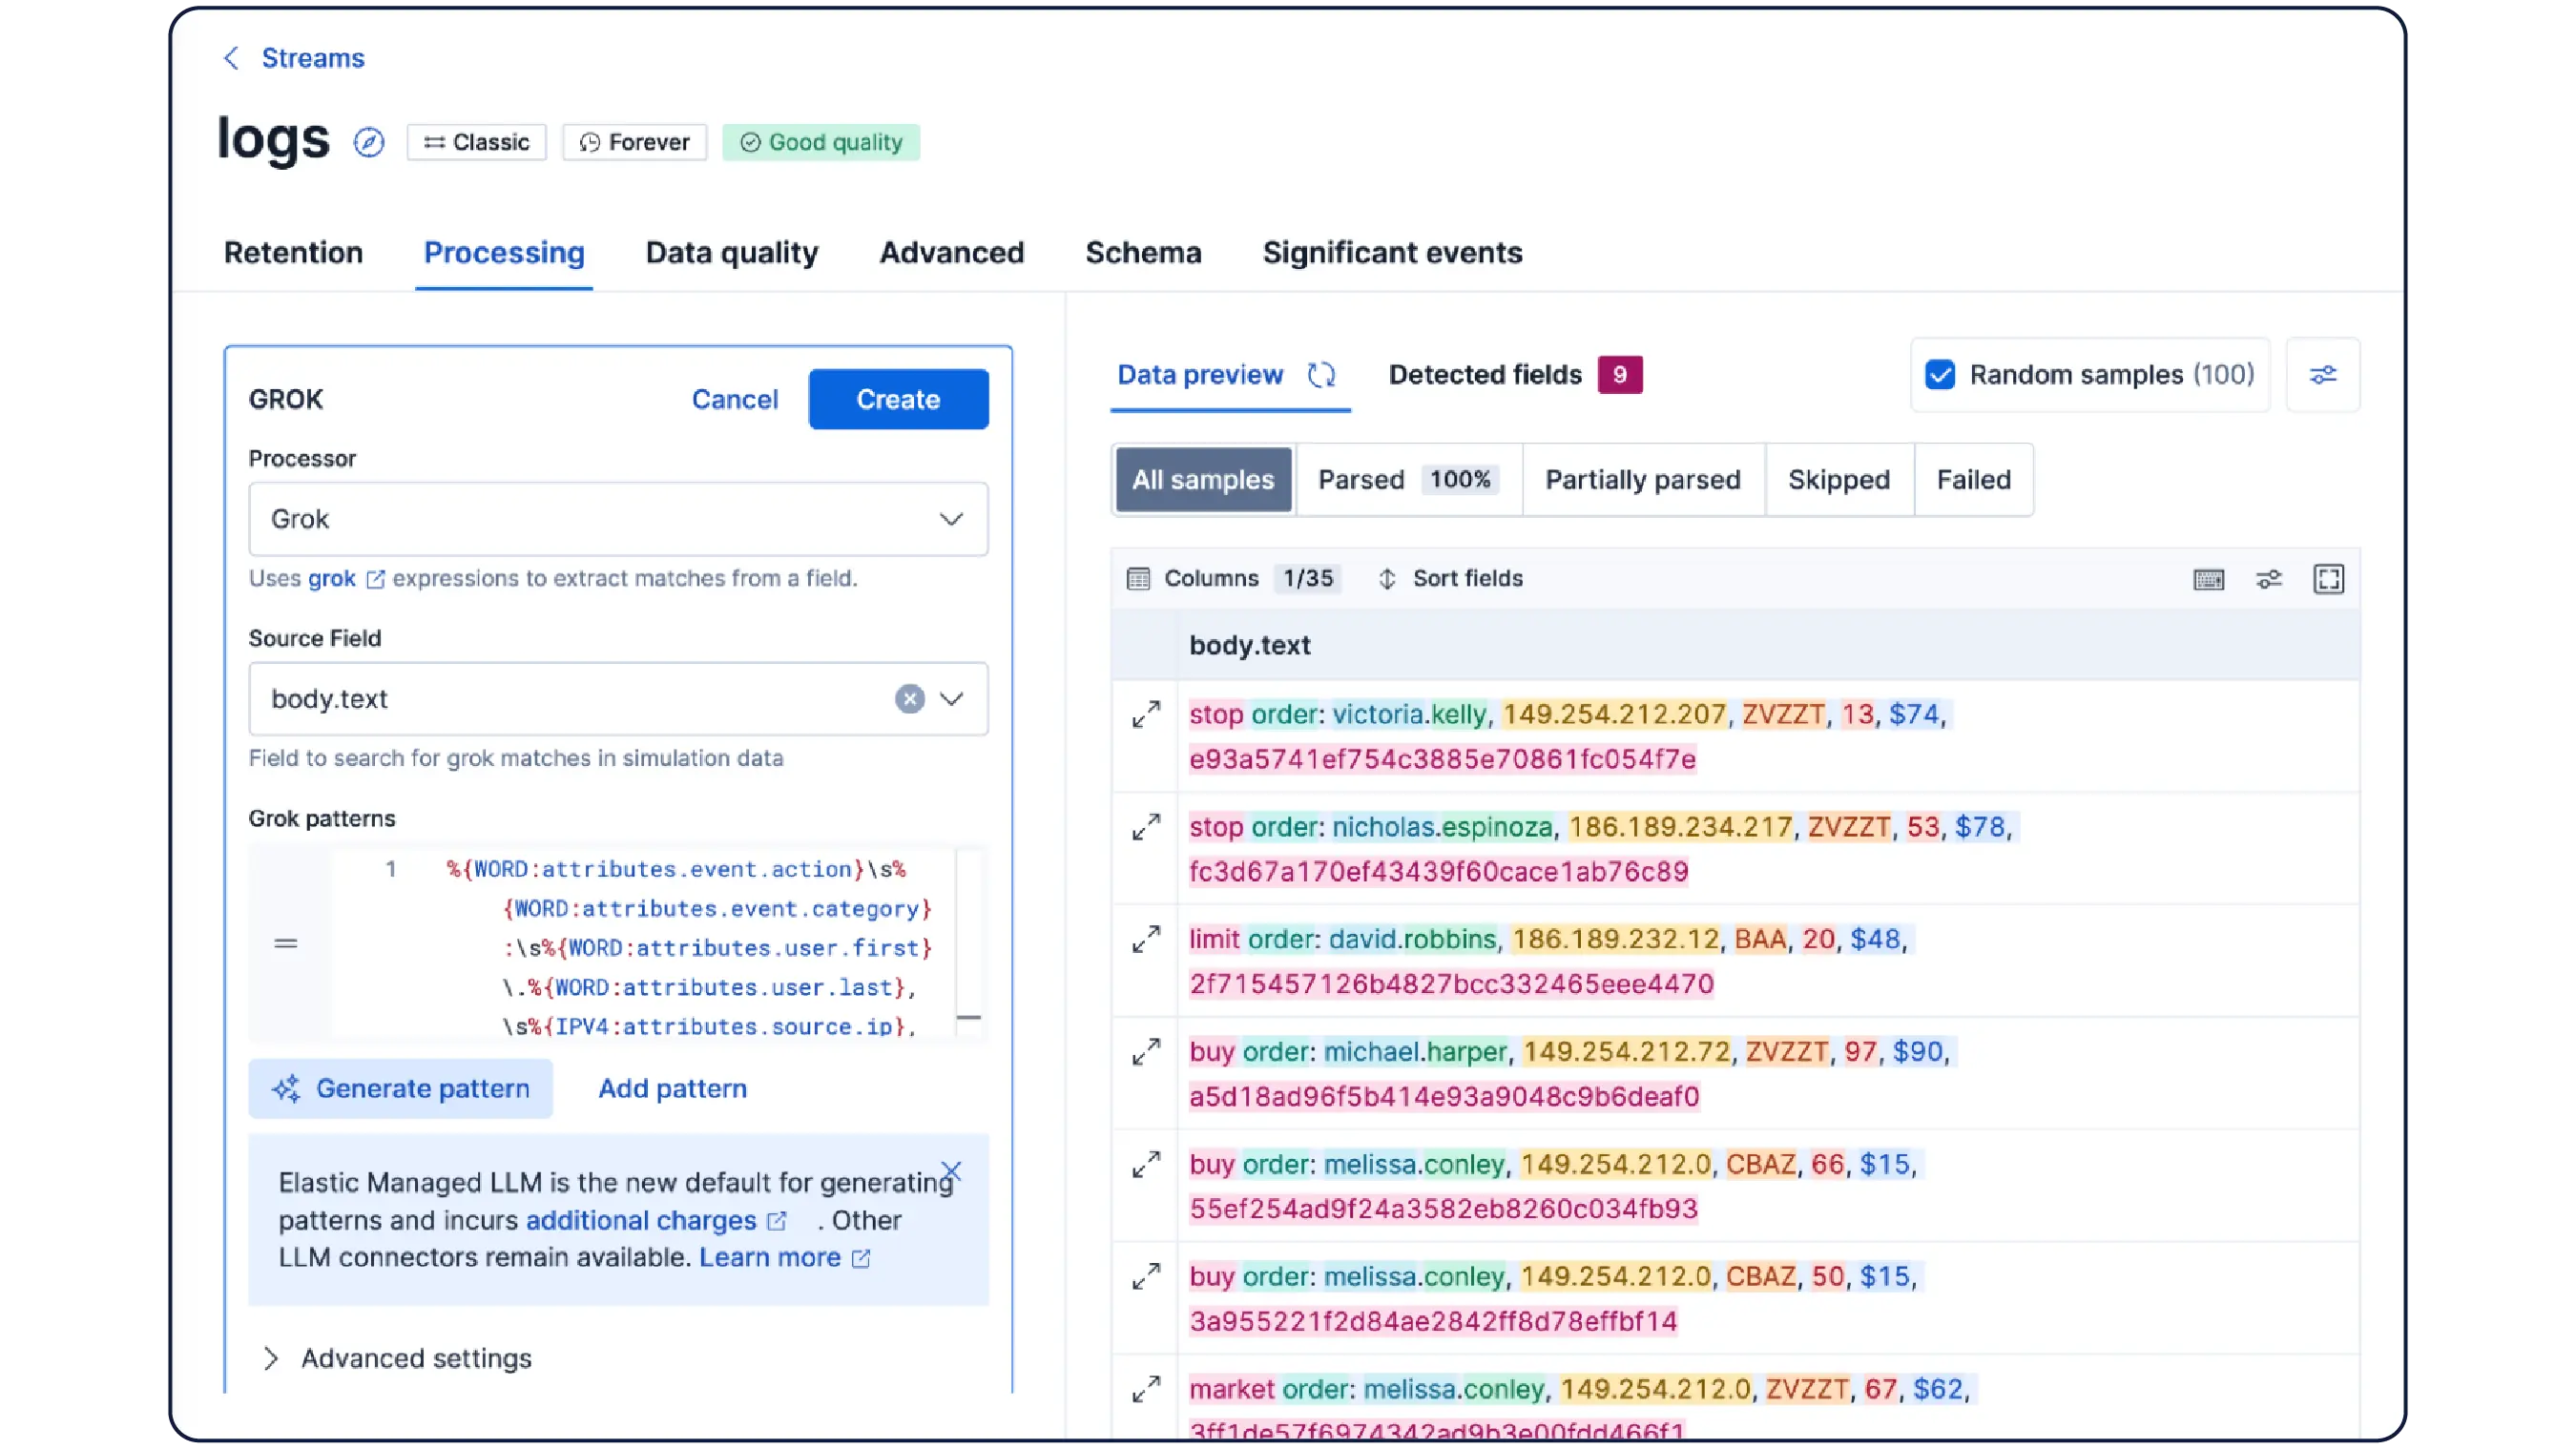
Prevent issues, cut the noise
Elastic Observability:
Save your team from hunting through noisy alerts. Over 100 preconfigured ML jobs automatically detect anomalies across every signal type: logs, metrics, traces, and the entire user journey.
 Grafana:
Grafana's ML forecasting and anomaly detection capabilities are focused on metrics, and organizations require additional workflows to achieve broad anomaly coverage across metrics, logs, and traces.
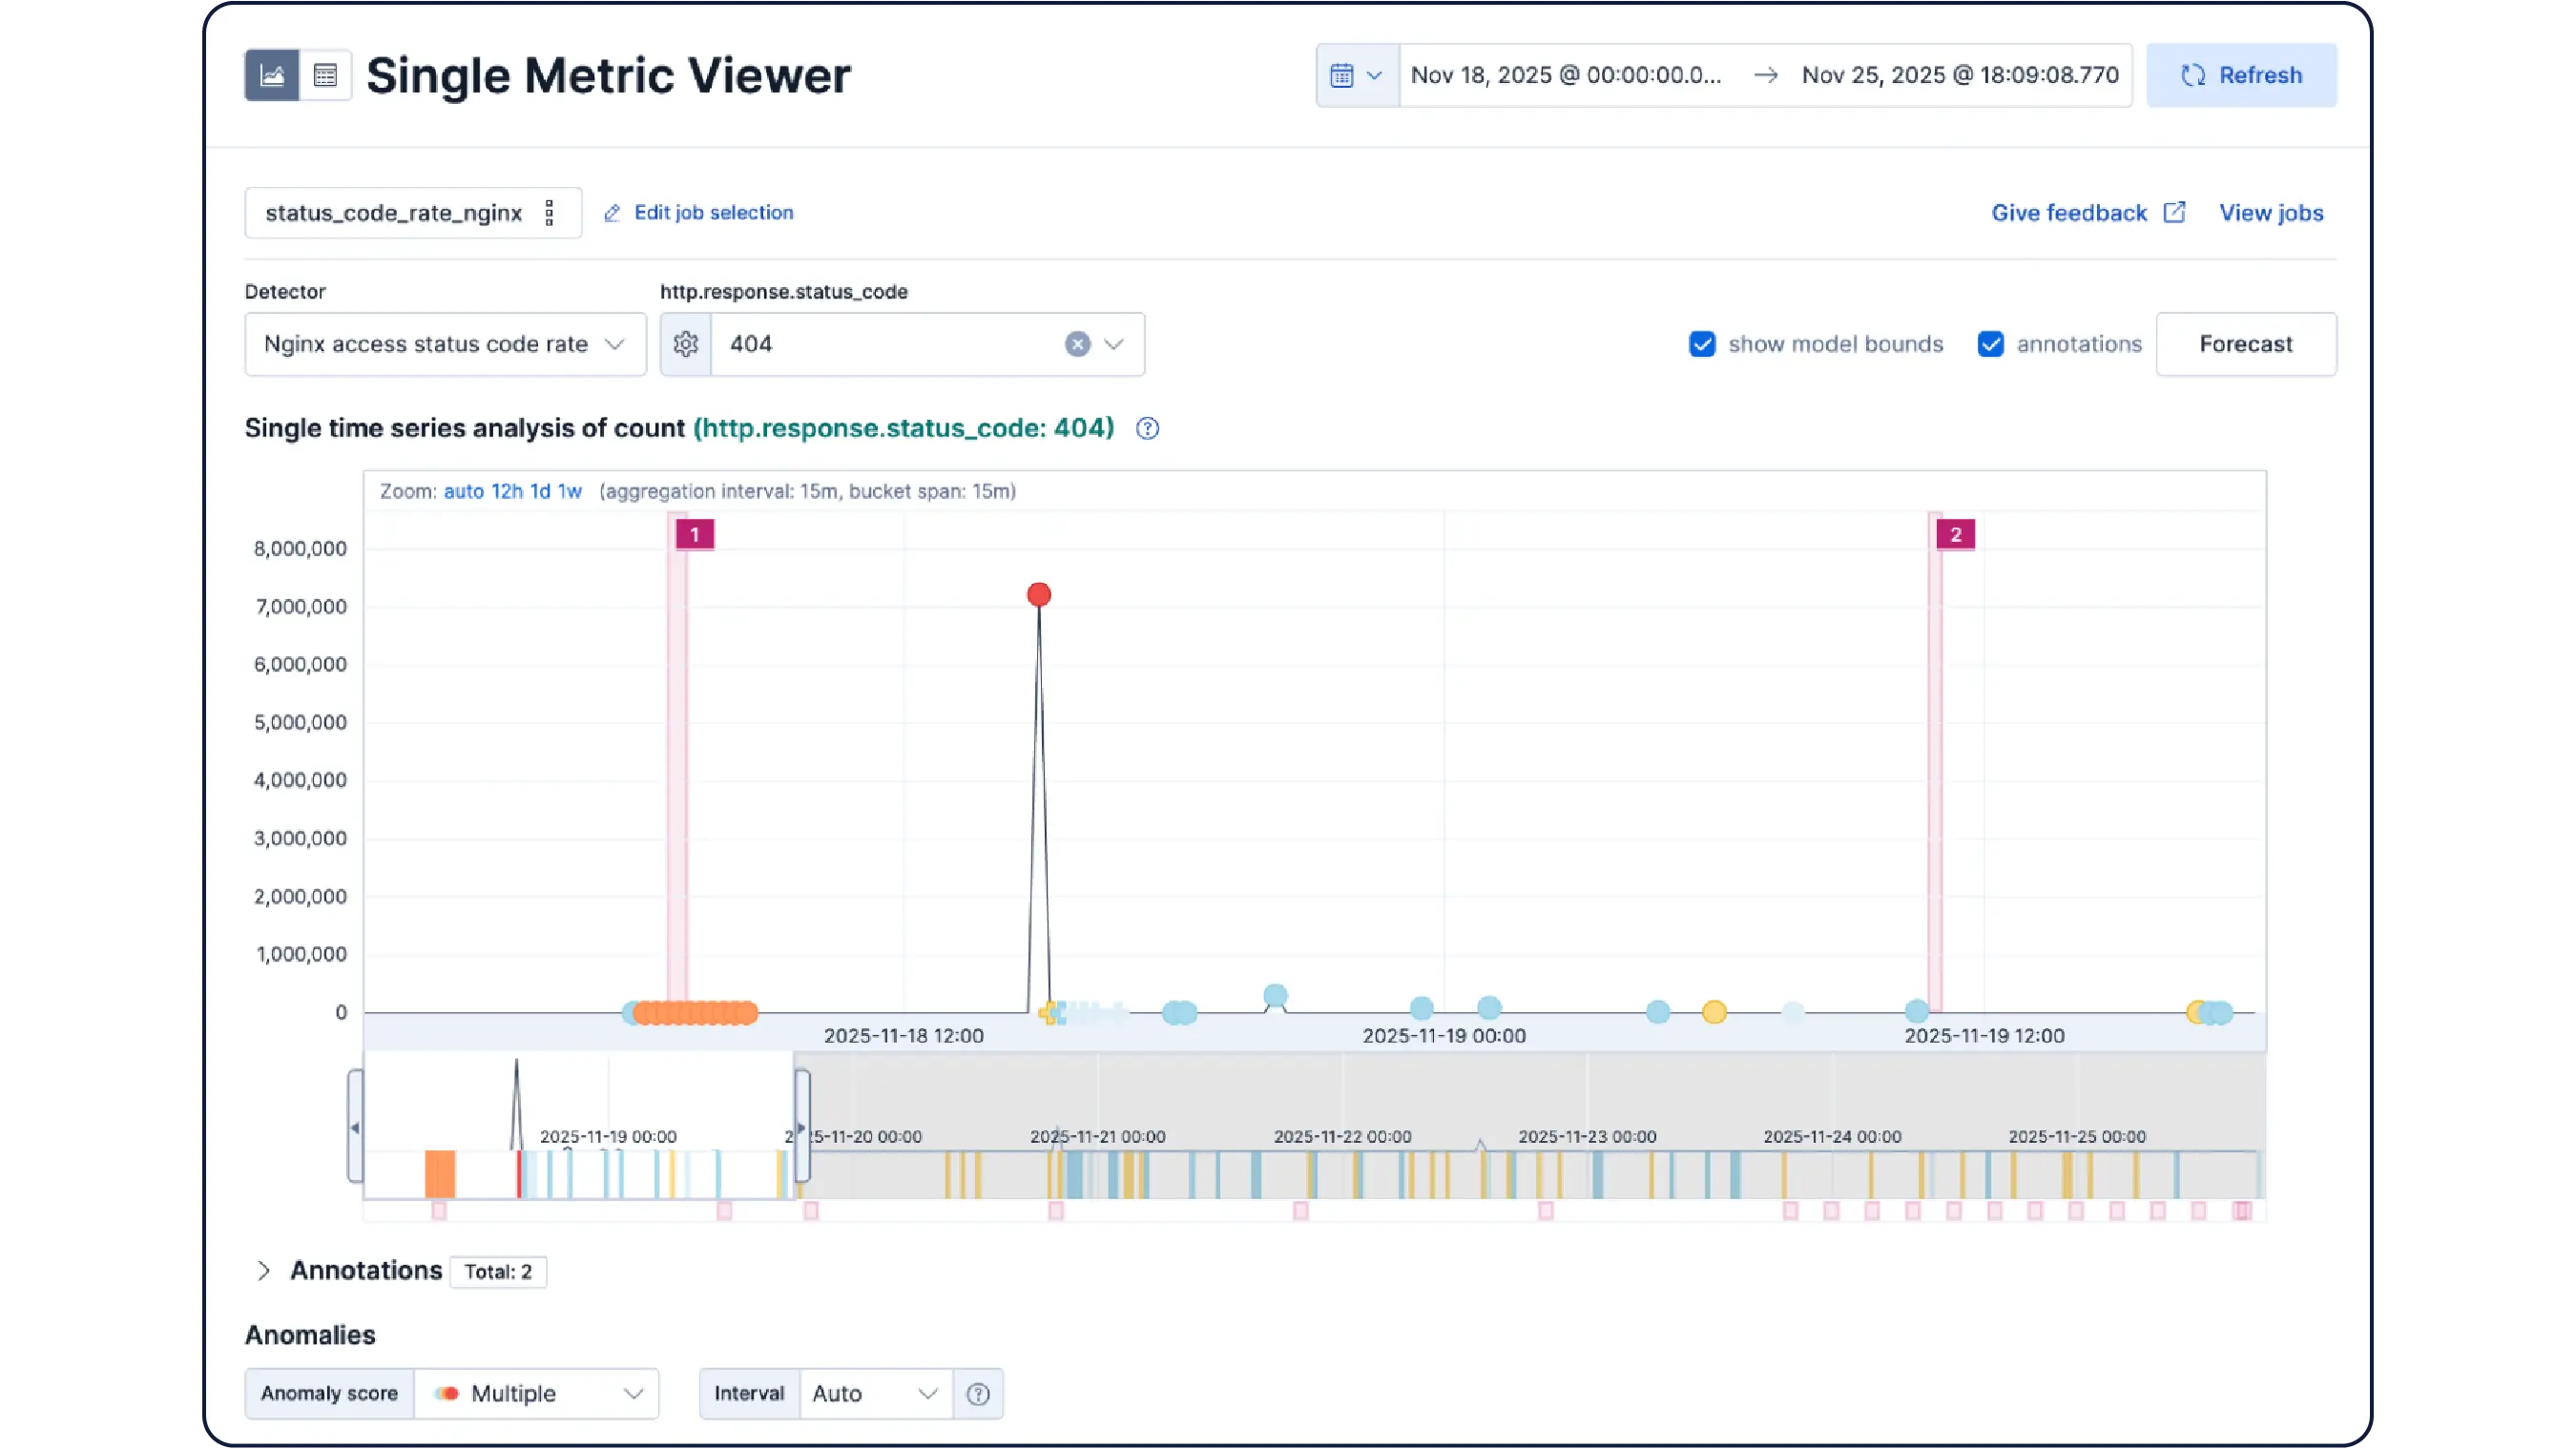
One datastore, all formats, no context switching



Elastic vs. Grafana: Feature-by-feature comparison
Self-managed Grafana requires assembling five separate products — Loki, Tempo, Mimir, Pyroscope, and Grafana — each with its own deployment, scaling, and query language. Grafana Cloud manages the infrastructure, but teams still operate across three separate query languages (LogQL, PromQL, TraceQL) with no unified data context. Elastic brings it all together in one AI-powered platform, out of the box.

Elastic
Grafana
AI-powered log streams with automatic parsing of raw signals.
Log streaming via Loki requires manual pipeline configuration and manual label schema design. No AI-based automatic parsing.
Automatic import included.
No automatic import. Each data source requires manual Grafana Agent or Alloy configuration.
450+ integrations with a single unified onboarding experience.
500+ integrations available, though split across solutions without a unified experience.
Streams: AI-based parsing of raw signals, zero schema design required.
Loki requires manual label schema design up front. No AI-based automatic parsing of raw log signals. Object storage looks cheaper on the ingest bill, but the savings disappear when you account for the engineering cost of designing and maintaining label schemas and the reingestion cost when schemas change.
Elastic AI Agent uses your enterprise knowledge and open LLM connectors for accurate, grounded answers. Your agents can use the MCP to query Elastic metrics, logs, and traces directly.
Root cause analysis across physically separate Loki, Tempo, and Mimir back ends remains limited by the absence of a shared data model.
Enterprise knowledge integrations included.
No enterprise knowledge integrations for AI-powered investigations.
Managed LLM (no setup) or open connectors to OpenAI, Azure OpenAI, Amazon Bedrock, and Google Gemini.
Limited LLM provider support. No open connectors to Bedrock, Azure OpenAI, or Gemini at the same depth as Elastic.
Significant Events surfaces meaningful signals in logs automatically.
No significant events capability.
100+ preconfigured anomaly detection jobs across all signals — logs, metrics, traces — using both unsupervised and supervised techniques.
ML-based anomaly detection available primarily for metrics. No preconfigured detection jobs across logs, traces, and all signal types.
Unified APM and universal profiling in one platform.
Full APM via Application Observability; however, traces (Tempo), metrics (Mimir), and logs (Loki) remain on separate back ends requiring manual correlation.
Built-in eBPF-based continuous code profiling.
Beyla (eBPF auto-instrumentation) + Pyroscope (continuous profiling) available as separate products requiring additional deployment.
Infrastructure monitoring included with unified auto-discovery.
Available via separate Grafana Agent/Alloy configuration. No unified auto-discovery.
Synthetic monitoring included.
Synthetic monitoring available (k6 + Grafana Synthetic Monitoring) as a separate product.
SLOs supported.
SLOs only supported in Grafana Cloud.
Proactive alerts based on anomaly detection across the full user journey.
Dynamic alerting via ML forecasting for metrics only. No proactive anomaly-based alerting across all signal types and the full user journey.
Cases built into core observability workflow.
Grafana IRM available as a separate add-on product.
Inference API with built-in semantic models included.
No inference API with built-in semantic models.
First-class search: fuzziness, synonyms, highlighting, and nested queries at petabyte scale.
Basic log search only. No fuzzy search, semantic search, or synonym support. Search experience degrades at scale.
Fine-grained RBAC with custom roles, spaces, and document-level and field-level security.
Limited RBAC is available in Grafana Cloud. No document-level or field-level security for regulated industry data isolation.
Fine-grained access control with document-level and field-level masking.
Coarse-grained access controls. No document-level or field-level masking for sensitive data in regulated environments.
Global managed service + fully managed + self-managed (on-premises, hybrid, air-gapped).
Grafana Cloud is globally available, but there is no true on-premises or air-gapped deployment in the managed offering.
Fully managed service with existing FedRAMP authorization on the same platform used by commercial customers.
Grafana Federal Cloud is FedRAMP High authorized, but it is a separate, dedicated product from mainstream Grafana Cloud. Regulated customers must choose between the federal SKU or the commercial platform; there is no unified offering.
Built for petabyte-scale indexing and aggregations with full-fidelity retention.
Loki's label-based indexing breaks down under high-cardinality workloads common in modern cloud-native stacks. Grafana's Adaptive Telemetry reduces ingest volume by selectively dropping data not by intelligently preserving signal. Each component also scales independently, multiplying the operational surface.
One-click setup, integrated UI, low operational overhead. The Express Migration program helps quantify and reduce hidden costs when switching.
Self-managed Grafana (LGTM): five separate products to deploy, tune, upgrade, and scale. Real TCO includes SRE hours spent designing Loki label schemas, tuning Mimir retention, scaling Tempo separately, and managing five separate upgrade cycles. Grafana Cloud removes deployment burden but does not eliminate schema design complexity or multi-query-language overhead.
Full geospatial search, geo hexgrids, and map visualizations.
Basic geo map visualization via Grafana panels. No full geospatial search, hexgrids, or spatial query capabilities.
First-class search: fuzziness, synonyms, highlighting, and nested queries.
Grafana is a visualization tool, not a search platform. No full-text search, fuzzy search, semantic search, or synonym support.
The world's largest companies rely on Elastic
The smart, open choice that delivers uncompromised value
Customer spotlight

Observes through a single pane of glass — including metrics, events, logs, application traces — minimizing log fields ingested by 60%
Customer spotlight

Transforms customer experiences by providing a more strategic, partnership-based approach to observability
Customer spotlight

Boosts cloud infrastructure health with Elastic Observability and reduces observability operational expenditure by 80%