Time Series, Annotations, and Anomalies with Kibana
It's been a long busy summer and we've taken longer than George R. R. Martin to close out our Time Series Visual Builder blog series. If you haven't had a chance to view the first two video-blogs or want a refresher, we highly recommend setting aside a few minutes to watch them both (blog1, blog2).
Today we'll be going over how to add annotations to a time series visualization from anomalies detected by a machine learning job. If you'd like to follow along, we'll be using the latest version of Kibana with X-Pack machine learning feature installed and logs from our Filebeat Nginx module. For this demo specifically, we are using the Kibana 6.0.0-RC1 build. The latest preview release can be found here.
In this video, you'll learn to do the following:
- Configure a multi metric machine learning job and view the anomaly index
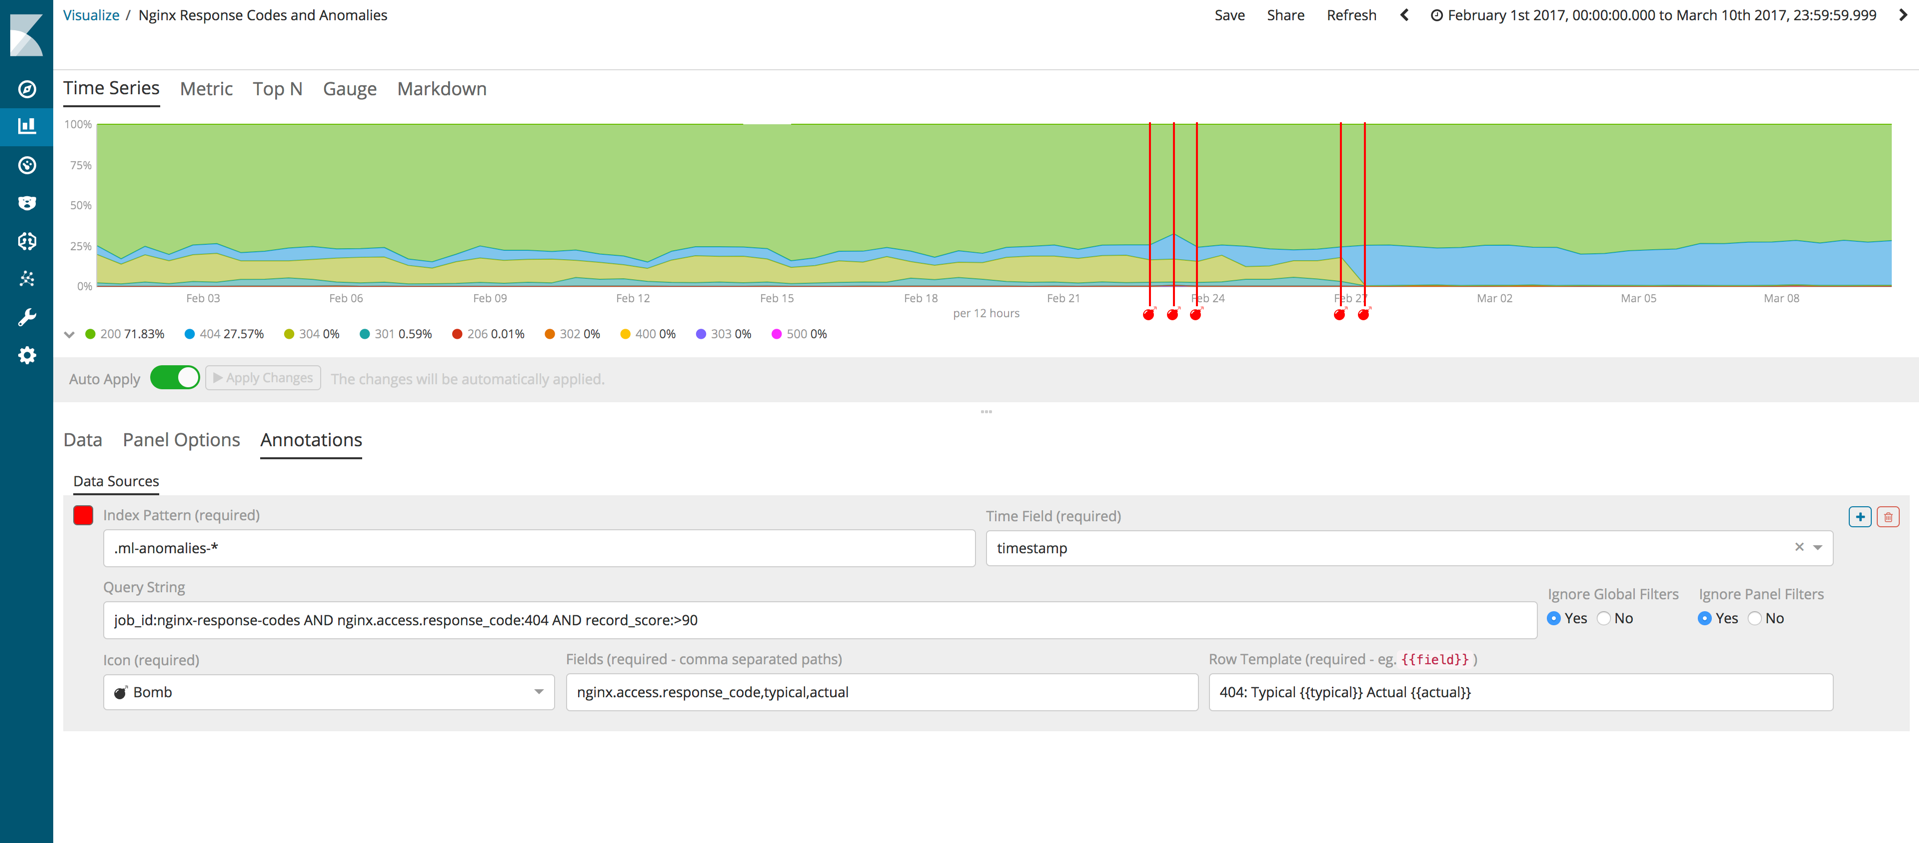
- Create an index pattern for machine learning anomalies
- Customize the legend, grid, data format and area chart to your liking
- Add annotations and a custom tooltip based on an index pattern and query
Ready to dive in? Watch and follow along in the video below.

We're moving fast with the Time Series Visual Builder! If you have a feature you'd like to see, I invite you to open an issue in the Kibana repo and add a :Time Series label.