On-demand webinar
Advanced tips for visualizing and presenting data in Kibana
Hosted by:

Jason Burns
Principal Product Manager
Elastic

Shaun McGough
Principal Product Manager
Elastic
Overview
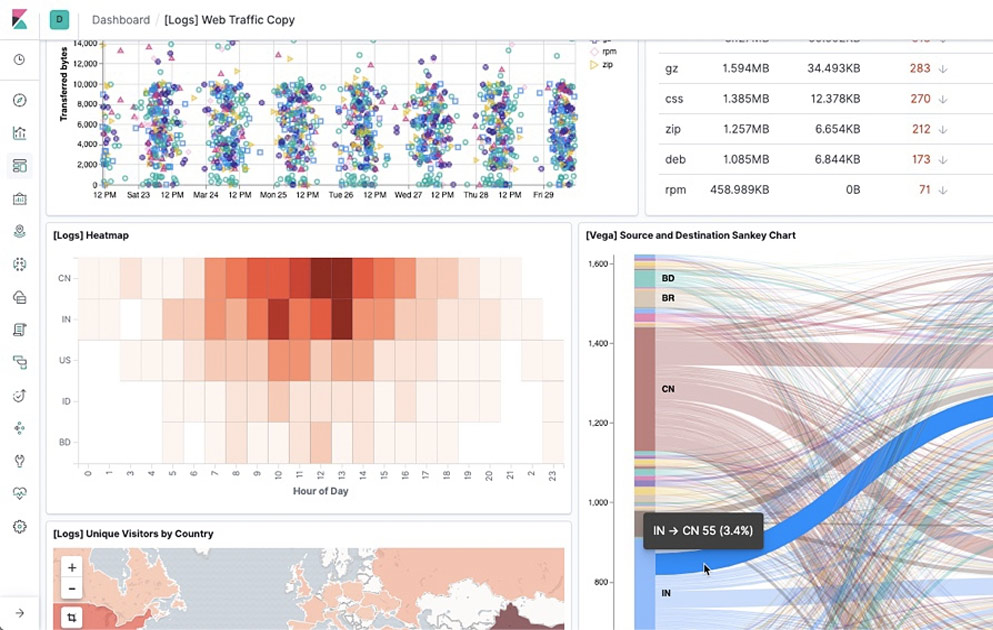
Data analysis is rarely a linear start-to-finish process — no matter how much we wish it was. Good data analysis always prompts additional questions. Supporting the questions-and-answers cycle is something Kibana was built to do. Learn protips for how to use Kibana’s latest capabilities to rapidly move from data questions to beautifully formatted answers in the form of dashboards and interactive reports in Canvas.
View next
On-demand webinar
Elasticライブウェビナー:Elasticで構築する次世代自律型ワークフロー -Agent Builderによるエージェント開発とWorkflowsによる統合管理-