Monitor Claude activity in Elastic Security, the agentic security operations platform

 Share on Twitter
Share on Twitter

 Share on LinkedIn
Share on LinkedIn

 Share on Facebook
Share on Facebook

 Share by Email
Share by Email

 Print this page
Print
As more people across an organization start using Claude, security and compliance teams end up asking the same questions they ask about any other system: Who’s using it? How are they signing in? Who’s changing the configuration? Claude’s Compliance API answers all of that. It tracks more than 300 event types across Claude Enterprise, Claude Team, and Claude Platform, and every event arrives with the actor, a timestamp, and where it came from. The hard part was never the data. It’s getting that data into the workflows your SOC already runs and lining it up against everything else in your environment.
That’s exactly what Elastic’s Anthropic integration is for. It pulls Claude’s Compliance API events into Elastic Security: sign-ins, SSO and identity-provider changes, role and permission changes, the full API key lifecycle, data exports, MCP server connections, and plenty more. Once they’re in, you can search them, write detections against them, and investigate them right next to the telemetry you already collect.
In this post, we’ll walk through how the integration helps you:
Ingest and normalize Claude Compliance API events
Detect risky activity with detection rules
Monitor Claude activity from a prebuilt dashboard
Investigate Claude activity alongside your broader security telemetry
Ingest and normalize Claude Compliance audit events
The integration takes each Compliance API event and breaks it into structured, Elastic Common Schema (ECS)-aligned fields: the actor, the event action and category, the organization and project, the source IP, and whatever resource was affected. There’s no custom parsing to write, so events are searchable the moment they land. And because everything maps to the same schema as the rest of your data, a query or correlation you already wrote for identity or cloud logs works on Claude events, too.
Detect risky activity with detection rules
Detection rules work on Claude events exactly the way they work on cloud or identity data. With AI-powered rule creation, you describe what you’re looking for in plain English and get back a validated Elasticsearch Query Language (ES|QL) rule; no query syntax needed. Something like “Alert when a new MCP server connects outside an approved list” or “Flag a spike in magic_link_login_failed for a single user” turns into a working detection in a few minutes.
Since Claude events sit right next to the rest of your telemetry, your rules can reach across sources. An API key created from an unfamiliar source IP right after something suspicious in your identity provider tells you a lot more together than either event does on its own. And when rules start firing, Attack Discovery triages Claude alerts along with everything else. So, if a Claude signal is one step in a bigger compromise, it surfaces the attack chain for you instead of leaving an analyst to piece it together by hand.
Monitor Claude activity from a prebuilt dashboard
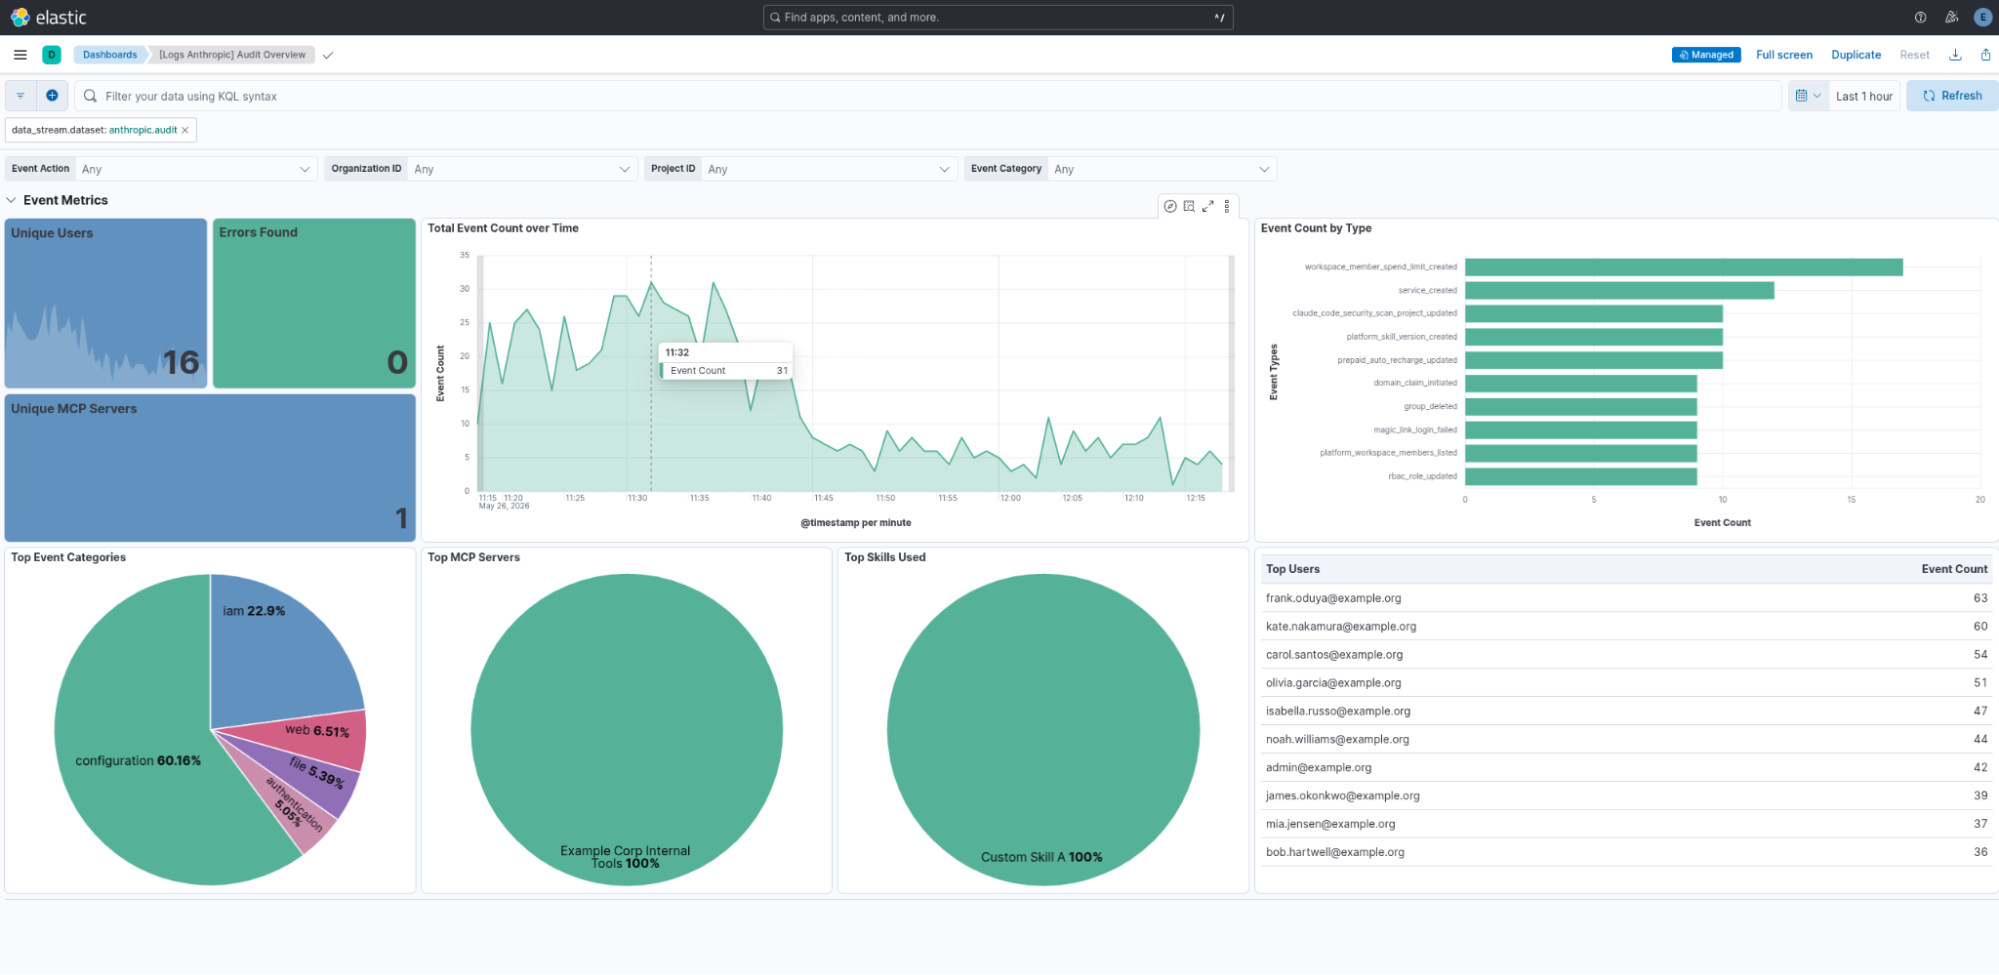
The integration comes with a set of dashboards, so the moment you connect the Compliance API you’re starting from a view that’s already populated. You can filter it by event action, organization, project, and event category, and it shows you:
- Event metrics: Unique users, errors, and unique MCP servers as at-a-glance tiles, plus total event count over time so you can catch spikes or drops
- Event count by type: The specific actions performed from a sign-in attempt or an API key being created to a role change, a new MCP server connecting, or a domain ownership claim
- Top event categories: The mix of configuration, IAM, authentication, file, and web activity across the org
- Top MCP servers and skills: Which connected tools and skills are actually being used, so a new or unexpected MCP server is easy to spot
- Top users: The most active accounts by event count, which is a good place to start when you’re hunting for outliers
Investigate Claude activity alongside your broader security telemetry
Because Claude events live in the same place as your identity, endpoint, cloud, and network data, you can investigate them in a single timeline instead of jumping between consoles. If someone creates an API key right after a sign-in your IdP flagged as suspicious, both events are sitting in the same platform. And if you see unusual file access in Claude activity, you can pull in the related endpoint or network data and work out whether it’s normal, a policy issue, or an actual incident.
Elastic Workflows handles the response from that same platform. A Claude event can kick off an investigation, add context to a case, or notify the right team, and you don’t need to stand up a separate SOAR to do any of it. That same data also doubles as a long-retention, searchable audit trail for compliance reviews and forensics.
Pair it with runtime telemetry from Claude Code and Cowork
The Compliance API gives you the organizational audit trail, including who signed in, what changed, and how Claude is being administered. What it doesn’t tell you is what an agent actually did while it was running, like which tools it called, which files it touched, which commands it ran, and how each of those got approved. That part comes from Claude Code and Cowork, which send their telemetry over OpenTelemetry (OTel), and Elastic can ingest it separately.
Put the two together and you've got the whole picture. The Compliance API tells you an API key was created and an MCP server was connected; the runtime telemetry tells you what actually happened next, such as which tools the agent called and what it touched. With both in Elastic Security, the admin change from the audit log and the agent behavior that followed it sit in the same timeline.
This is a separate setup, not part of the Anthropic integration, so you configure it on its own. If you want to see how Elastic’s own InfoSec team runs it, take a look at Monitoring Claude Code and Cowork at scale with OTel in Elastic.
Get started
Turn on the Compliance API and deploy the Anthropic integration, and then you can start monitoring Claude in Elastic Security. The Anthropic integration documentation has everything you need to get going.
The release and timing of any features or functionality described in this post remain at Elastic's sole discretion. Any features or functionality not currently available may not be delivered on time or at all.
In this blog post, we may have used or referred to third party generative AI tools, which are owned and operated by their respective owners. Elastic does not have any control over the third party tools and we have no responsibility or liability for their content, operation or use, nor for any loss or damage that may arise from your use of such tools. Please exercise caution when using AI tools with personal, sensitive or confidential information. Any data you submit may be used for AI training or other purposes. There is no guarantee that information you provide will be kept secure or confidential. You should familiarize yourself with the privacy practices and terms of use of any generative AI tools prior to use.
Elastic, Elasticsearch, and associated marks are trademarks, logos or registered trademarks of elasticsearch B.V. in the United States and other countries. All other company and product names are trademarks, logos or registered trademarks of their respective owners.
Share
- Share on Twitter
Share on Twitter
- Share on LinkedIn
Share on LinkedIn
- Share on Facebook
Share on Facebook
- Share by Email
Share by Email
- Print this page
Print