Elastic Demo Gallery
Little examples designed to let you explore various facets of the Elastic Stack, from Kibana dashboards and Canvas workpads to Elasticsearch SQL snippets and machine learning jobs. Because trying is better than seeing.
FILTERS
Type
Solutions
Elastic Features
Observability
Observability Overview
Try out this hands-on demo to learn how to bring your logs, metrics, and traces together for complete visibility into your application environment.
Search
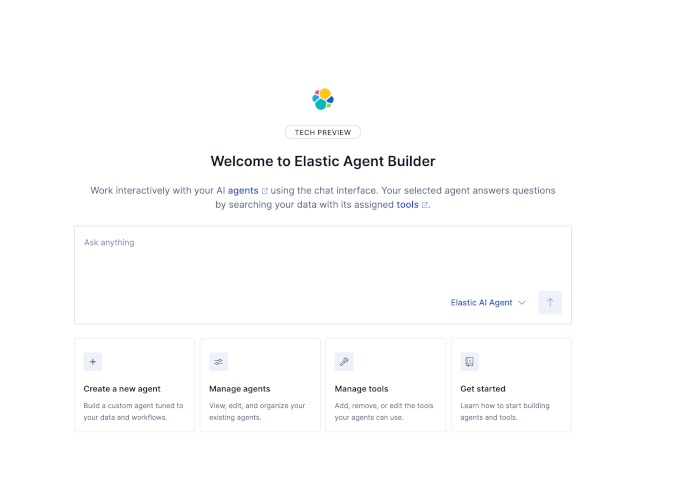
Create AI search with Elastic Agent Builder and Workflows
Watch a live demo of Elastic Agent Builder transforming traditional search into a conversational AI application in minutes. Learn how to integrate large language models (LLMs), including configuring an Azure OpenAI model, for production-ready search without a full application rebuild.
Observability
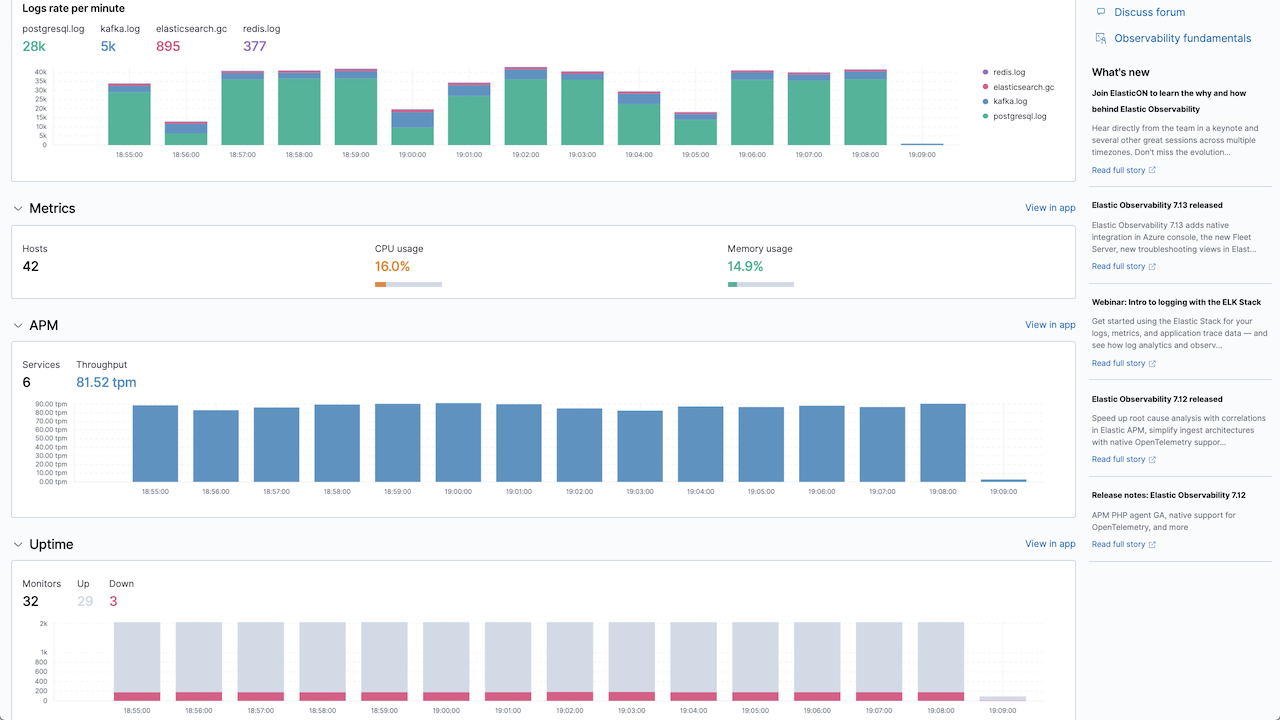
See Elastic Observability in action: 2-minute quick demo
Watch this short, two-minute demo to discover key capabilities and real-world use cases. From metrics and logs to traces and beyond, see how Elastic empowers teams to gain actionable insights and keep their environments running smoothly.
Search
Elasticsearch in 2 minutes
In this demo, we show how Elasticsearch enables production‑ready GenAI and AI‑powered search applications, from indexing and embedding your data to grounding large language models with retrieval augmented generation (RAG). You'll see how developers can go from raw data to a fully functional GenAI search experience — fast.
Search
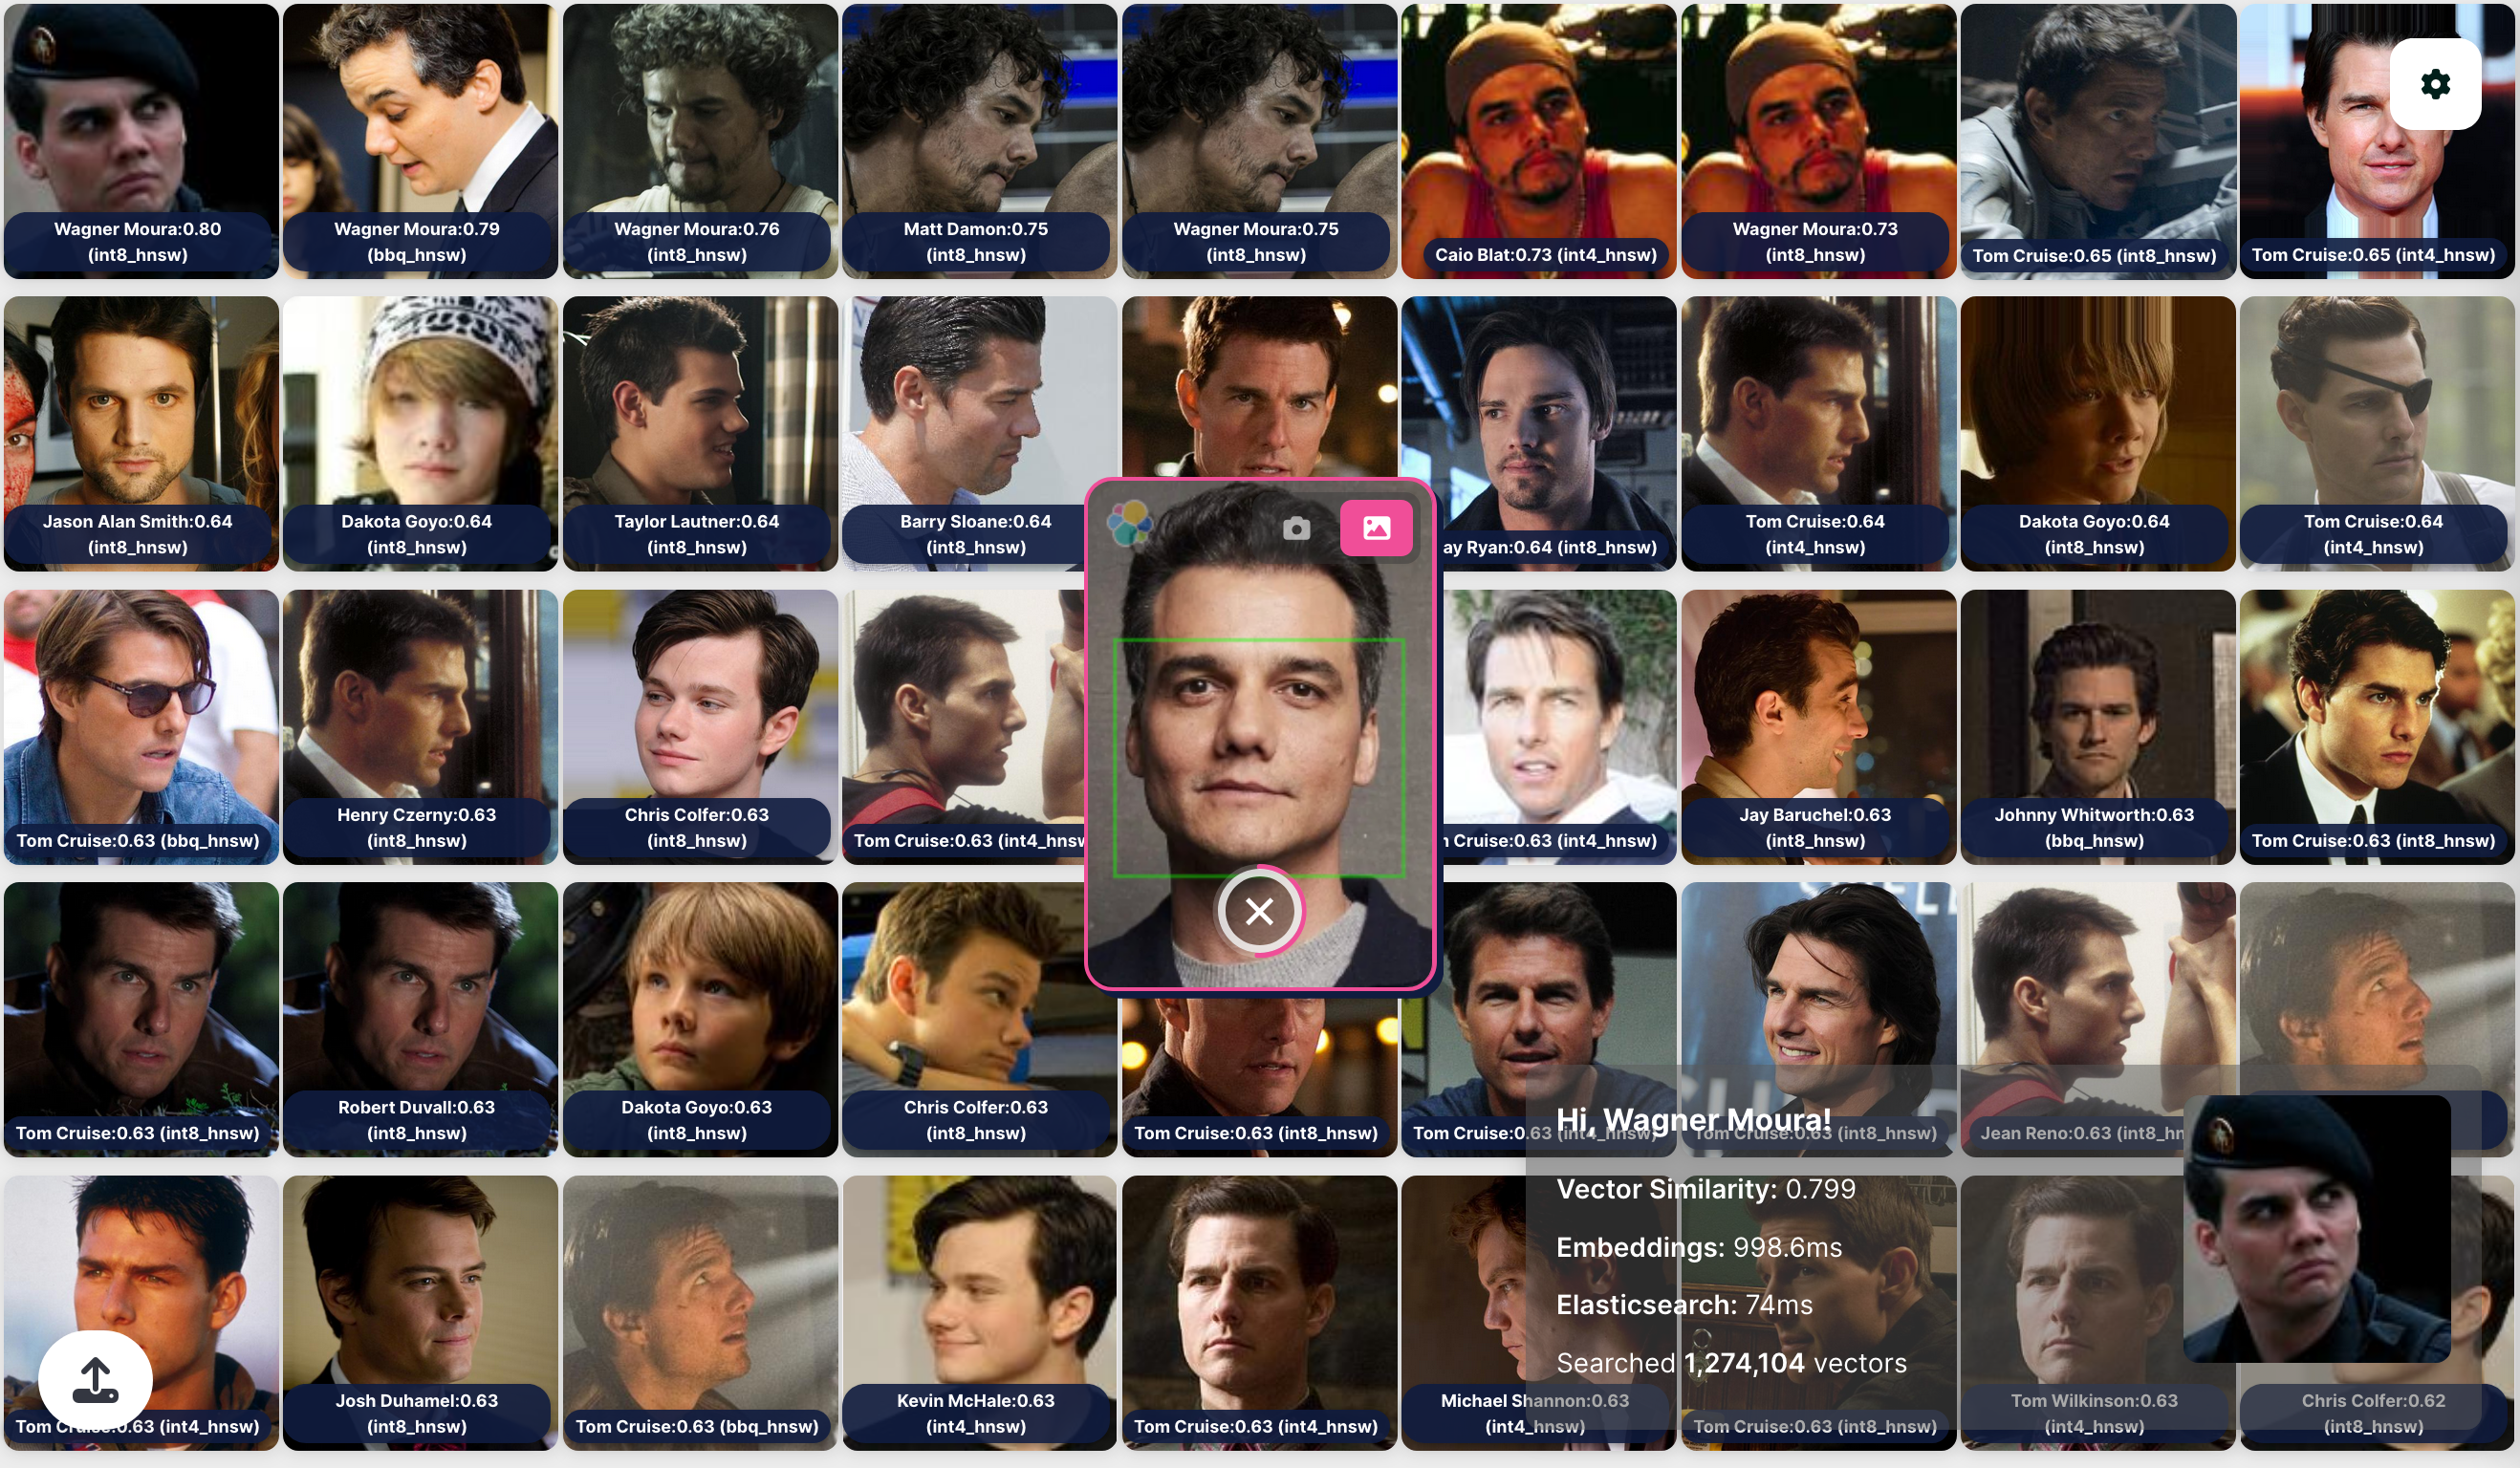
Vector Search - Celebrity Faces
Observability
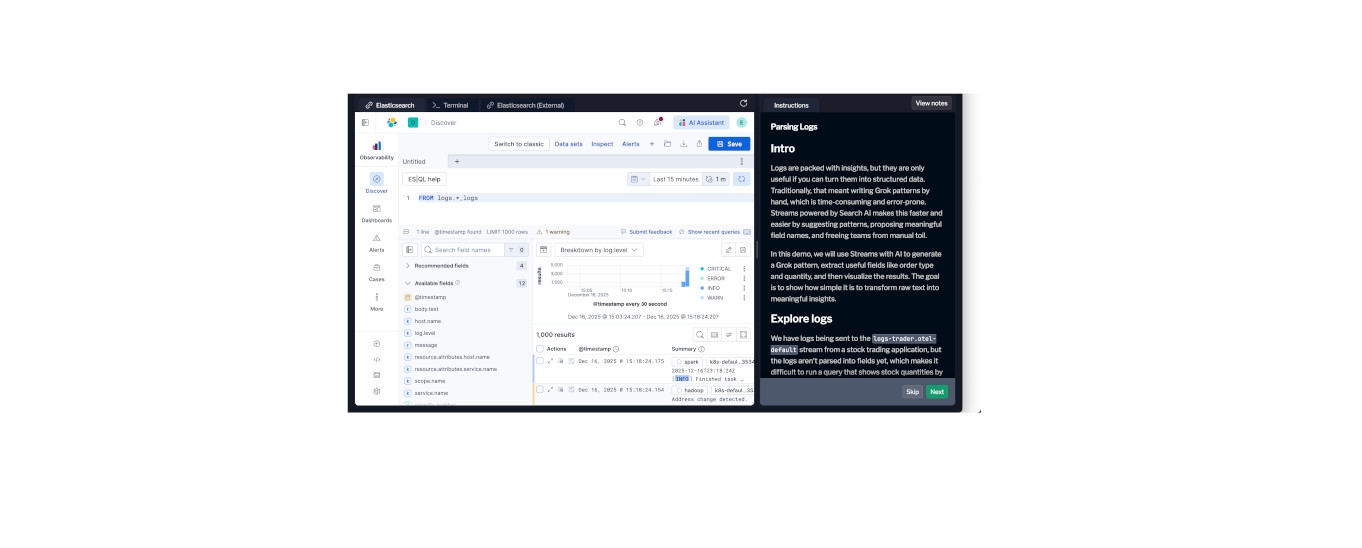
Working with Streams - Onboarding to Insights
In this hands-on workshop you will onboard new data utilizing Streams. Through the use of AI we will dynamically parse data, as well as showcase how to handle potential issues with data quality. Finally, you will learn how to easily detect events of interest while onboarding data.
Search
Elastic Agent Builder