Elastic vs. Datadog
Elastic Observability covers logs, metrics, and traces in one open platform — PromQL‑compatible, OpenTelemetry‑native, with no cardinality surcharges. Datadog bills per host, per SKU, and per cardinality tier. The result: Elastic costs over 50% less, a gap that widens as instrumentation grows.
More metrics. No cardinality tax. A fraction of the price.
Unified Observability at a fraction of the cost
 Elastic Observability:
One subscription covers logs, metrics, and traces. Pricing is based on data volume, not host counts or cardinality tiers. A 300-host environment running standard Kubernetes costs 50% less than Datadog.
 Datadog:
Infrastructure monitoring is billed per host, with OpenTelemetry (OTel), Prometheus, and Kubernetes metrics counted as custom metrics on top of container overage charges. Infinite Cardinality Metrics addresses cardinality, but the per-host and container charges remain.
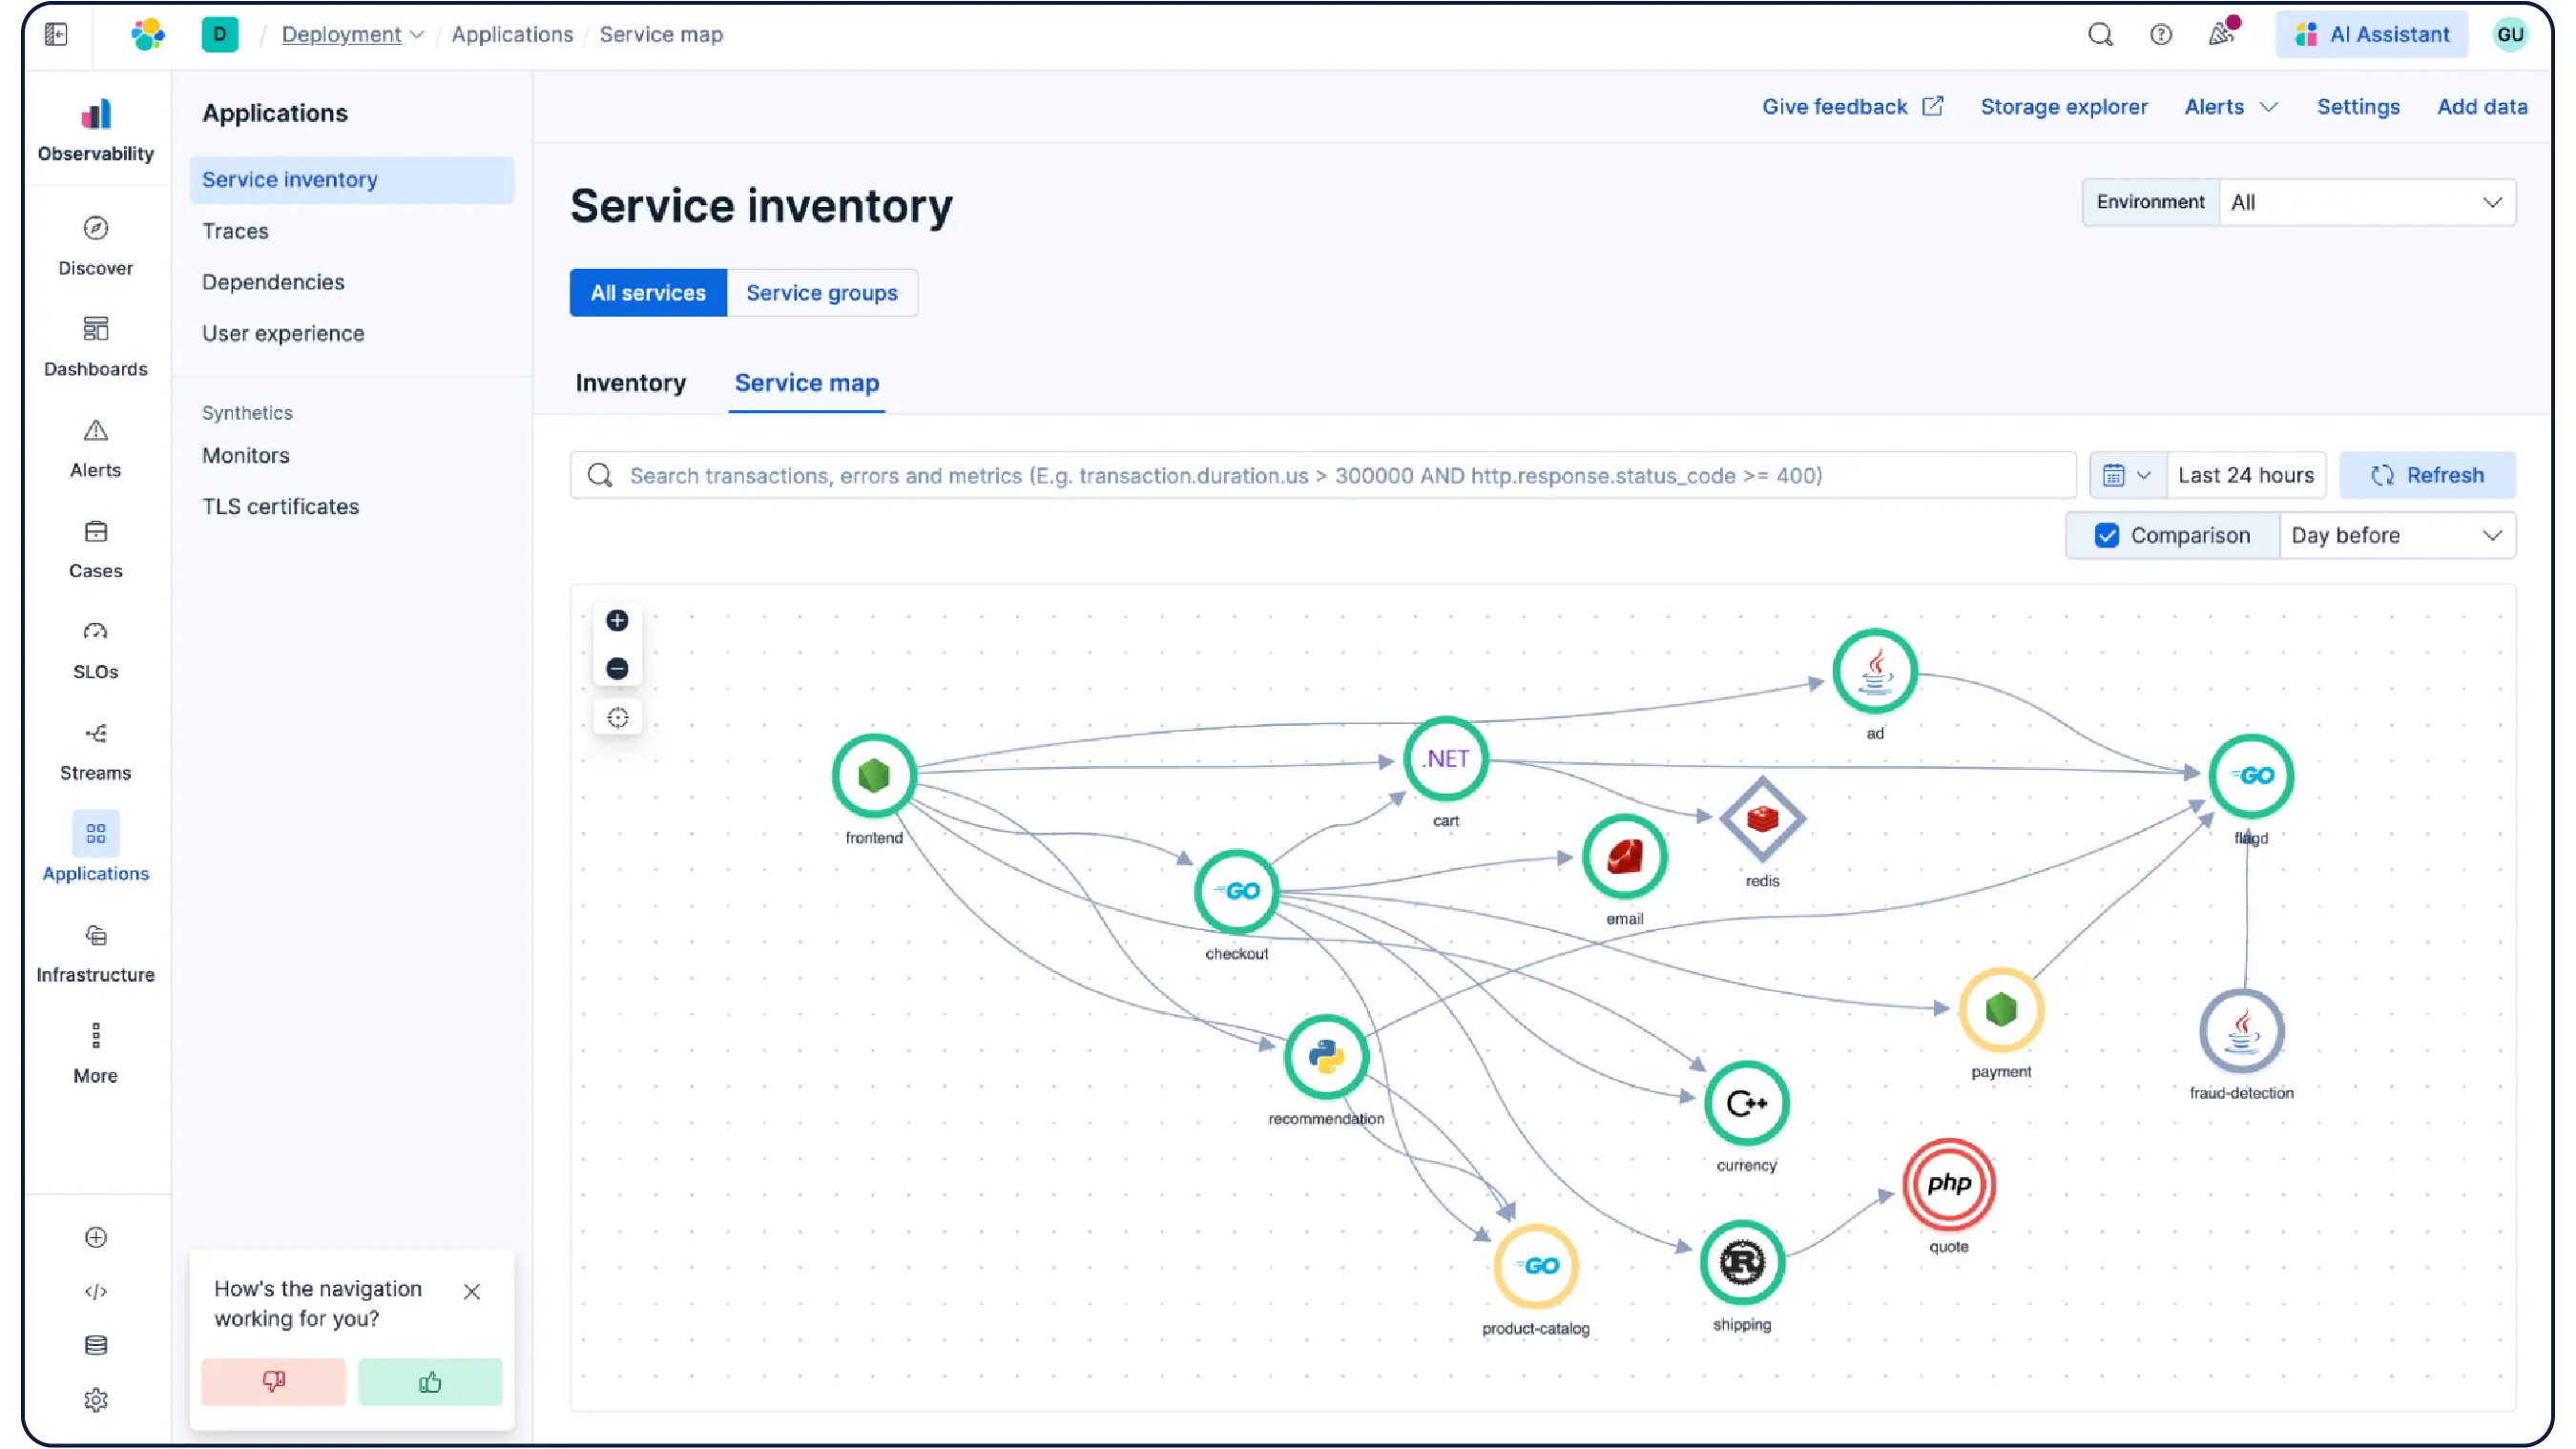
Open standards in, proprietary agents out
Elastic Observability:
EDOT provides OTel SDK with OTLP ingest and native OTel trace correlation, while full Prometheus and PromQL support means you're not tied to a proprietary collection layer. Instrument once with open standards and bring that data anywhere, including Elastic.
Datadog:
Data collection is built around Datadog's proprietary agent. Full-fidelity correlation and advanced features rely on Datadog's own instrumentation. Deploying and maintaining proprietary agents across large environments adds operational overhead and creates the switching costs that make leaving expensive.
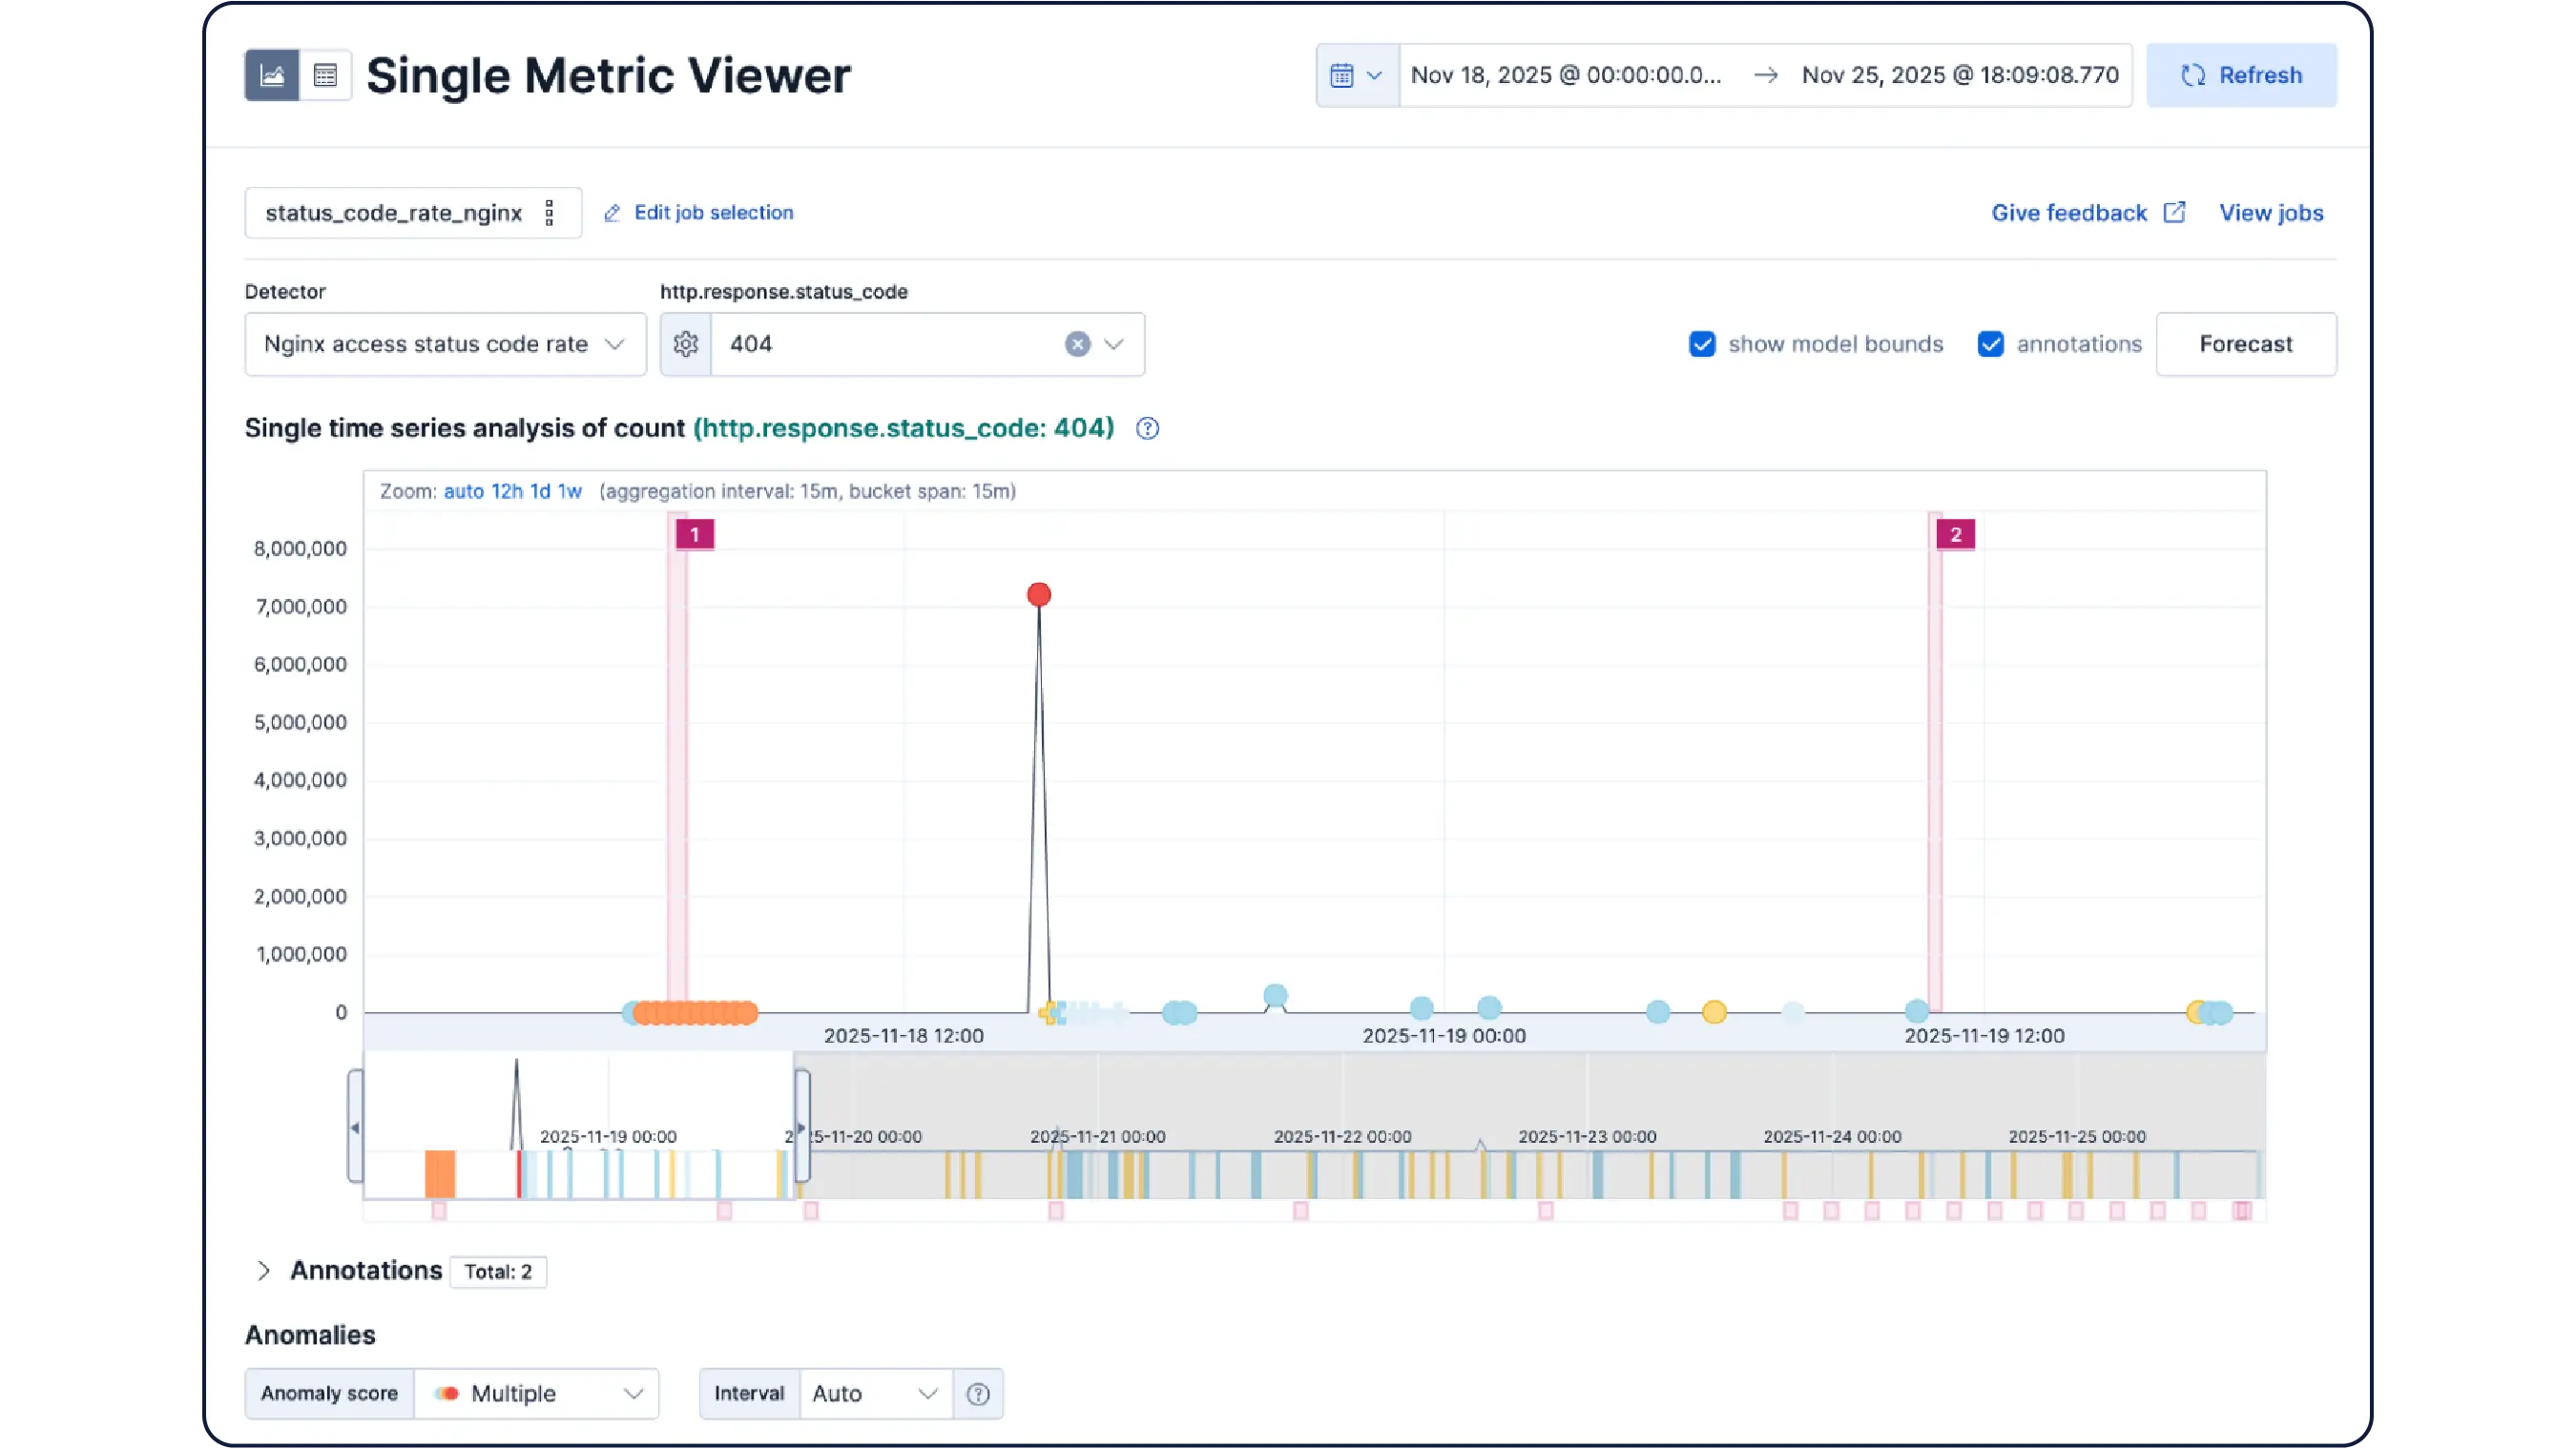
AI investigations with full context, not just what Datadog can see
Elastic Observability:
Elastic AI Agent uses retrieval augmented generation (RAG) against any data you bring in: GitHub issues, Jira tickets, Confluence runbooks, and support history. Your AI works on the complete picture, not just telemetry.
Datadog:
Bits AI SRE is scoped to what Datadog can see. External context is limited to Confluence pages and a config file; GitHub and other third-party sources remain in Preview.
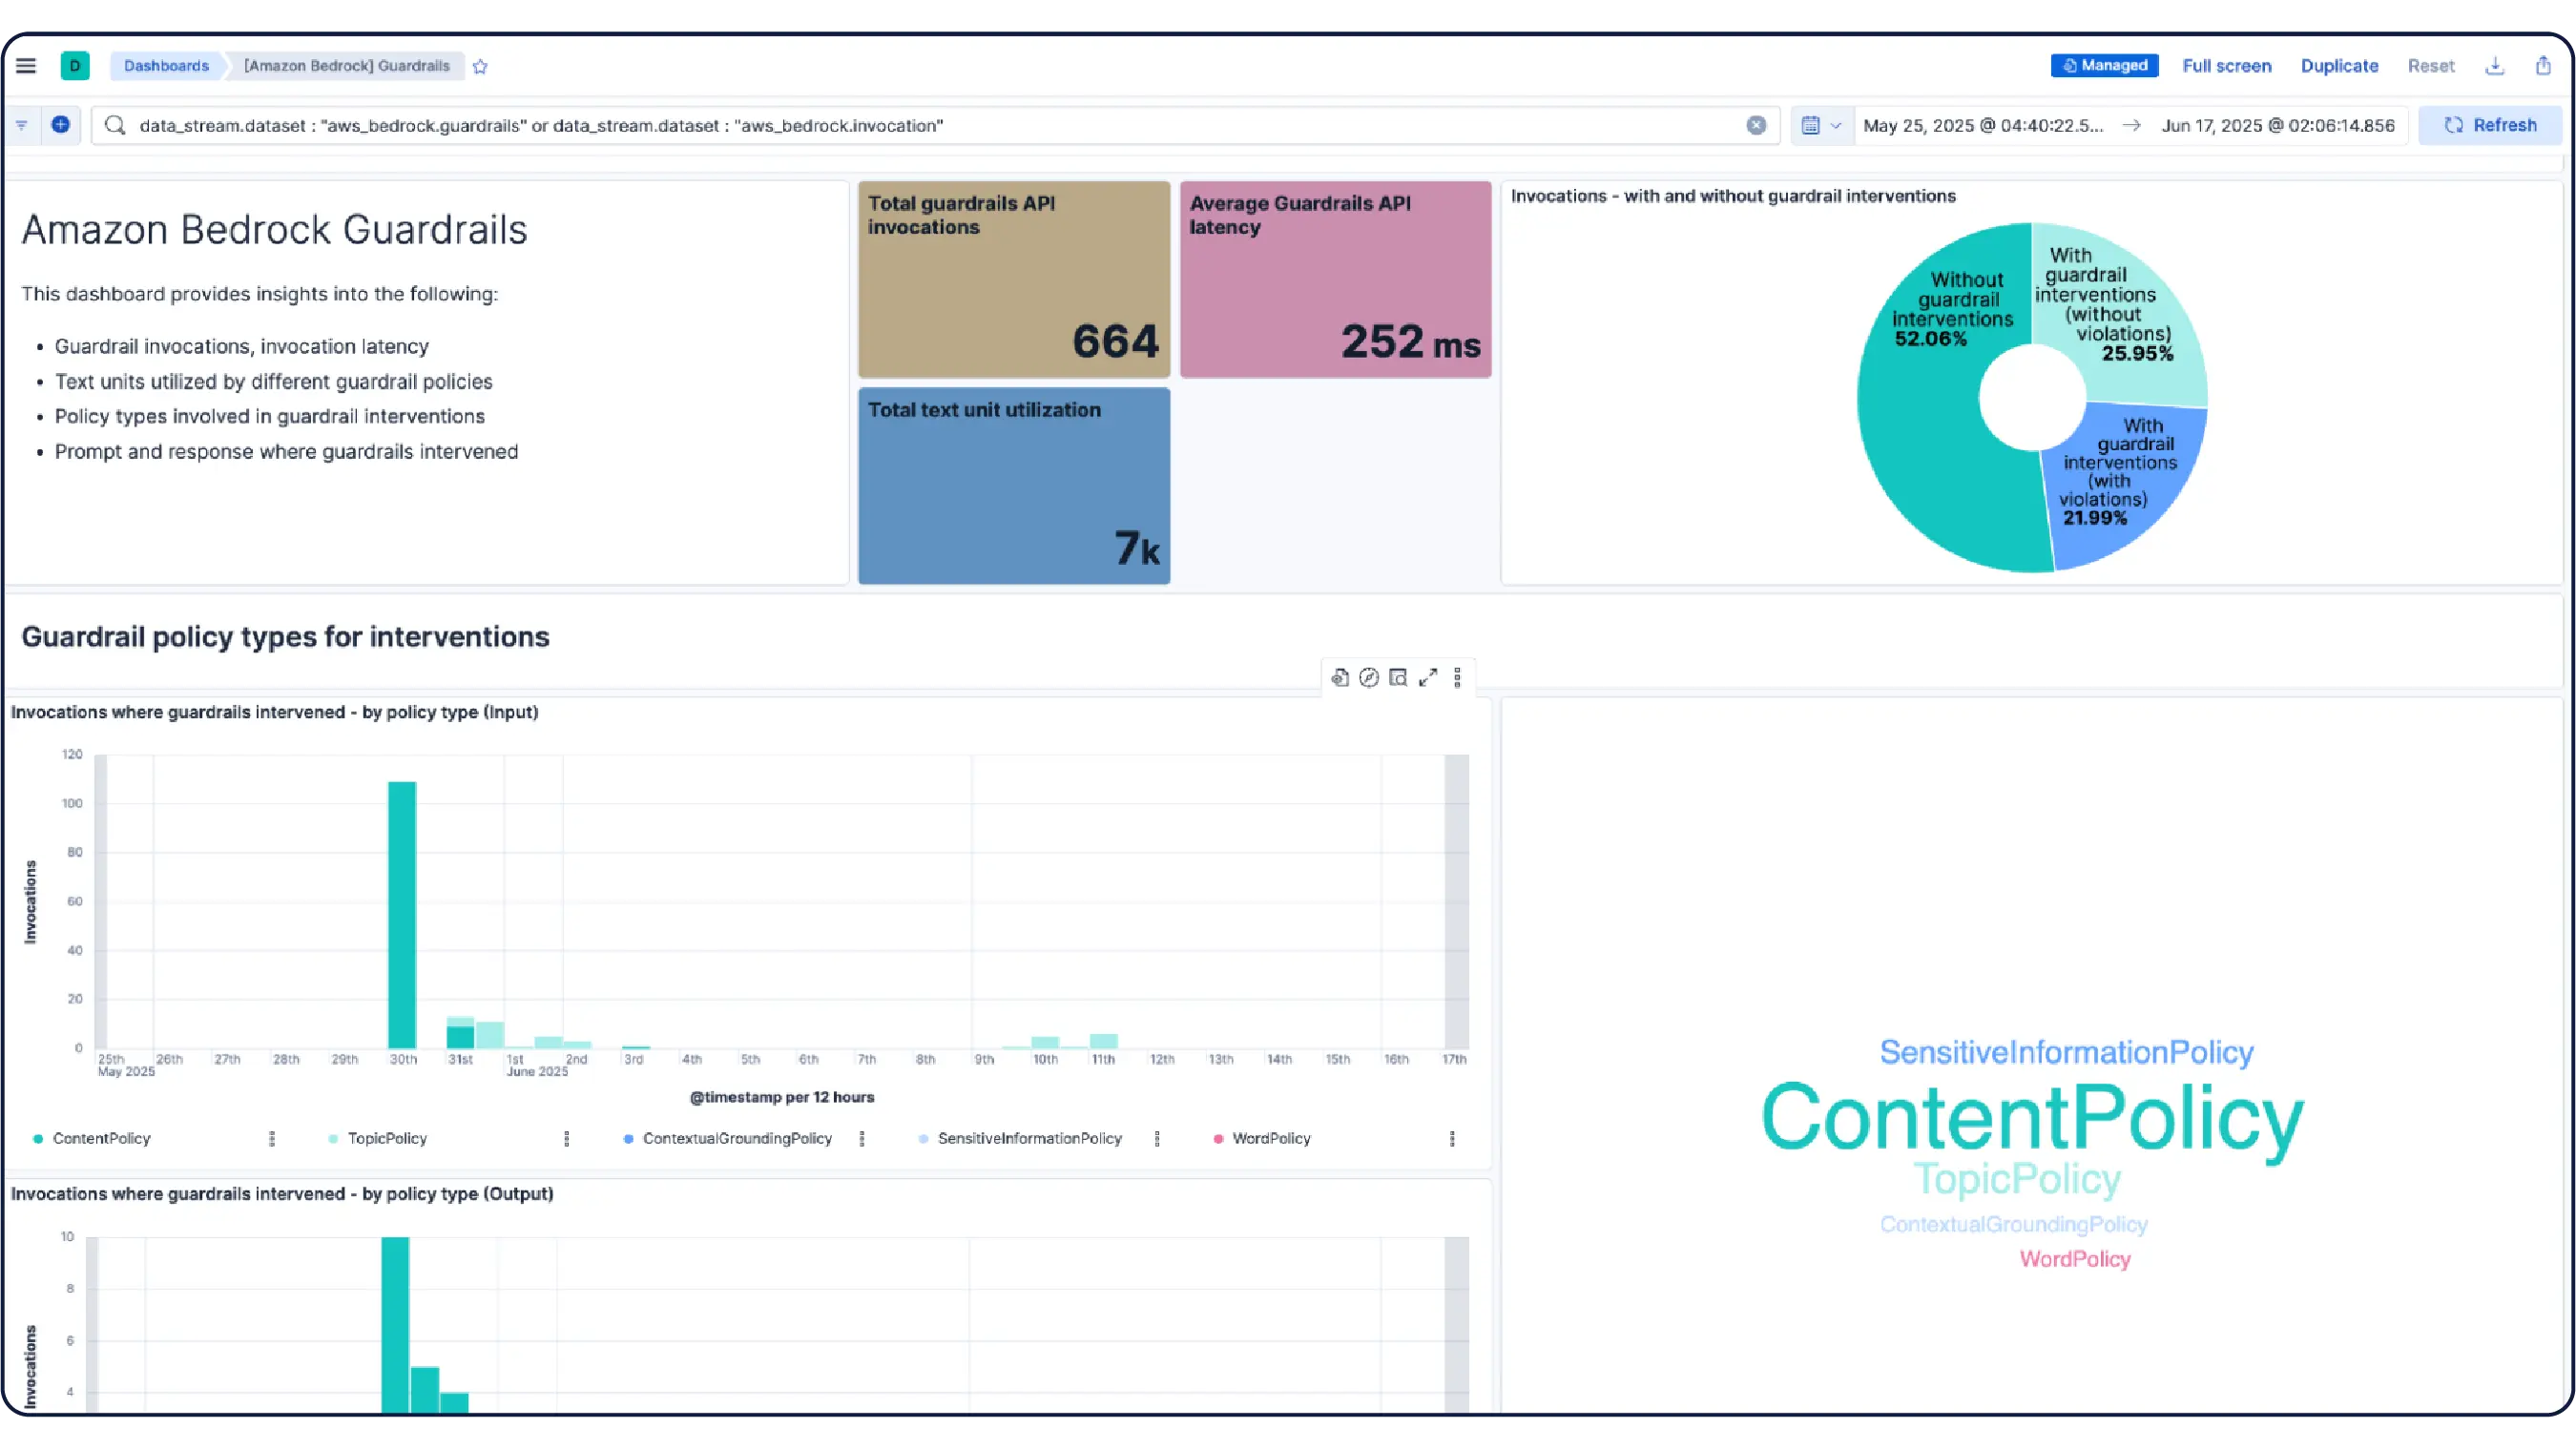
Observability that's built for growth
As environments grow, so do the telemetry volumes, and Datadog’s costs often grow with them. Elasticsearch gives teams a single platform for logs, metrics, and traces with flexible storage, long-term retention, and powerful analytics, helping you scale observability without scaling complexity or spend.
Feature-by-feature comparison
With Datadog, you're locked into its stack with per-SKU, per-host, high-water-mark billing that potentially scales against you. Elastic brings it all together in an open, extensible solution, with full-fidelity data retention and predictable costs at any scale.

Elastic
Datadog
Predictable, usage-based pricing. No per-SKU billing for individual observability capabilities.
Per-SKU, per-host billing. APM, continuous profiling and log management are each billed as separate products. Costs compound across every team and every signal type they adopt.
Data-volume-based pricing. No high-water mark billing. A traffic spike will not inflate your monthly invoice.
High-water mark billing for infrastructure monitoring. A temporary increase in your host count can inflate your bill for that month.
Elastic metrics retention at 25% of standard rate makes multi-year retention practical.
Datadog's retention costs still scale up with the subscription.
Inference API with built-in semantic models included.
No inference API with built-in semantic models.
First-class search: fuzziness, synonyms, highlighting, and nested queries at petabyte scale.
Basic log search only. No fuzzy search, semantic search, or synonym support. Search experience degrades at scale.
Single unified solution built on open standards. One subscription covers the full observability surface.
Proprietary SaaS platform. No open source core, no fully self-managed options, limited data portability.
Cloud, fully managed, self-managed, hybrid, and air-gapped deployments all available. Keep data in your own infrastructure to control egress and storage costs.
SaaS with limited BYOC. No on-premise, hybrid, or air-gapped options. Most data leaves your infrastructure and you potentially pay cloud egress on top of Datadog's subscription.
PromQL-compatible, remote write and OTLP ingest, existing dashboards migrate without modification.
Proprietary metrics query language, where existing Prometheus dashboards and alerts require rework.
Built on Elasticsearch — first-class full-text search, fuzzy search, semantic search, and aggregations at petabyte scale. Sub-second queries on large datasets.
Basic log search only. No fuzzy search, semantic search, or synonym support. Search experience degrades at high-cardinality, high-volume workloads without expensive retention add-ons.
Fine-grained access control including field-level masking and document-level security for regulated industries.
Row-level access controls available. No field-level masking or document-level security for regulated industries.
Global managed service, fully managed, self-managed (on-premises, hybrid, air-gapped). Keep data in your infrastructure and control your own storage costs.
Primarily SaaS but BYOC now available only for Logs.
One-click setup, integrated UI, low operational overhead. The Express Migration program helps teams quantify and reduce hidden costs when switching from Datadog.
SaaS setup is easy, but proprietary agent deployment across large environments adds complexity.
Some of the world's largest companies rely on Elastic
The smart, open choice that delivers uncompromised value
Customer spotlight

Achieves a holistic view of metrics, logs, events, and traces while reducing costs by 60%
Customer spotlight
Consolidated its observability tooling on Elastic and achieved a 40% cost savings
Customer spotlight

Boosts cloud infrastructure health with Elastic Observability and reduces observability expenditure by 80%