Elastic recently introduced Filebeat Modules, which are designed to make it extremely easy to ingest and gain insights from common log formats. These follow the principle that "simple things should be simple", and comes with preconfigured ingest pipelines and Kibana dashboards, which can be used out-of-the-box or as a starting point for custom dashboards.
In this blog post, we wanted to explore the on-disk storage requirements of data indexed using Filebeat modules. We will use the Apache2 Filebeat module for this analysis. Ensuring that data on disk is stored as efficiently as possible is often important because this can have a significant impact on the required cluster size at scale and the number of documents each node can handle. We will start our analysis with default Filebeat options and then explore techniques to optimize on-disk storage, while also discussing the tradeoffs associated with these optimizations. The techniques described in this blog post are based on the guidelines provided in the Elasticsearch documentation. We will show that the default settings that Filebeat modules come with save around 20% disk space compared to the Elasticsearch defaults, and that further savings of up towards 50% can be achieved with more aggressive tuning.
What are Filebeat modules?
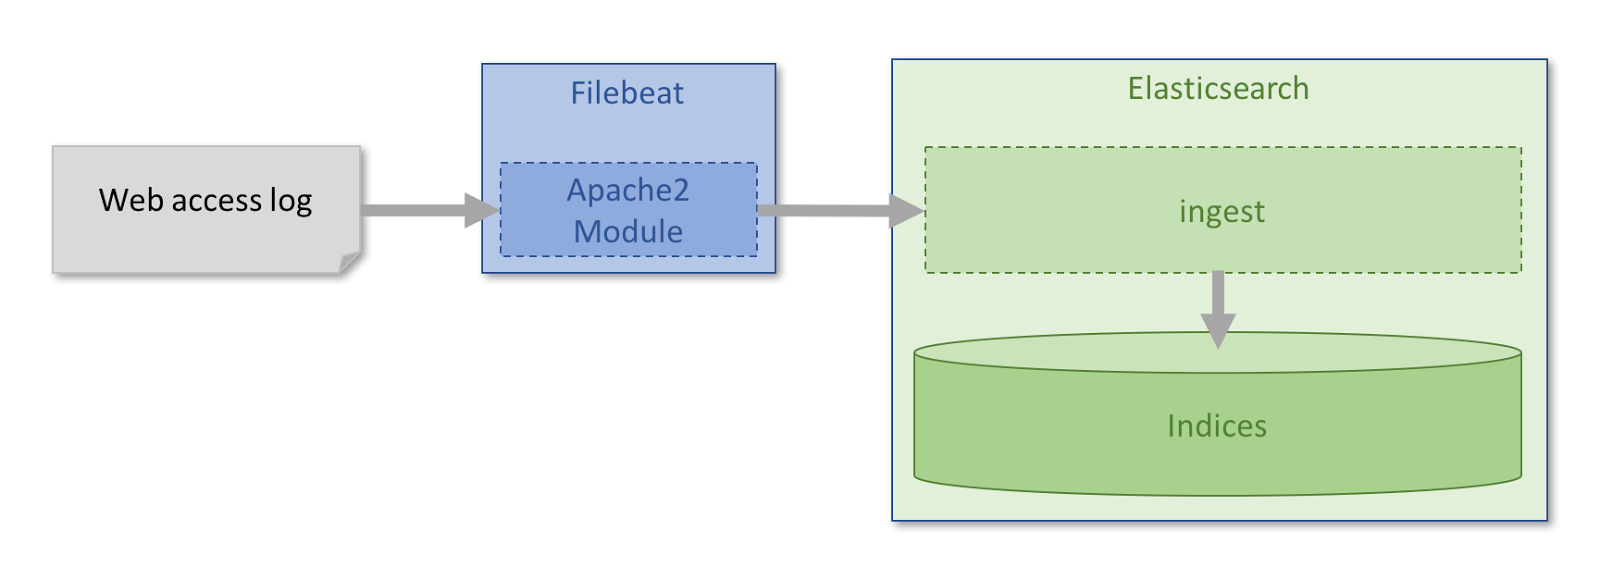
Filebeat modules simplify the collection, parsing, and visualization of common log formats. Each module handle collection, processing and visualization of files related to a specific type of logs. The Apache2 module, used in this blog post, knows the default location of the logs for the operating system being used and is able to collect and parse both access and error logs with minimal configuration. If Apache logs are stored in a non-standard location, this can easily be configured.
Data collected by the Filebeat module is forwarded to an Elasticsearch ingest node where a specialized ingest pipeline parses the logs before they are indexed into Elasticsearch. Each Filebeat module comes with optimized, standard mappings for Elasticsearch, designed to save space without sacrificing functionality.
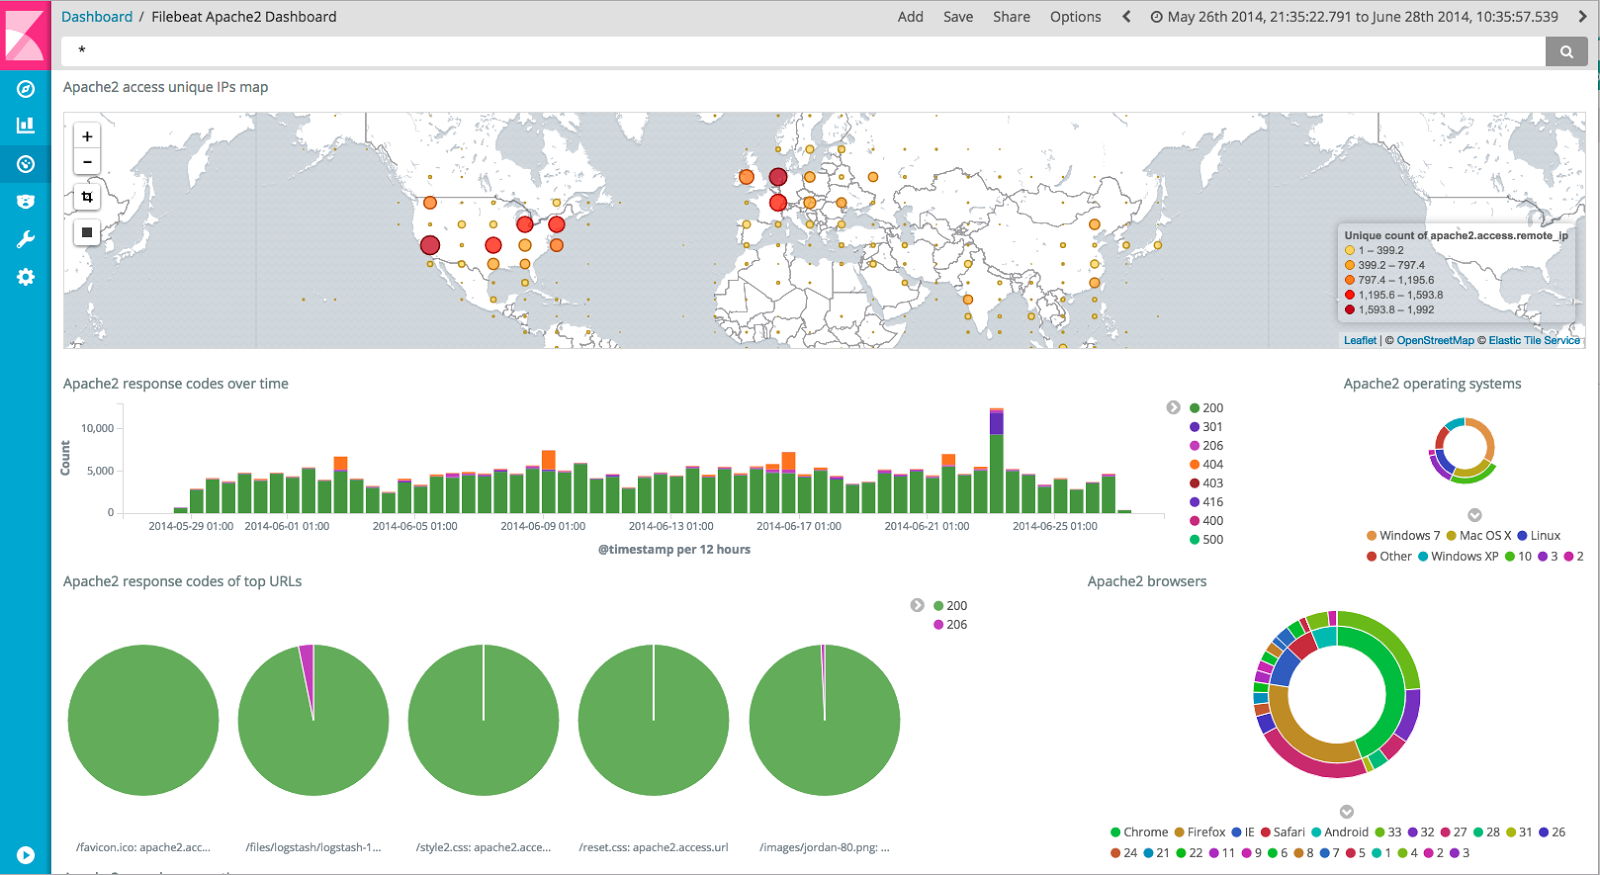
Once the data has been stored in Elasticsearch, it can be analyzed using the default Kibana dashboards that are provided as part of the module (see screenshot below)
Enrichment of web access logs
A raw Apache2 access log record will look like this when written to the log file:
85.214.196.224 - - [30/May/2014:09:31:13 -0500] "GET /files/xdotool/docs/html/files.html HTTP/1.1" 200 4465 "http://semicomplete.com/files/xdotool/docs/html/osx__hacks_8h_source.html" "Mozilla/5.0 (Macintosh; Intel Mac OS X 10_8_5) AppleWebKit/537.73.11 (KHTML, like Gecko) Version/6.1.1 Safari/537.73.11"
The default ingest pipeline used by the Filebeat Apache2 module further enriches the log before it is indexed into Elasticsearch as a JSON document with the following data and structure:
{
"input_type" : "log",
"@timestamp" : "2014-05-30T14:31:13.000Z",
"read_timestamp" : "2017-04-20T20:11:30.976Z",
"source" : "/home/ec2-user/access_log_size_test/sample_access_log",
"type" : "log",
"apache2" : {
"access" : {
"body_sent" : {
"bytes" : "4465"
},
"remote_ip" : "85.214.196.224",
"response_code" : "200",
"method" : "GET",
"url" : "/files/xdotool/docs/html/files.html",
"geoip" : {
"region_name" : "Land Berlin",
"country_iso_code" : "DE",
"city_name" : "Berlin",
"location" : {
"lat" : 52.5167,
"lon" : 13.4
},
"continent_name" : "Europe"
},
"http_version" : "1.1",
"referrer" : "http://semicomplete.com/files/xdotool/docs/html/osx__hacks_8h_source.html",
"user_agent" : {
"patch" : "1",
"os_minor" : "8",
"os" : "Mac OS X 10.8.5",
"os_name" : "Mac OS X",
"device" : "Other",
"major" : "6",
"minor" : "1",
"name" : "Safari",
"os_major" : "10"
},
"user_name" : "-"
}
},
"offset" : 2961191,
"beat" : {
"version" : "5.3.0",
"name" : "ip-10-0-0-128",
"hostname" : "ip-10-0-0-128"
},
"fileset" : {
"module" : "apache2",
"name" : "access"
}
}
The portions highlighted in bold blue is data that has been added through enrichment. The geoip section contains location-related data based on the client IP address and the user_agent section contains information about the operating system and browser of the user. These new fields added via the enrichment process lets the user ask more interesting questions of the data such as, "which city is most of my traffic coming from" or "which device or browser is the most popular?" But, the new fields also increase the size of each log record. The remaining fields represent metadata describing how and when the log entry was collected, and can be used to trace the origin.
Benchmarking test setup
For these tests, we indexed a file containing 280000 sample Apache2 access log records using the Filebeat Apache2 module. As we do not want the test data to interfere with the default Filebeat indices, we defined a fixed index name 'filebeat-test' in the configuration instead of the standard time-based index. The configuration file used is shown below:
# Filebeat Apache module
filebeat.modules:
- module: apache2
  access:
    var.paths: ["${PWD}/sample_access_log"]

# Output all access logs directly to Elasticsearch
output.elasticsearch:
  hosts: ["127.0.0.1:9200"]
  index: "filebeat-test"
The data as well as all scripts and configuration files used in this set of tests are available in a GitHub Gist.
Once the sample data had been indexed into the index using the default processing and mappings, we used the reindex API to reindex this data into other test indices. In cases where only mappings were changed, all records were reindexed directly from one index to another, and where some level of data transformation was required an ingest pipeline was used with the reindex API.
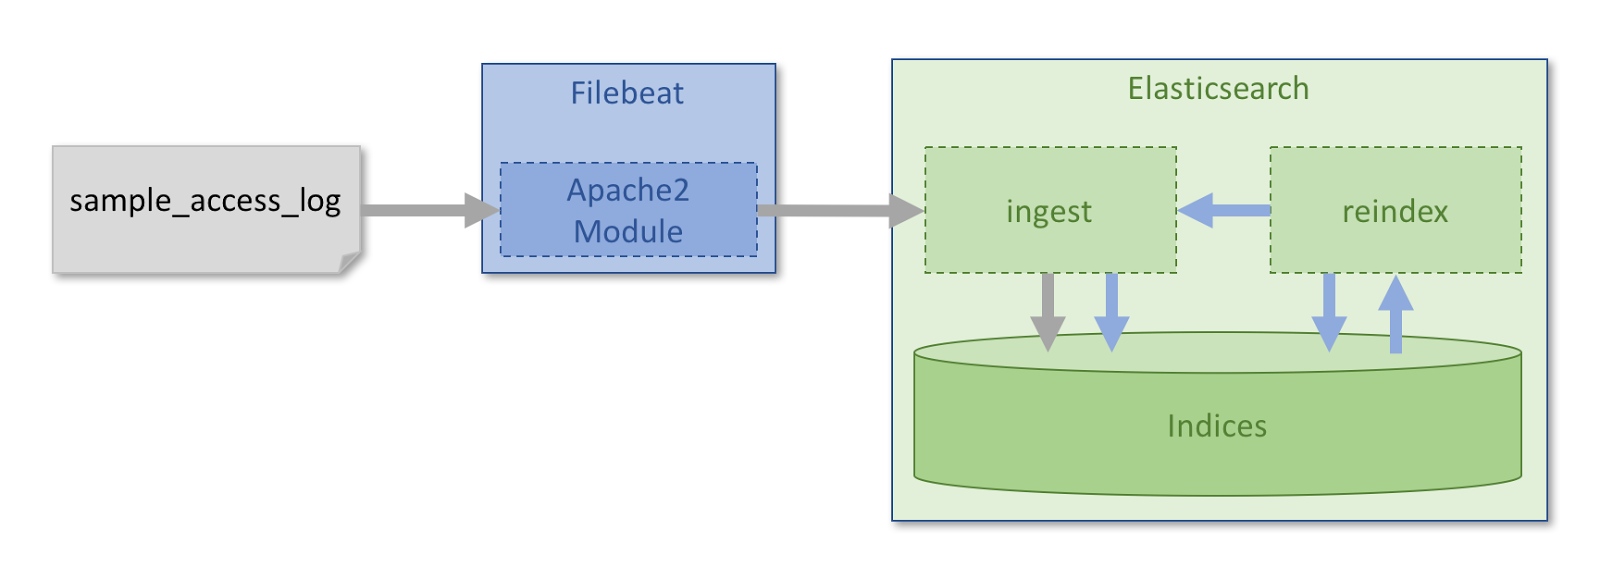
Once all the test indices had been created, we used the force merge API to reduce all indices down to a single segment per shard. This helps ensure the comparison between index sizes is fair as all the indices have been optimized to the same level.
Test 1: How optimized are the default Filebeat module mappings?
When data is indexed into Elasticsearch and no mappings have been specified, Elasticsearch will determine the type of each field the first time it is encountered and dynamically build a mapping. This is referred to as dynamic field mapping, and is designed to provide a good level of flexibility. All fields that are identified as text fields are therefore stored in text form, which allows free text search, as well as in keyword form, which typically is used when performing aggregations on the data. Some type of field, e.g. geographic location fields, can however not be dynamically mapped, and have to be specified.
Given that the data Filebeat modules processes is well known and understood, it has been possible to optimize the mappings. A lot of the fields are known to not require free-text search and can therefore be mapped just as keywords. In order to quantify how much disk space this level of optimization saves us, we reindexed the test data into a new index where we allowed all fields apart from the geographic location and event timestamp to be dynamically mapped according to the Elasticsearch defaults.
The results were encouraging as the 280000 sample records with default dynamic Elasticsearch mappings took up 118.713 MB bytes on disk while the optimized index took up only 95.360 MB bytes. That is a substantial 19.7% space saving.
If we instead compare how much space these enriched events take up on disk compared to the raw data (60.194 MB), we can see that the index with default Filebeat module settings takes up 158.4% of the raw data size.
Next we are going to perform a few additional tests to see how we can further reduce this.
Test 2: How much space can be saved by reducing the number of fields?
The default enrichment that is performed adds quite a few fields containing additional information. These can all be useful and are a sensible default option for most users who do not know exactly how they will be querying or analysing their access logs ahead of time, as it gives a good amount of flexibility.
If you however know that some of the fields will not be used, it is possible to remove these from the document and save some space that way. Exactly which fields that can be removed will vary greatly from use case to use case, and there is not any one configuration that will work for everyone. If there was, that would most likely be the default.
In order to evaluate how much space we can save by removing fields deemed unnecessary for our use case, we have chosen to only keep location, continent and country for the geoip data. This will allow us to analyse traffic based on country and/or continent and plot the geographical distribution on a map.
For user agent data we have kept the high level fields indicating operating system and browser, but removed the fields telling us exactly which versions that were used.
For the metadata related to the collection of the event, we have removed the collection timestamp, but kept all the data that allows us to trace the origin of the event. All the fields that have been removed for this test are shown in red in the sample event below:
{
"input_type" : "log",
"@timestamp" : "2014-05-30T14:31:13.000Z",
"read_timestamp" : "2017-04-20T20:11:30.976Z",
"source" : "/home/ec2-user/access_log_size_test/sample_access_log",
"type" : "log",
"apache2" : {
"access" : {
"body_sent" : {
"bytes" : "4465"
},
"remote_ip" : "85.214.196.224",
"response_code" : "200",
"method" : "GET",
"url" : "/files/xdotool/docs/html/files.html",
"geoip" : {
"region_name" : "Land Berlin",
"country_iso_code" : "DE",
"city_name" : "Berlin",
"location" : {
"lat" : 52.5167,
"lon" : 13.4
},
"continent_name" : "Europe"
},
"http_version" : "1.1",
"referrer" : "http://semicomplete.com/files/xdotool/docs/html/osx__hacks_8h_source.html",
"user_agent" : {
"patch" : "1",
"os_minor" : "8",
"os" : "Mac OS X 10.8.5",
"os_name" : "Mac OS X",
"device" : "Other",
"major" : "6",
"minor" : "1",
"name" : "Safari",
"os_major" : "10"
},
"user_name" : "-"
}
},
"offset" : 2961191,
"beat" : {
"version" : "5.3.0",
"name" : "ip-10-0-0-128",
"hostname" : "ip-10-0-0-128"
},
"fileset" : {
"module" : "apache2",
"name" : "access"
}
}
Reducing the number of fields this way resulted in a space saving of 17.3% compared to the default Filebeat modules index. Full results will be presented at the end of this blog post.
Test 3: Could we perhaps compress better?
Elasticsearch always compresses the data before it is written to disk, but offer two different compression algorithm to choose from. The default option is chosen to have as little impact on performance as possible while still giving a good compression level. It is also possible to specify a more aggressive compression algorithm which uses DEFLATE to achieve better compression ratios than the default algorithm. This is called best_compression. This additional compression does however not come for free, and uses up more CPU, particularly during indexing, which can negatively impact indexing performance. It may therefore not be the right option for all users, which is why it is not used by default.
In order to determine how much difference enabling enhanced compression can make, we reindexed the original data into a new index which had the default mappings but with best compression enabled.
This did make a significant impact on disk space and saved 17% saving compared to the default compression.
Test 4: Do we need _all this flexibility?
Elasticsearch has a special field named _all, which contains a concatenation of all the other fields in the document into a big string, which is analyzed and indexed but not stored. This field can be used to search for values in documents without knowing which field contains the value, and is useful when exploring a new data set. As the field is analyzed, it allows case insensitive search on parts of fields.
In Kibana this is used when you type text in the search bar at the top and do not specify a field. This is one of the aspects that make Kibana easy to work with, but as the _all field need to be indexed, this flexibility naturally comes at a price with respect to disk space.
If searching and filtering without having to specifying a field name is not required, this field can be disabled in order to save space. It is also possible to control exactly which fields that should be made part of the _all field through the mappings.
In Elasticsearch 5.1 an all_fields option was added to the query string query, which is what is used behind the Kibana search bar. This is enabled by default and causes all fields in the document to be searched in case the _all field is explicitly disabled and no fields are specified.
This can give an experience similar to searching the _all field, but is different in a few notable ways. As it searches all the fields in the document, the search is limited to how these are mapped. If you search for a word and expect to find a match in a field mapped as a keyword, the case will need to match. If you search for the browser 'chrome' and it is stored as 'Chrome' in the field, you will not get any match.
One way around this is to do what Elasticsearch does when it dynamically maps a string field - index it as both text and keyword. Both versions would be searched, resulting in a case-insensitive search just like the _all field provides. This will take up extra space, but might be worth it as the _all field can be removed. It is also possible to only provide this dual mapping for a subset of the fields if it is known how the data will be queried and analyzed.
As Filebeat is expected to work with versions of Elasticsearch prior to 5.1, this is naturally not used as a default option.
To evaluate the impact disabling the _all field can have, we reindexed the data into a test index with standard Filebeat module mappings, apart from the _all field being disabled. This resulted in an impressive 33.3% saving compared to Filebeat defaults.
In order to investigate the impact of not relying on the all_fields option would have on disk size, we enabled dual mappings (text and keyword) for the following fields:
- user_agent.device ["Other"]
- user_agent.os ["Mac OS X 10.8.5"]
- user_agent.os_name ["Mac OS X"]
- user_agent.name ["Safari"]
- geoip.city_name ["Berlin"]
- url ["/files/xdotool/docs/html/files.html"]
- referrer ["http://semicomplete.com/files/xdotool/docs/html/osx__hacks_8h_source.html"]
This configuration saved a still impressive 26.1% compared to Filebeat defaults. It does take up about 10% more space than when the _all field was disabled with default mappings, but retains most of the default behaviour of Kibana. Depending on requirements it is naturally possible to dual map more or less fields.
Test 5: What happens if we get aggressive?
In the previous tests we have made one optimization at a time and used the default Filebeat module mappings as baseline for comparison. In a real use case, it is naturally not necessary to select one or another and they can all be combined. To see what the combined impact of these is, we reduced the number of fields in the documents and indexed with dual mappings in order to be able to use the all_fields option and with best compression enabled.
As the various optimizations affect each other, the total gain is less than the sum of the individual tests, but still resulted in a reduction in storage size of almost 50% compared to the defaults. Comparing this to the raw file size shows that the indexed data only takes up around 80% of the raw size. If disk space is critical and you want to be even more aggressive, there is however still room for further improvement.
Conclusions
As mentioned at the beginning, the steps we have gone through in this blog post are also covered in the documentation. We have been able to show that the default mappings that Filebeat modules come with save around 20% disk space compared to default Elasticsearch mappings. It is also possible to significantly further reduce the size of indexed data on disk, but each of the optimization we evaluated and discussed comes with trade-offs that may not suit all users, which is why they are not part of the default configuration.
The full results of all the tests is shown in the table below:
|
Test |
Reduced field count |
Best compression enabled |
_all field disabled |
Dual field mappings for all_fields option |
Raw data size (MB) |
Enriched and indexed data size (MB) |
Size compared to raw data (%) |
Saving vs Elasticsearch defaults (%) |
Saving vs Filebeat defaults (%) |
|
1 |
No |
No |
No |
No |
60.194 |
95.360 |
158.4 |
19.7 |
N/A |
|
2 |
Yes |
No |
No |
No |
60.194 |
78.886 |
131.1 |
33.5 |
17.3 |
|
3 |
No |
Yes |
No |
No |
60.194 |
76.575 |
127.2 |
35.5 |
19.7 |
|
4a |
No |
No |
Yes |
No |
60.194 |
63.641 |
105.7 |
46.4 |
33.3 |
|
4b |
No |
No |
Yes |
Yes |
60.194 |
70.475 |
117.1 |
40.6 |
26.1 |
|
5 |
Yes |
Yes |
Yes |
Yes |
60.194 |
47.838 |
79.5 |
59.7 |
49.8 |
There are several individual optimizations that can be implemented, which typically will save around 20% to 30%. By combining them it is possible to save around 50% of disk space, meaning that the indexed data only takes up around 80% of the size of the raw data.
These numbers are based on realistic choices that are likely to be acceptable to a variety of users, so it is possible to reduce index size further by being even more aggressive.