AI 让攻击变得更快。您的 SIEM 平台也需要跟上。
管理这些系统的技术栈,是为另一种威胁环境而构建的。在对抗性 AI 出现之前就已效率低下的每一道供应商强加的屏障,如今都成了攻击者可利用的缺口。

博文
了解我们的自主型安全运营平台如何帮助您抵御现代威胁。

报告
在《Forrester Wave™:2025 年第二季度安全分析平台报告》中获评领导者

报告
IDC MarketScape 领导者:2024 年全球企业 SIEM
差异化因素
专为机器速度运行而设计
大多数平台本应消除屏障,却反而叠加工具 — 按终端收费、对自动化收费、隐藏 AI 推理,并将历史数据锁在归档数据恢复费用之后。Elastic 是为安全而生、而非为收费而设的智能体驱动安全运营平台。统一 SIEM、XDR 和原生自动化全部内置。AI 可在数据所在之处基于数据进行推理。


很多公司面临相同的问题
客户聚焦
 Airtel 利用 Elastic 的 AI 功能改善了网络态势,将 SOC 效率提高了 40%,并将调查速度提高了 30%。
客户聚焦

加州 EDD 将平均响应时间缩短了 99%,利用 Attack Discovery 对每月 8 万起事件中的告警进行优先级排序,并呈现最关键的威胁。
客户聚焦

Mimecast 统一可视性,推动调查,将关键事件减少 95%,重塑全球安全运维 (SecOps)。
检测调查响应
为主动型 SOC 构建的 SIEM
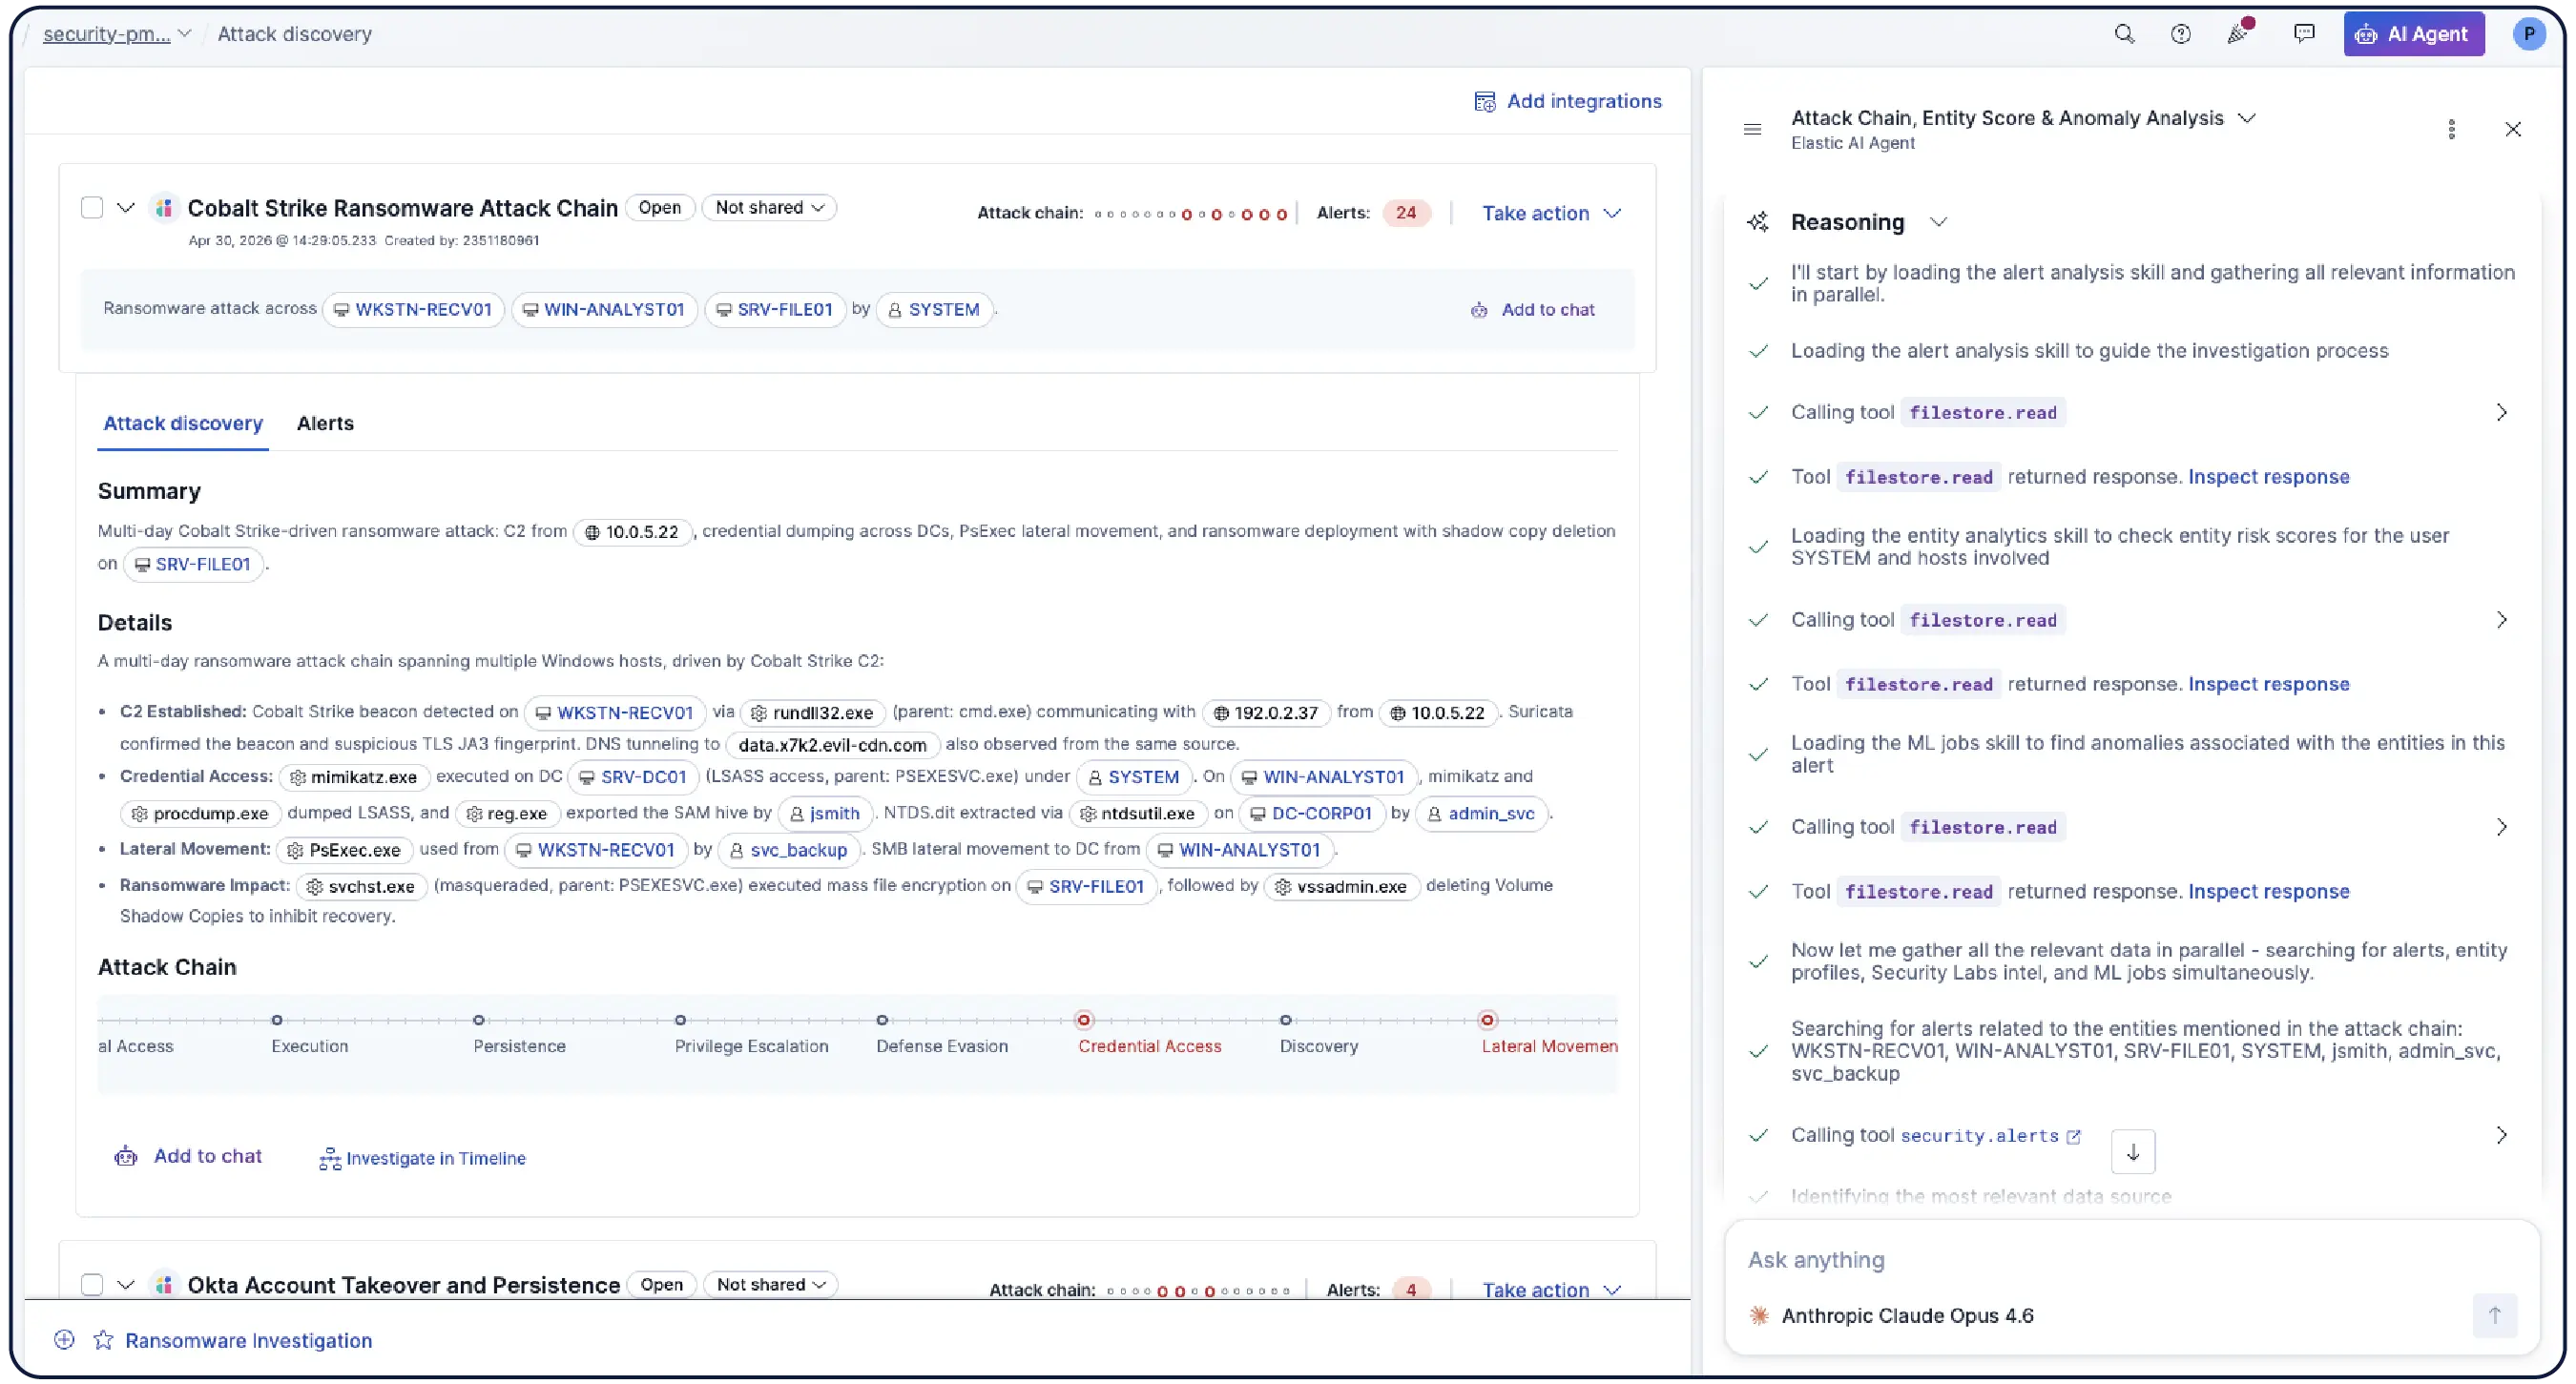
从检测到响应,全部在一个单个平台中完成。自主代理运行完整的生命周期。您的分析师负责判断、验证和批准。
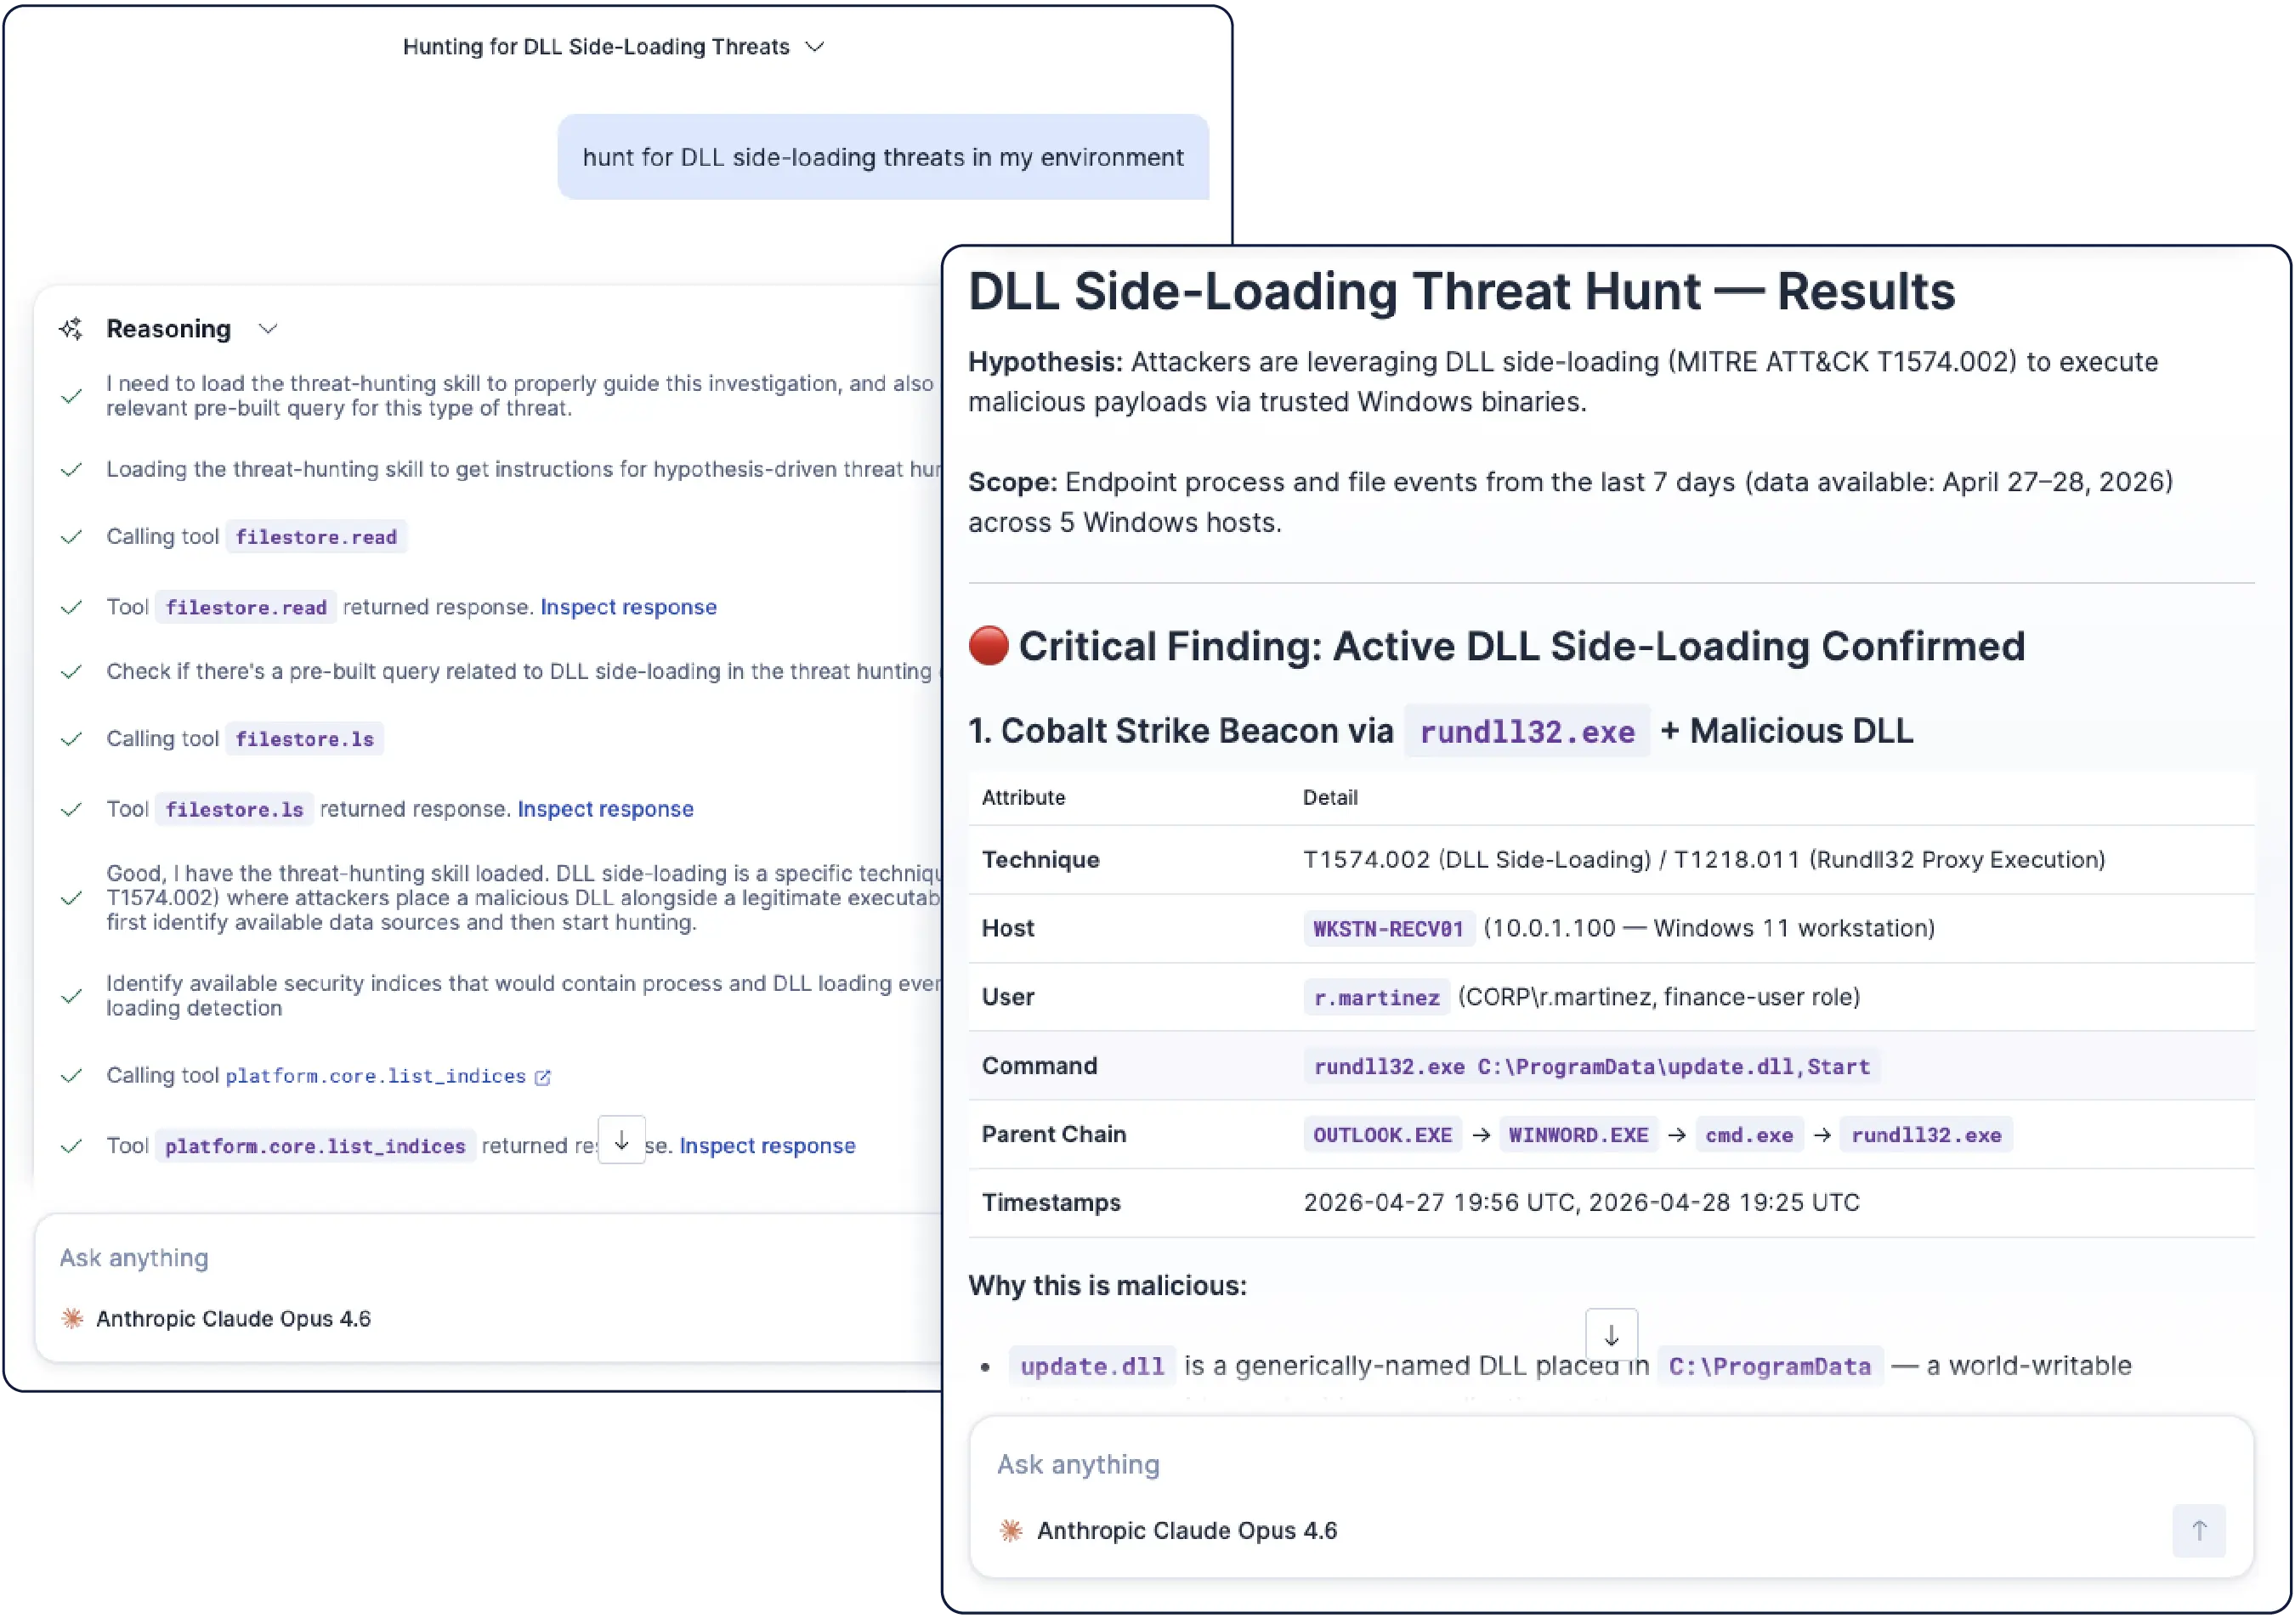
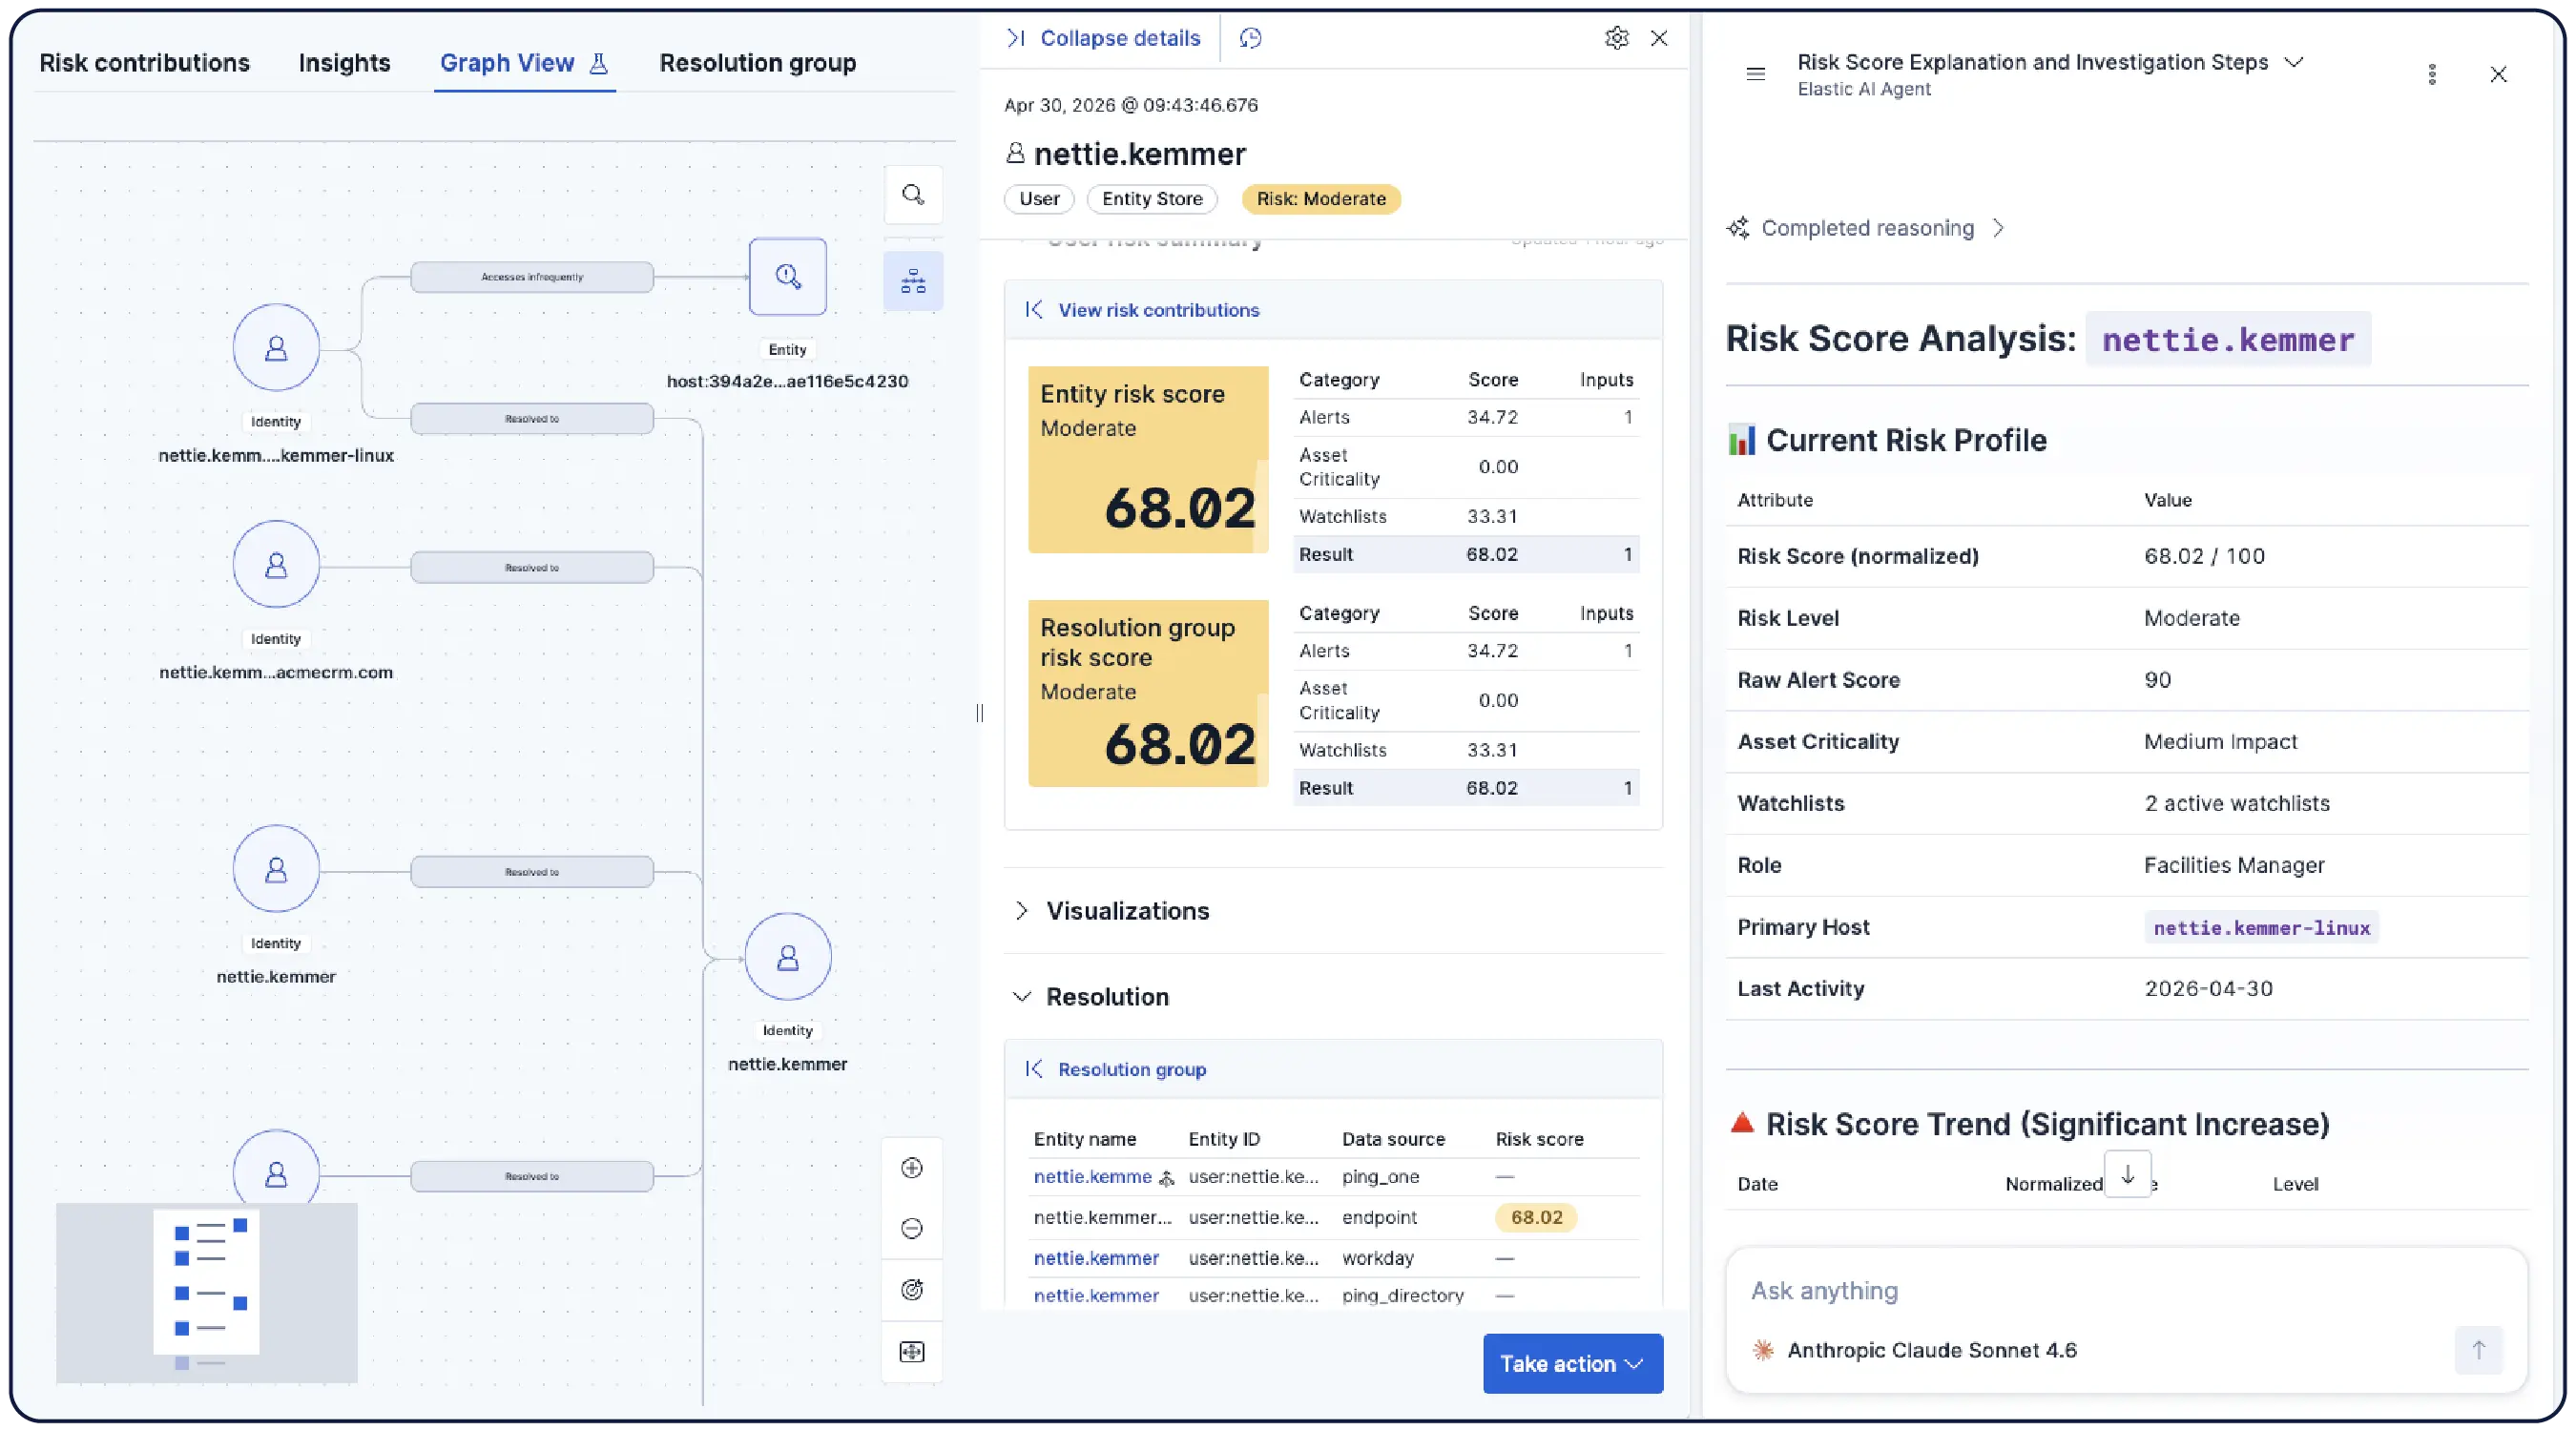
在威胁触发警报之前主动发现它们。威胁搜寻 (Threat Hunt) 技能会基于威胁情报开展假设驱动型搜寻,对实时数据运行 ES|QL 查询,并自动将发现结果映射到 MITRE ATT&CK。对于按需搜寻,只需用自然语言描述威胁,即可获得由 Elastic Security Labs 研究人员构建并验证的查询。
工作所在,即安全所在
安全分析师使用的每个界面,都可访问相同的可组合 AI 技能
以聊天为先,随处开展工作
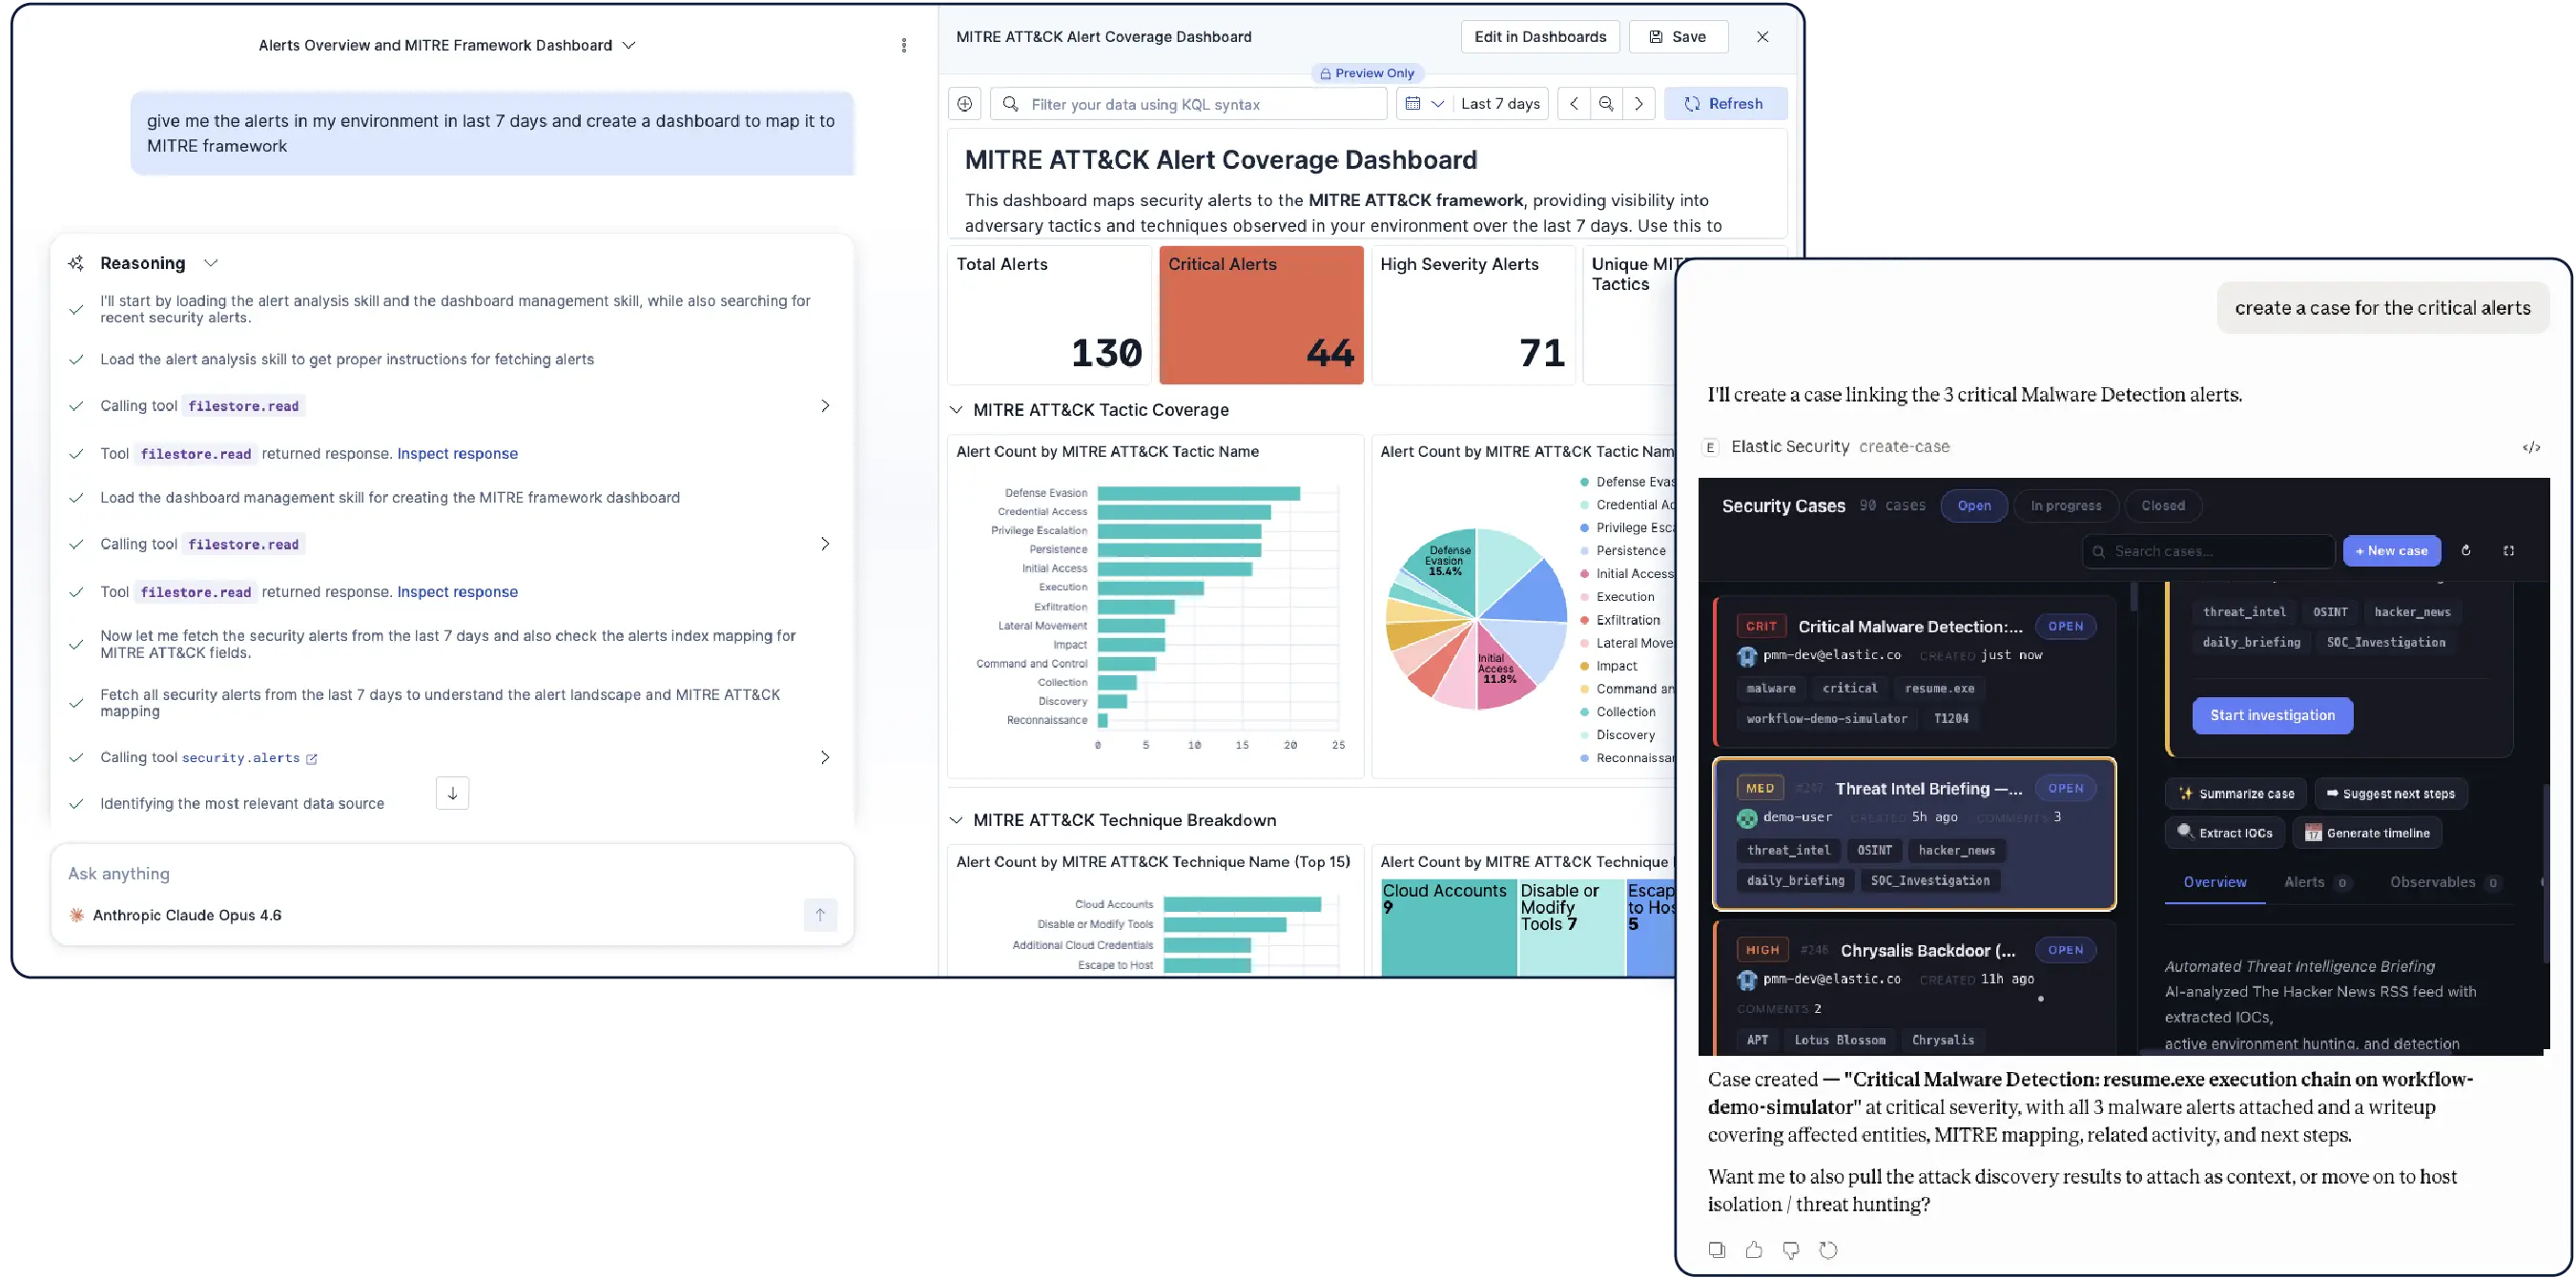
您可以从 Elastic Security 内部,或直接通过 Claude、VS Code、Cursor 以及任何兼容 MCP 的 AI 工具,提出问题并获取交互式分诊仪表板、调查图谱、可编辑检测规则、攻击链和案例操作。
专用产品视图
为整个 SOC 生命周期实现结构化工作流程。分诊队列、带有审批门的事件响应、案例管理、检测工程和 AI 技能监控都集中在单个平台上,无需切换控制台。
借助 AI,轻松上手


从数据到响应仅需几分钟
加入聊天
加入 Elastic Security 的全球社区——从开放式对话和协作到强化我们的产品。


.jpg)

常见问题
什么是 SIEM?
什么是 SIEM?
SIEM(安全信息和事件管理)是安全运营的核心平台。它负责收集并关联整个环境中的数据、检测威胁,并为分析师提供调查和响应所需的可见性。现代 SIEM 已演进为智能体驱动的安全运营平台,在整个 SOC 生命周期中融合 AI 驱动的检测、自动化调查和原生响应能力,由自主智能体处理工作,由分析师负责判断。
Elastic SIEM 如何支持智能体安全操作?
Elastic SIEM 如何支持智能体安全操作?
Elastic Security 是一个自主化安全操作平台,已包含统一的 SIEM 和 XDR。自主智能体处理从摄取到响应的完整生命周期——关联、调查实体,并分阶段制定响应计划。Elastic Workflows 的原生自动化功能负责执行响应:脚本化操作手册执行已定义的任务,智能体推理则处理复杂调查。Elastic AI 智能体开箱即用,内置专为每个 SOC 阶段设计的专用技能。分析师负责判断、验证和批准。
什么是安全运营中的 AI 技能?
什么是安全运营中的 AI 技能?
AI 技能是专为特定目的构建的能力,可教会 AI 智能体如何执行特定安全任务 — 威胁搜寻、警报分析、检测工程、实体分析等。与通用 AI 不同,这些技能专为 SOC 分析师每天运行的具体工作流而设计。每项技能都会针对单一任务打包专用指令和工具,并仅在需要时加载 — 让智能体保持轻量、准确,而不是被臃肿的系统提示词拖累。技能还可以协同工作 — 警报分析可交接给实体分析,威胁搜寻可向检测流水线提供输入 — 无需分析师管理每一次交接。一个智能体,每次调用恰当技能。
AI 技能如何在 Elastic Security 中运行?
AI 技能如何在 Elastic Security 中运行?
Elastic 通过 Elastic AI Agent 开箱即用地提供安全技能,无需配置。开箱即用的安全技能涵盖威胁搜寻、警报分析、检测工程、实体分析和异常调查。还提供用于创建仪表板、编写 Workflows 和创建图表的平台技能,让分析师可以通过对话构建仪表板、编写自动化并可视化攻击路径。技能可自动相互调用,并通过 Workflows 或按需通过 Agent Builder 运行。团队也可以构建适合自身环境的自定义技能。您可以在 Elastic Security 内访问这些技能,也可以通过 Claude、Cursor 和 VS Code 等任何兼容 MCP 的 AI 工具访问。每一步推理都可见且可审计。
Elastic SIEM 如何与 Claude、Cursor 等 AI 工具协同工作?
Elastic SIEM 如何与 Claude、Cursor 等 AI 工具协同工作?
Elastic Security 可通过任何兼容 MCP 的 AI 工具访问,包括 Claude、Cursor、VS Code 和 GitHub Copilot。借助 Elastic Security MCP App,分析师无需离开已经在使用的 AI 工具,即可分诊警报、开展威胁搜寻、管理案例,并与检测规则交互。Elastic Security 内部可用的相同技能,也可在外部使用。安全工作发生在分析师所在的任何地方,而不只是在专用控制台内。
Elastic SIEM 是否包含 SOAR?
Elastic SIEM 是否包含 SOAR?
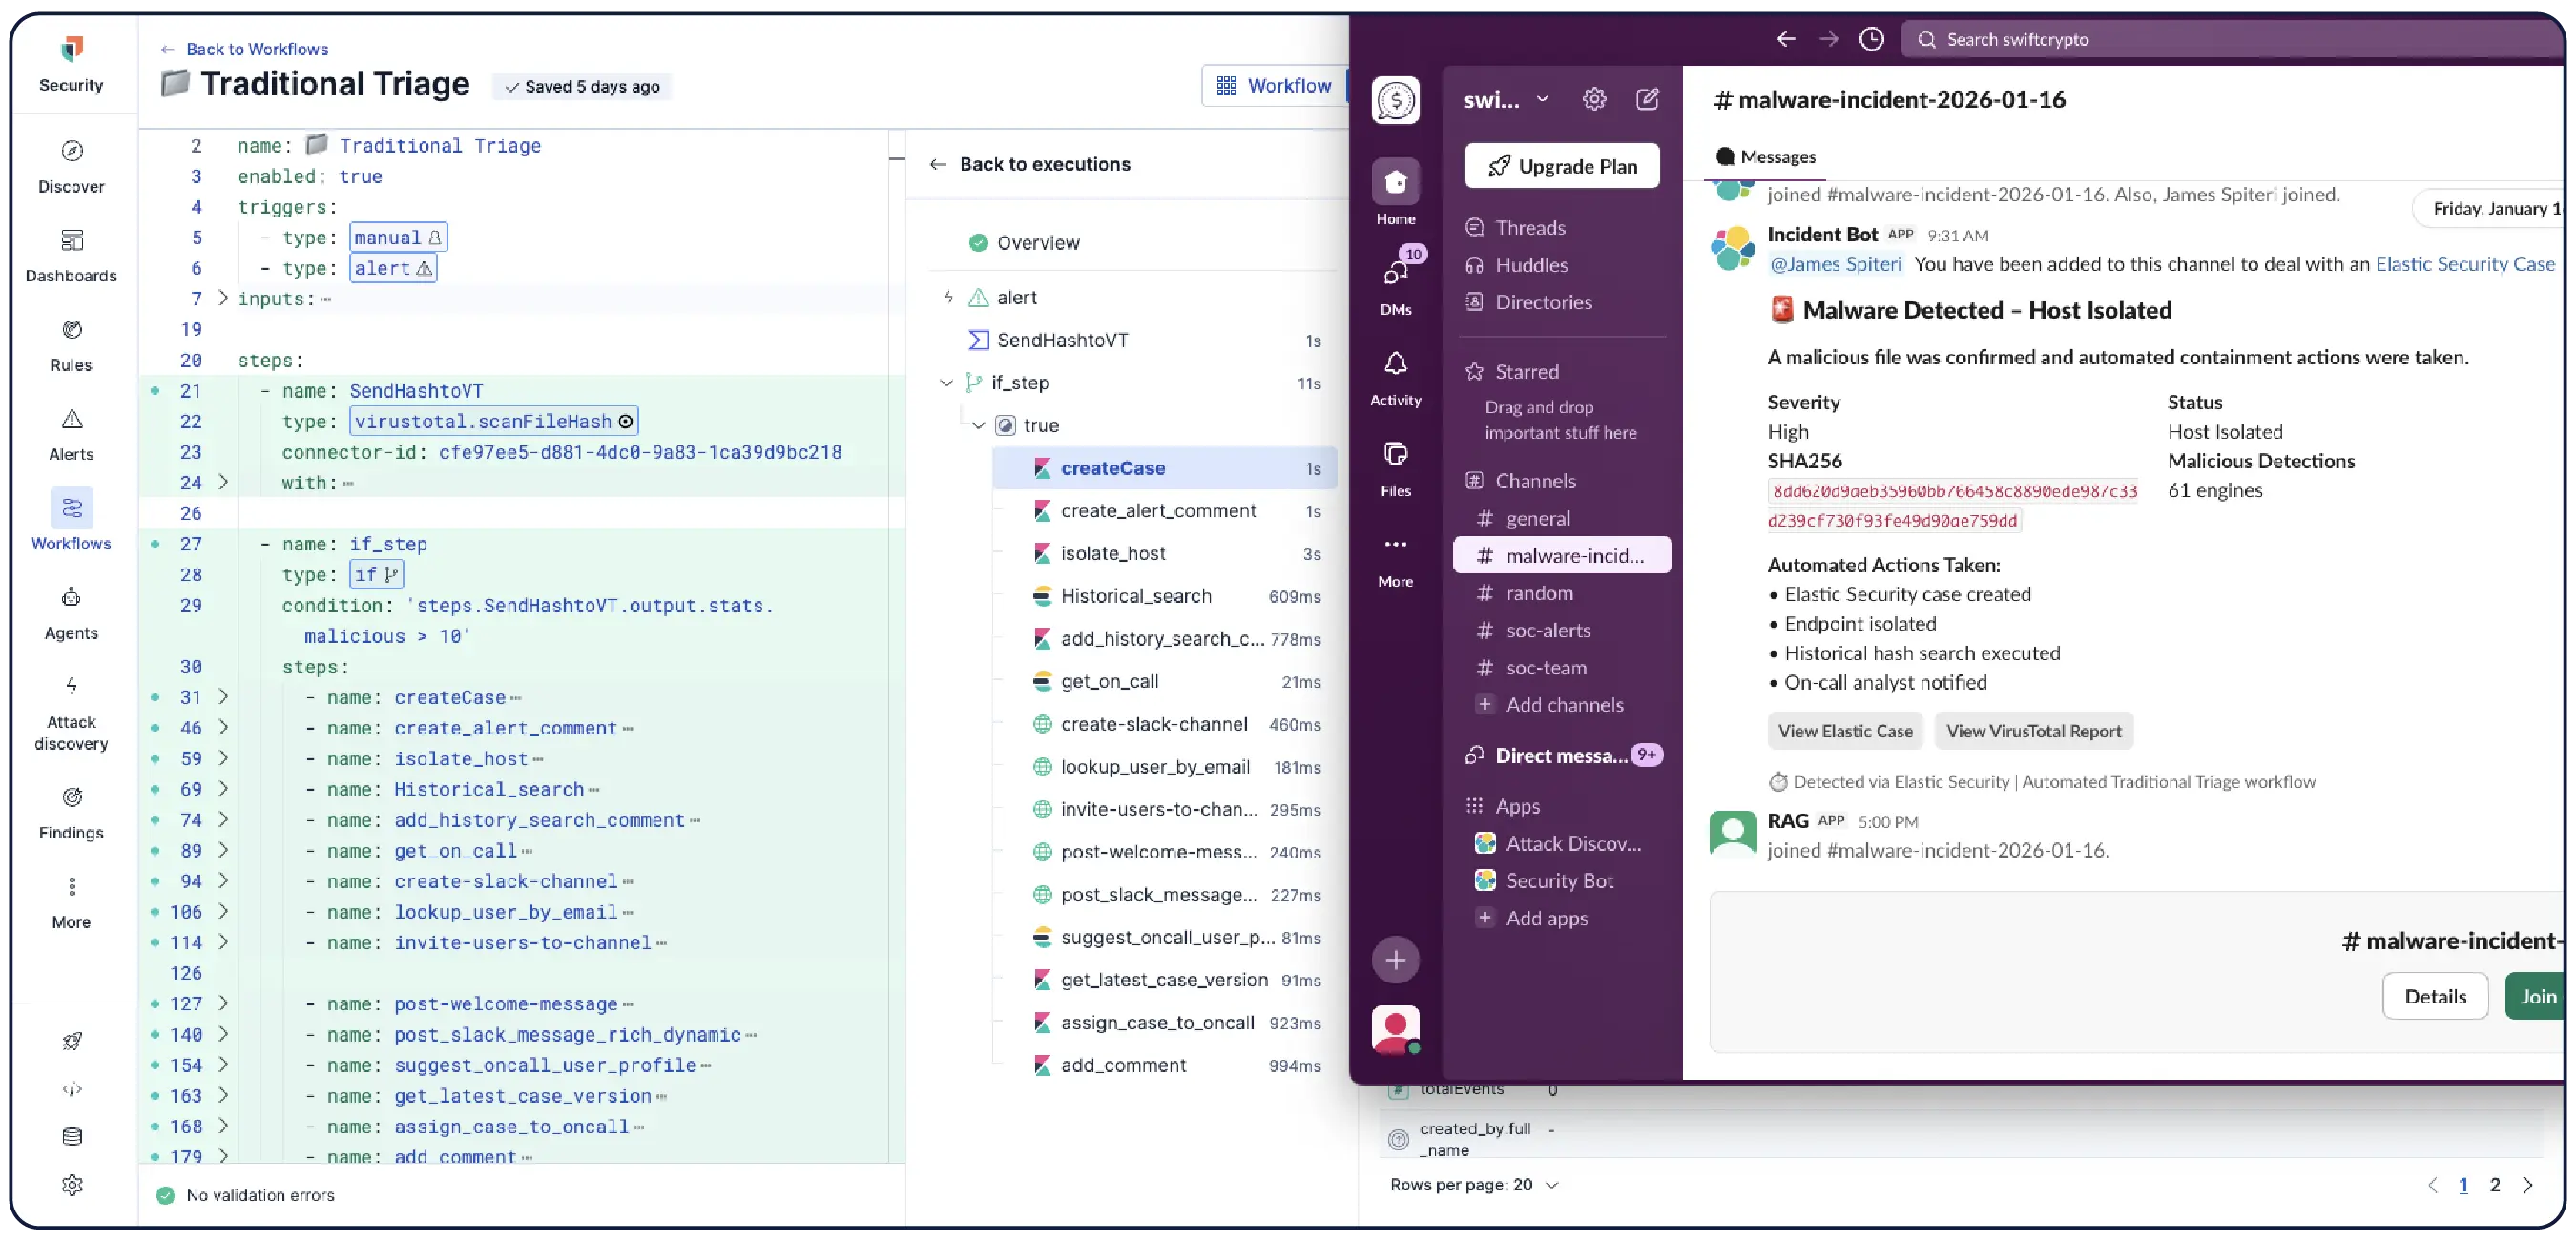
是的。Elastic Workflows 可将本机自动化直接引入 Elastic Security(您的安全数据已存在于 SIEM 中)。它可以跨每个警报和调查自动进行分类、扩充、响应、通知和案例管理。工作流结合了针对已定义任务的脚本式自动化和针对复杂调查的智能体推理,使 AI 智能体能够根据调查结果采取行动。无需购买、集成或维护单独的 SOAR。不会在事件发生时中断集成。
是什么让 Elastic SIEM 与传统的 SIEM 平台不同?
是什么让 Elastic SIEM 与传统的 SIEM 平台不同?
Elastic 是统一 SIEM、XDR 和原生自动化的智能体驱动安全运营平台。检测规则由 Elastic Security Labs 开发,经社区验证,并开放供审查。该平台可部署在本地、云端或气隙环境中,无需移动数据。传统 SIEM 会在终端、自动化、AI 和数据访问方面强加结构性税费,而 Elastic 为消除这些税费而构建。
传统 SIEM 平台中的隐性负担是什么?
传统 SIEM 平台中的隐性负担是什么?
传统安全平台会向 SOC 团队强加四种结构性税费 — 这些成本和障碍在对抗性 AI 出现之前就已效率低下,如今更成了一种负担。
- 终端税:按设备定价,迫使团队在覆盖范围上做取舍。由于全面覆盖成本过高,团队不得不让部分终端处于未监控状态。Elastic 内置 XDR 和终端遥测,且不按设备收费 — 覆盖每个终端,不再由定价模型决定覆盖范围。
- 自动化税:需要单独的 SOAR 许可,才能让 SIEM 采取行动。Elastic Workflows 是平台的原生功能。无需购买、集成或维护单独产品。
- AI 黑盒税:专有 AI 隐藏推理过程,导致团队无法验证代表他们做出的决策。Elastic 的 AI 是透明的 — 每项决策背后的提示词、查询和推理都清晰可见。支持任何 LLM,包括适用于气隙环境的本地部署模型。
- 数据税:归档数据恢复延迟和摄取上限,会在活跃调查期间让历史数据无法触达。Elastic 可在数据所在之处查询数据 — 多年历史数据可与实时数据在同一查询中搜索,无需等待归档数据恢复,也不会产生惩罚。
这四项税费共同构成了结构性屏障,割裂安全运营,并制造对手可利用的缺口。Elastic 旨在消除这四项税费。
Elastic SIEM 能否在气隙环境或本地部署环境中运行?
Elastic SIEM 能否在气隙环境或本地部署环境中运行?
是的。Elastic 可部署在本地、云端或气隙环境中,且无需移动数据。联合搜索可以跨分布式部署运行查询,而无需集中化数据。AI 推理支持适用于气隙环境的本地 LLM,无需依赖供应商的云模型。Elastic Cloud 持有 PCI DSS、HIPAA、FedRAMP、GDPR 和 TISAX 等认证,完整文档可在我们的 Trust Center 中查看。这使 Elastic 成为国防、政府和受监管行业的首选平台,适用于具有严格数据驻留和合规要求的环境。
Elastic SIEM 支持哪些数据源?
Elastic SIEM 支持哪些数据源?
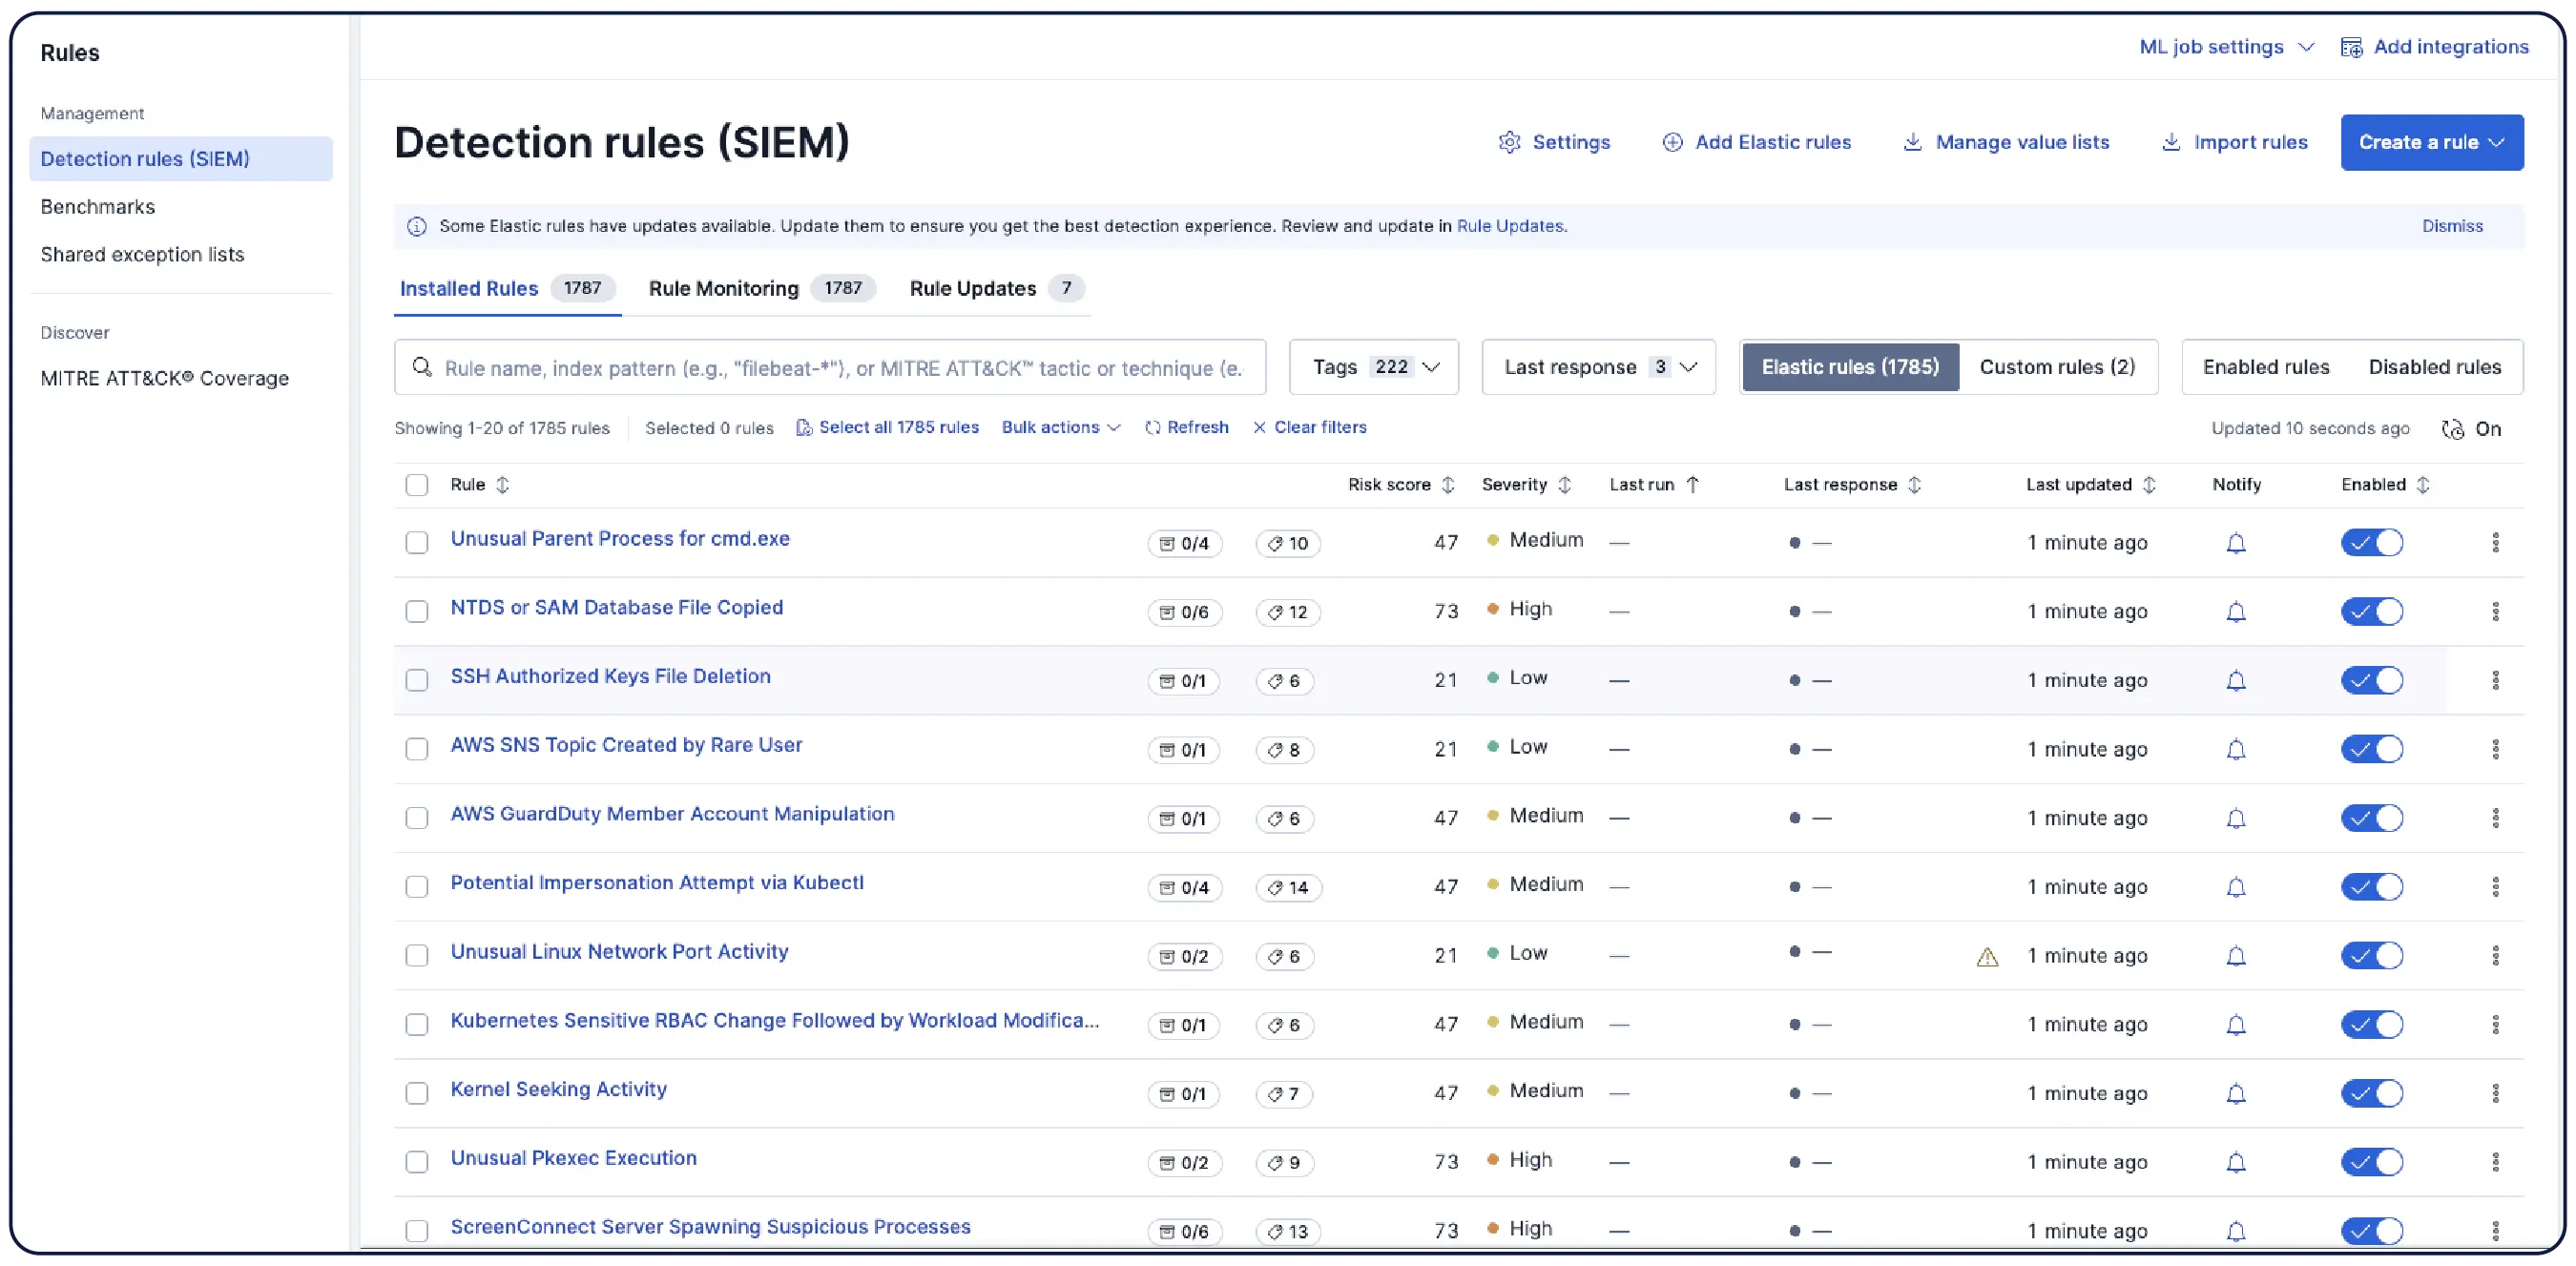
Elastic 支持 400 多个预构建集成,以及总计多达 1,000 个安全和数据源集成。连接新的数据源时,平台会识别数据类型、自动映射架构,并推荐检测规则 — 无需构建流水线。ECS 和 OCSF 的通用架构支持意味着,检测规则只需编写一次,即可跨数据源使用。通过 OpenTelemetry 发送的数据也可获得原生支持。