

AI 全面覆盖,随时随地,满足您的工作需求
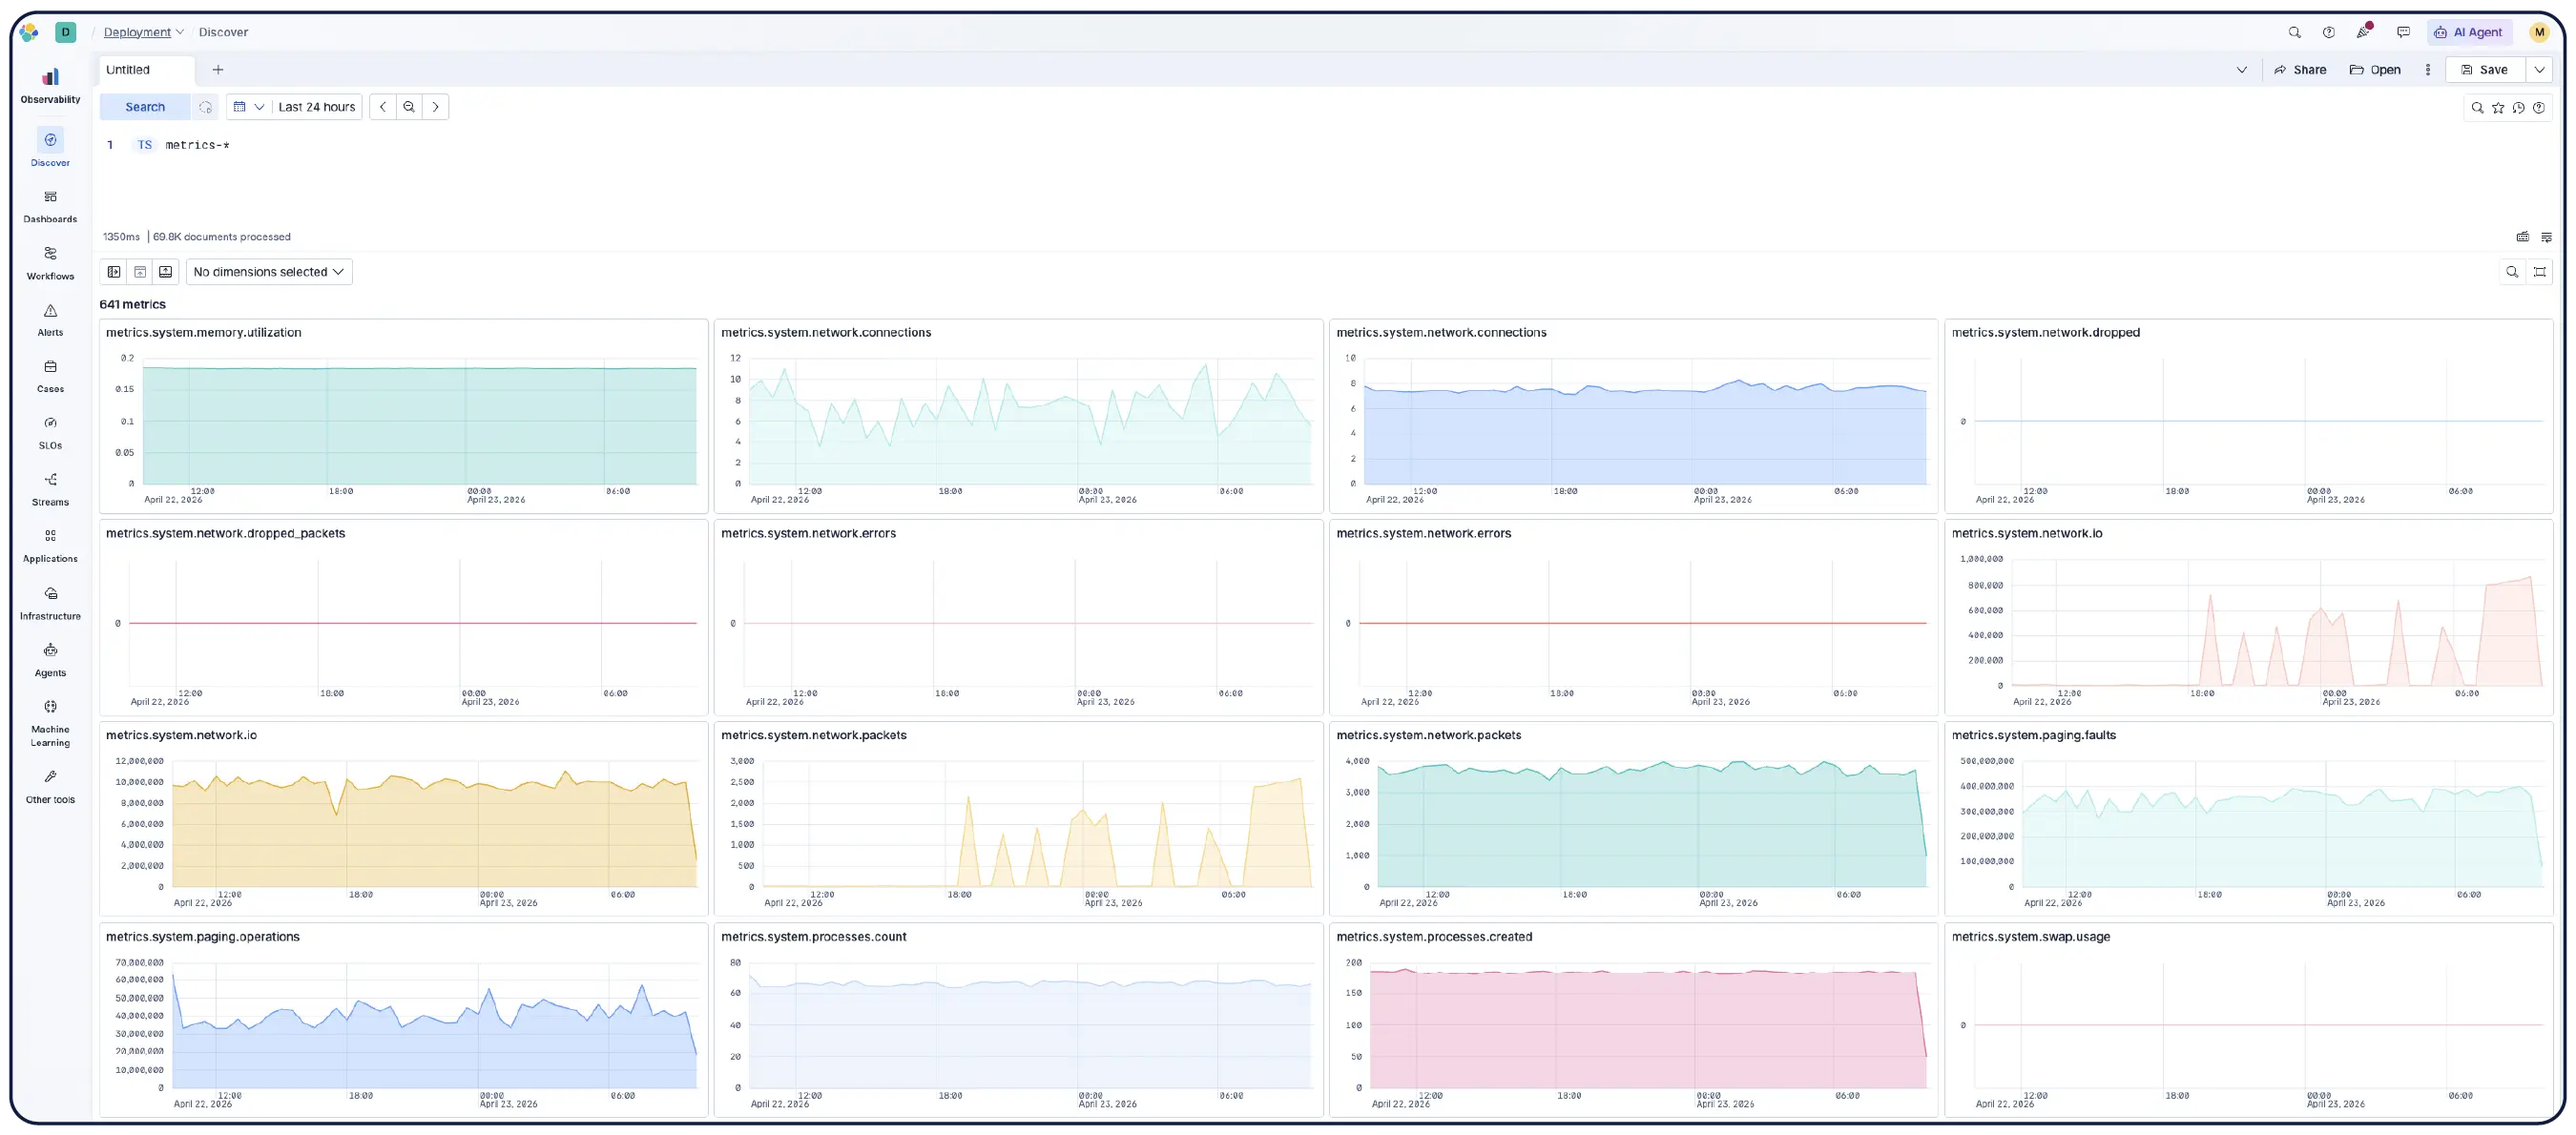
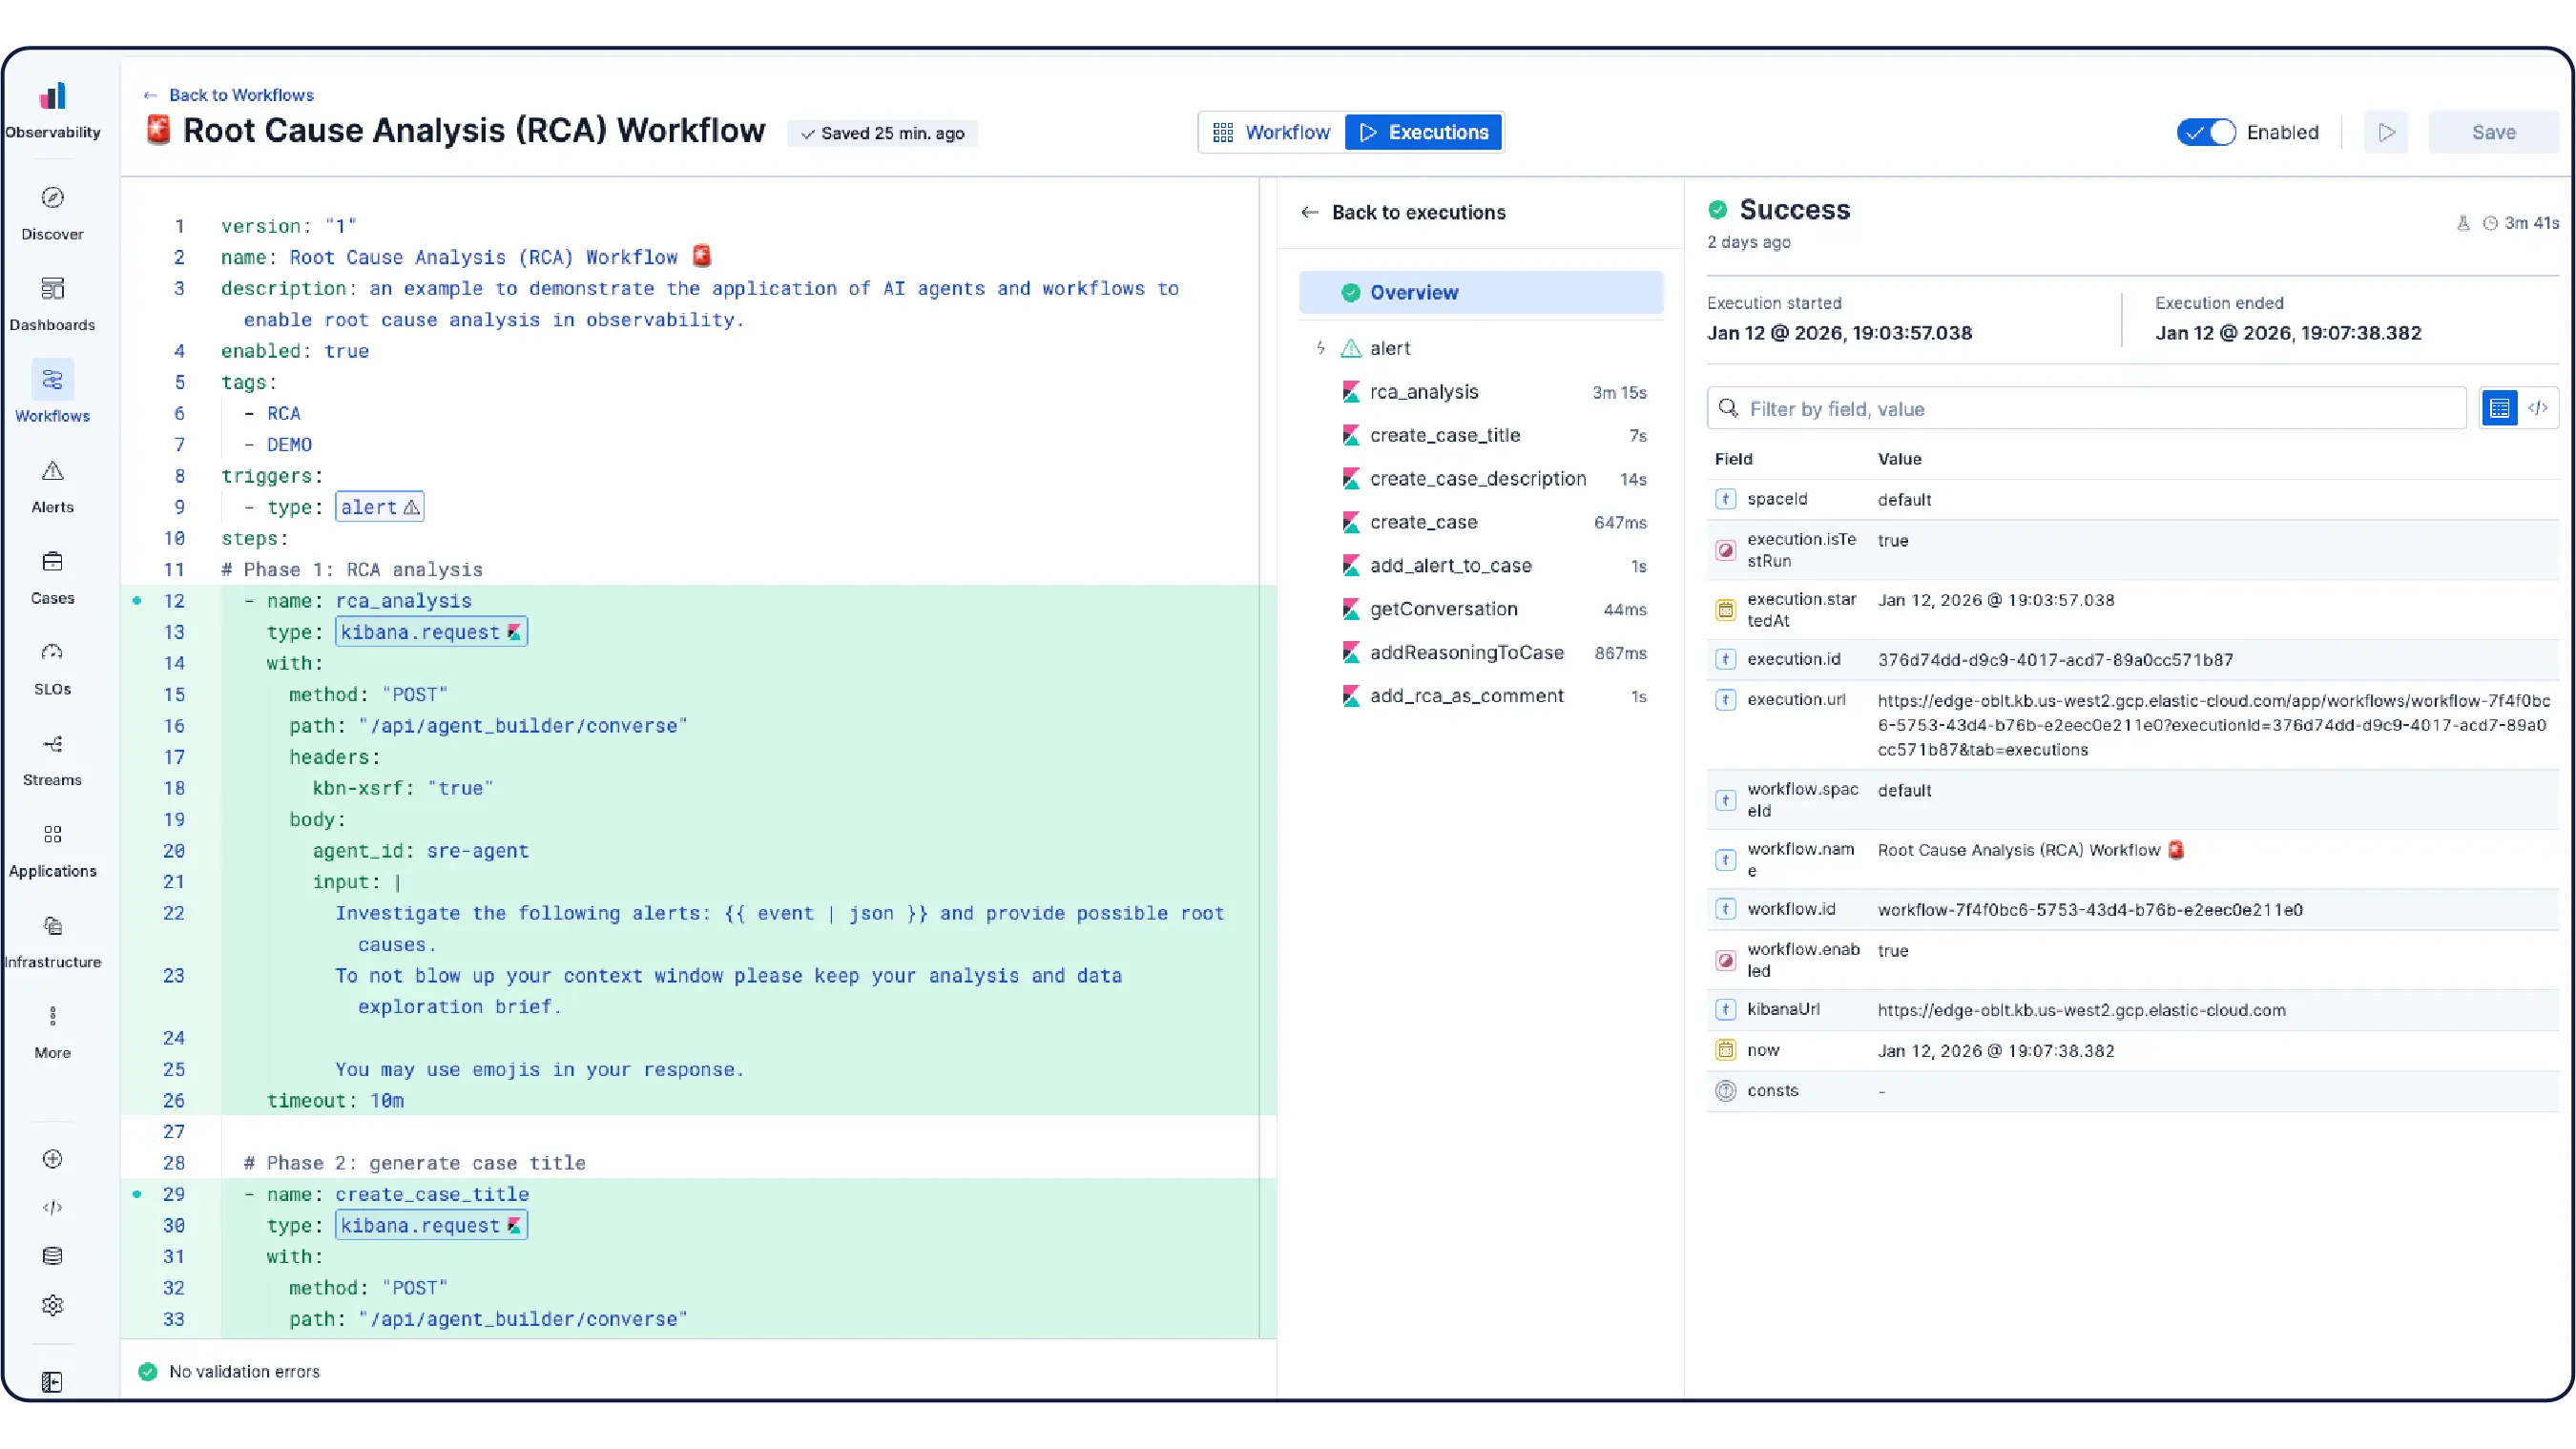
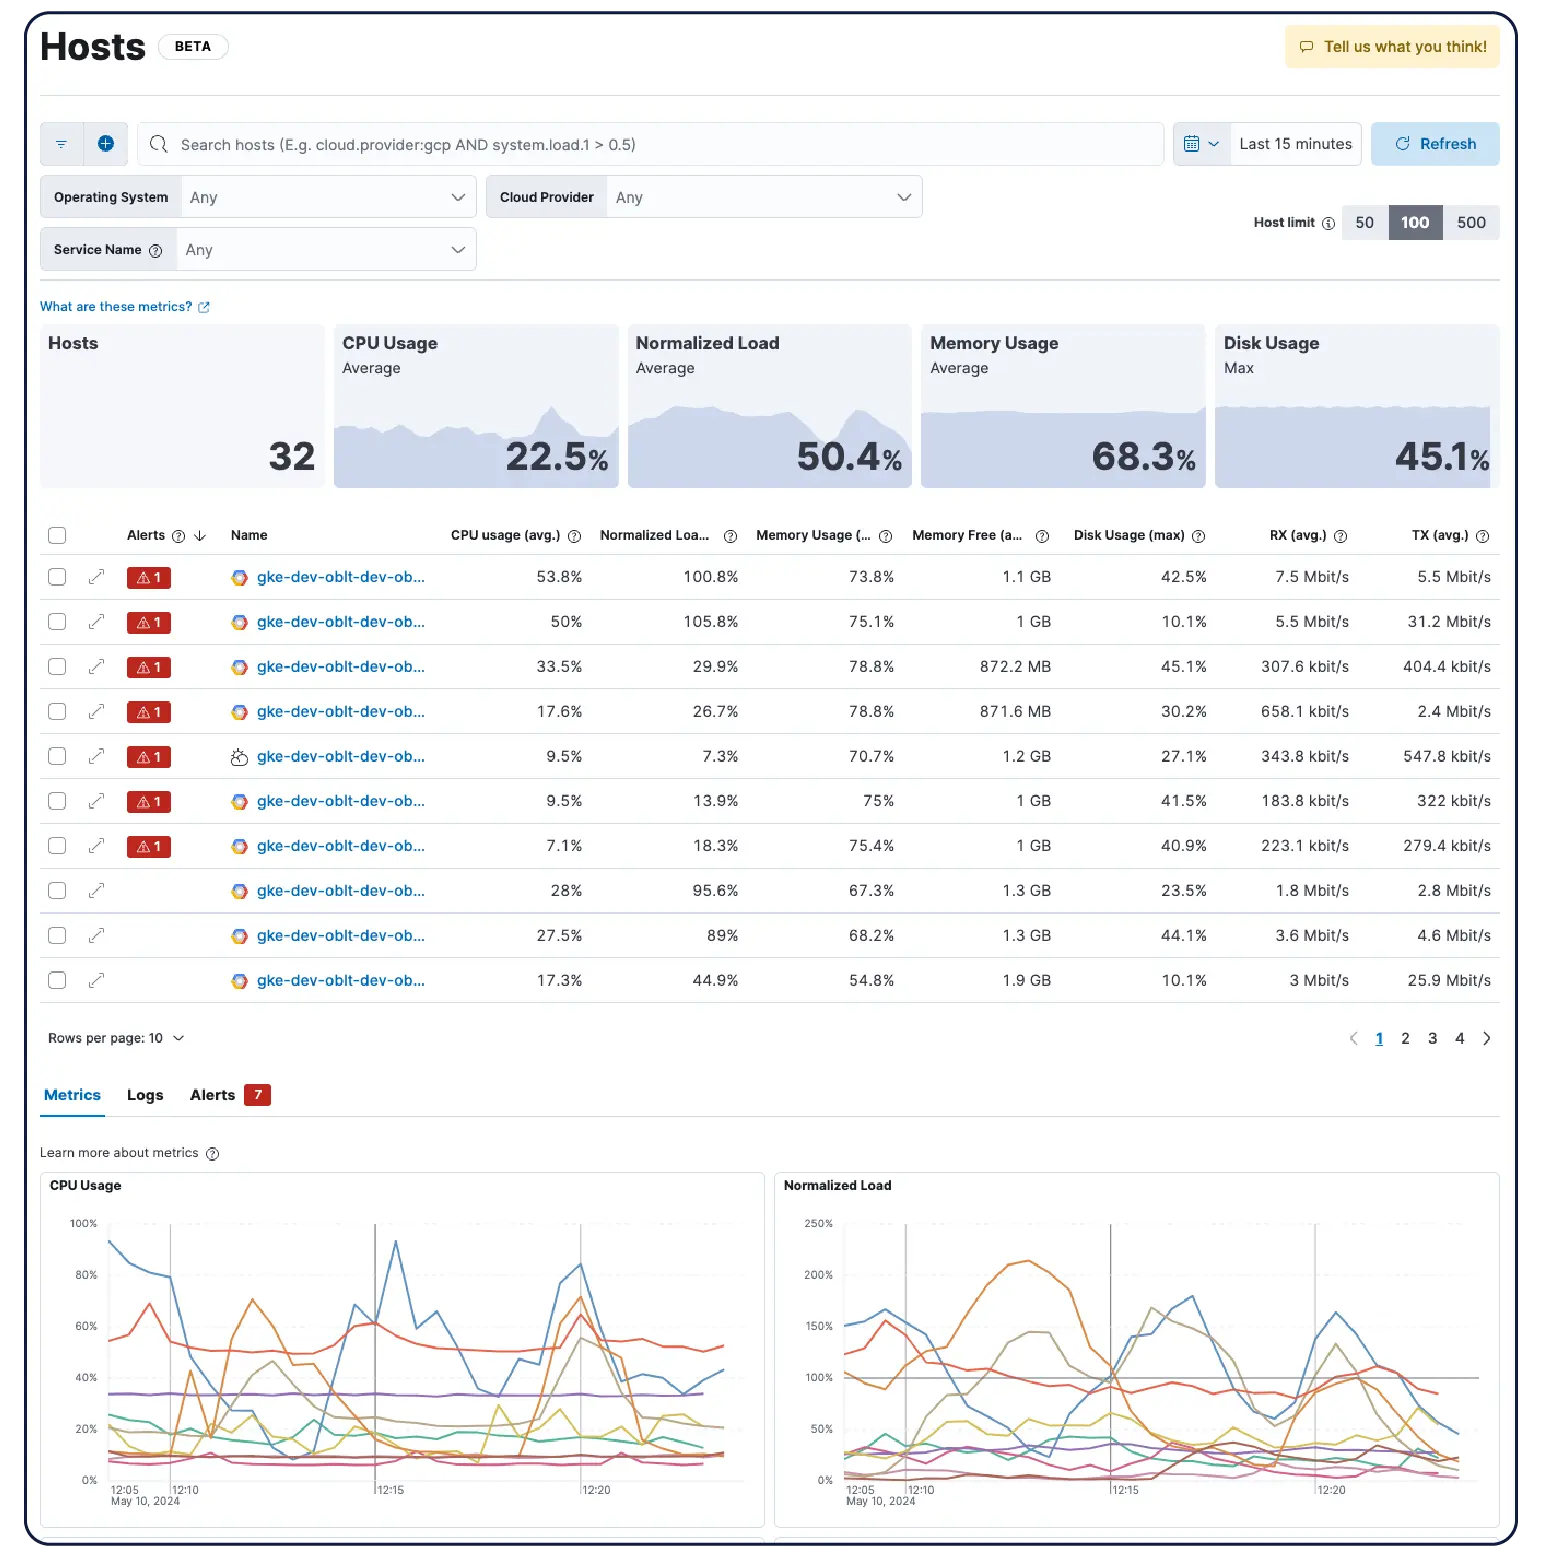
确保连接后即可立即使用已准备就绪的设备。Elastic 的 Kubernetes 监测功能齐全,预配置了仪表板、警报、SLO 和机器学习作业,以及用于健康监测、异常检测、事件调查和修复的代理技能和 MCP 应用。

了解我们如何将 Elasticsearch 重建为领先的列式指标数据存储。请参阅基准测试。
与架构无关
一个数据存储,支持所有格式,无需上下文切换
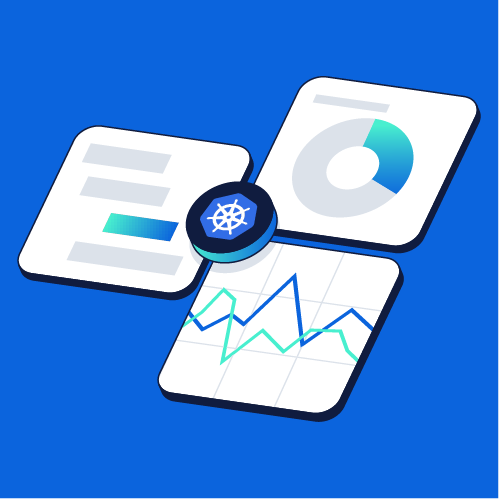
大多数基础设施监测堆栈将所有内容规范化为单一模式,或者迫使您使用多个后端和查询语言。而我们不会。无论您向我们发送的是 OpenTelemetry、Prometheus、Beats 还是其他任何格式的数据,Elasticsearch 都会将其原生地存储在统一的数据存储中,并直接按原始格式进行查询。没有转换层,无信息丢失,无需转椅式调查。
了解像您这样的公司选择 Elastic Observability 的原因
客户聚焦

Comcast 每天通过 Elastic 摄取 400 TB 的数据,以监测服务并加速根本原因分析,确保一流的客户体验。
客户聚焦

Zooplus 使用 Elastic 监测 2,500 个微服务、20,000 个容器、600 个 AWS 账户(包含 70 个 AWS 服务)和 40 个 Kubernetes 集群。
客户聚焦

Informatica 将其整个日志工作负载迁移到 Elastic,涵盖 100 多个应用程序和 300 多个 Kubernetes 集群,从而降低了成本并减少了 MTTR。
加入聊天
加入 Elastic 的全球社区,参与开放对话与协作。


.jpg)

常见问题
什么是基础设施监控?
什么是基础设施监控?
基础架构监控跟踪您的应用程序运行所依赖的系统的健康状况和性能,包括 Web 服务器、容器、云实例、网络设备、缓存、队列、数据库、存储等。它收集 CPU 使用率、内存消耗、磁盘 I/O 和 pod 重启等指标,以便团队可以检测资源饱和情况,在问题升级之前捕获故障,并了解基础架构条件如何影响应用程序行为。有效的基础架构监控将这些指标与日志和追踪相关联,因此工程师可以根据“该主机负载过高”直接找到根本原因,而无需切换工具。
Elastic 如何监测基础设施?
Elastic 如何监测基础设施?
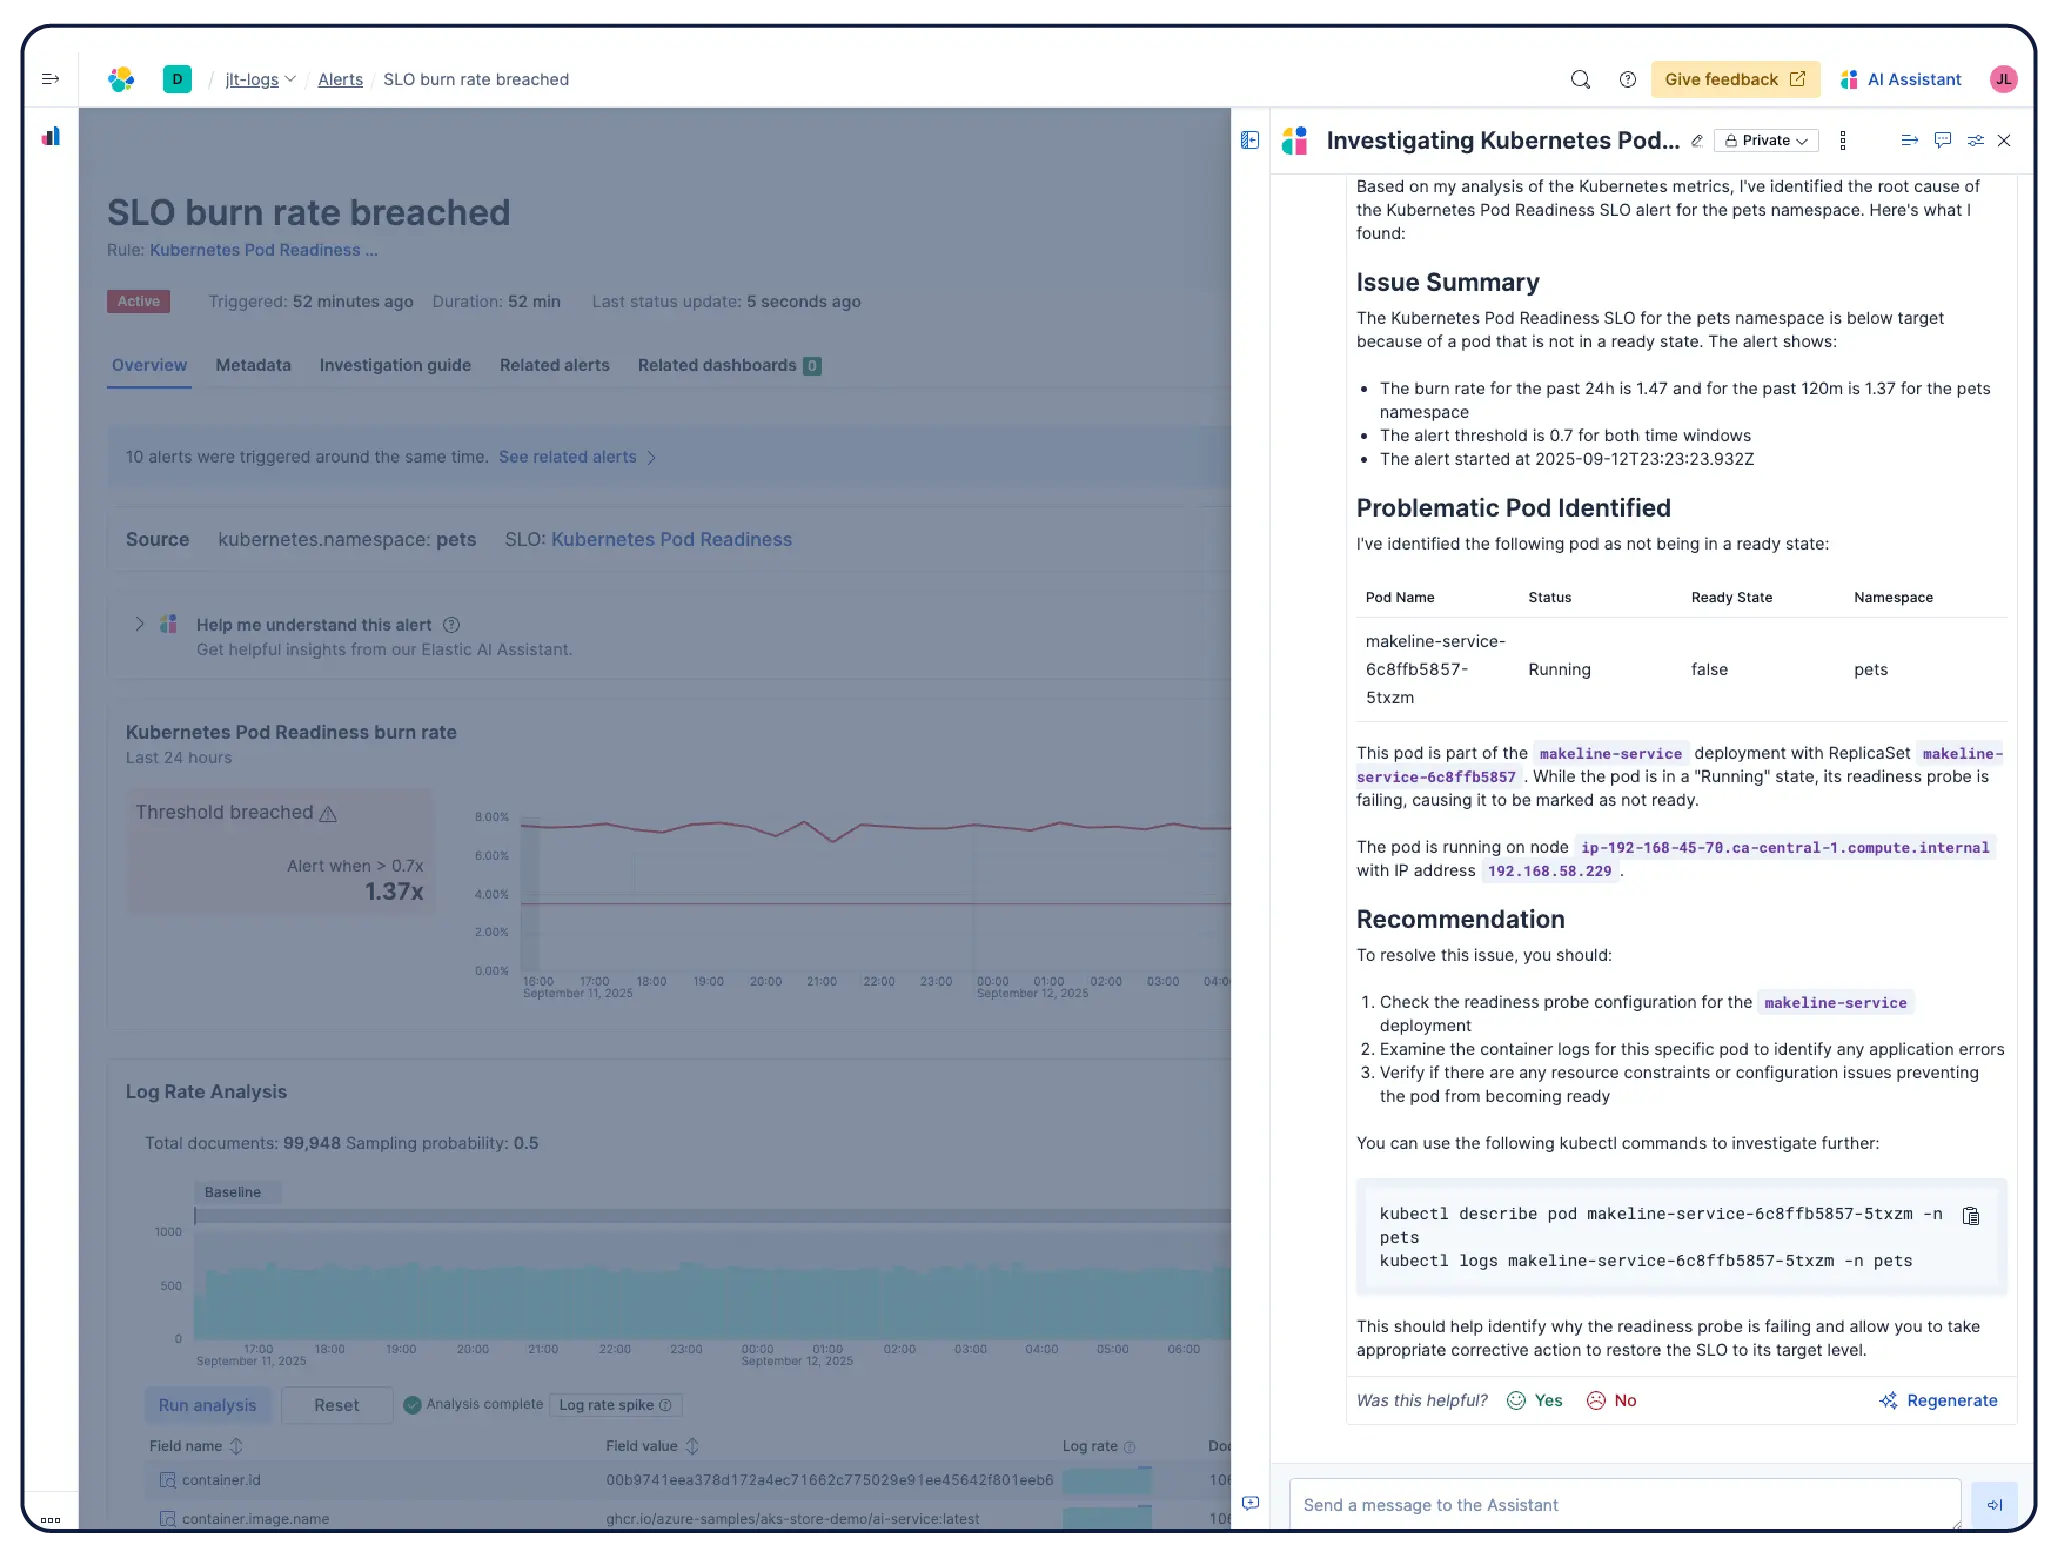
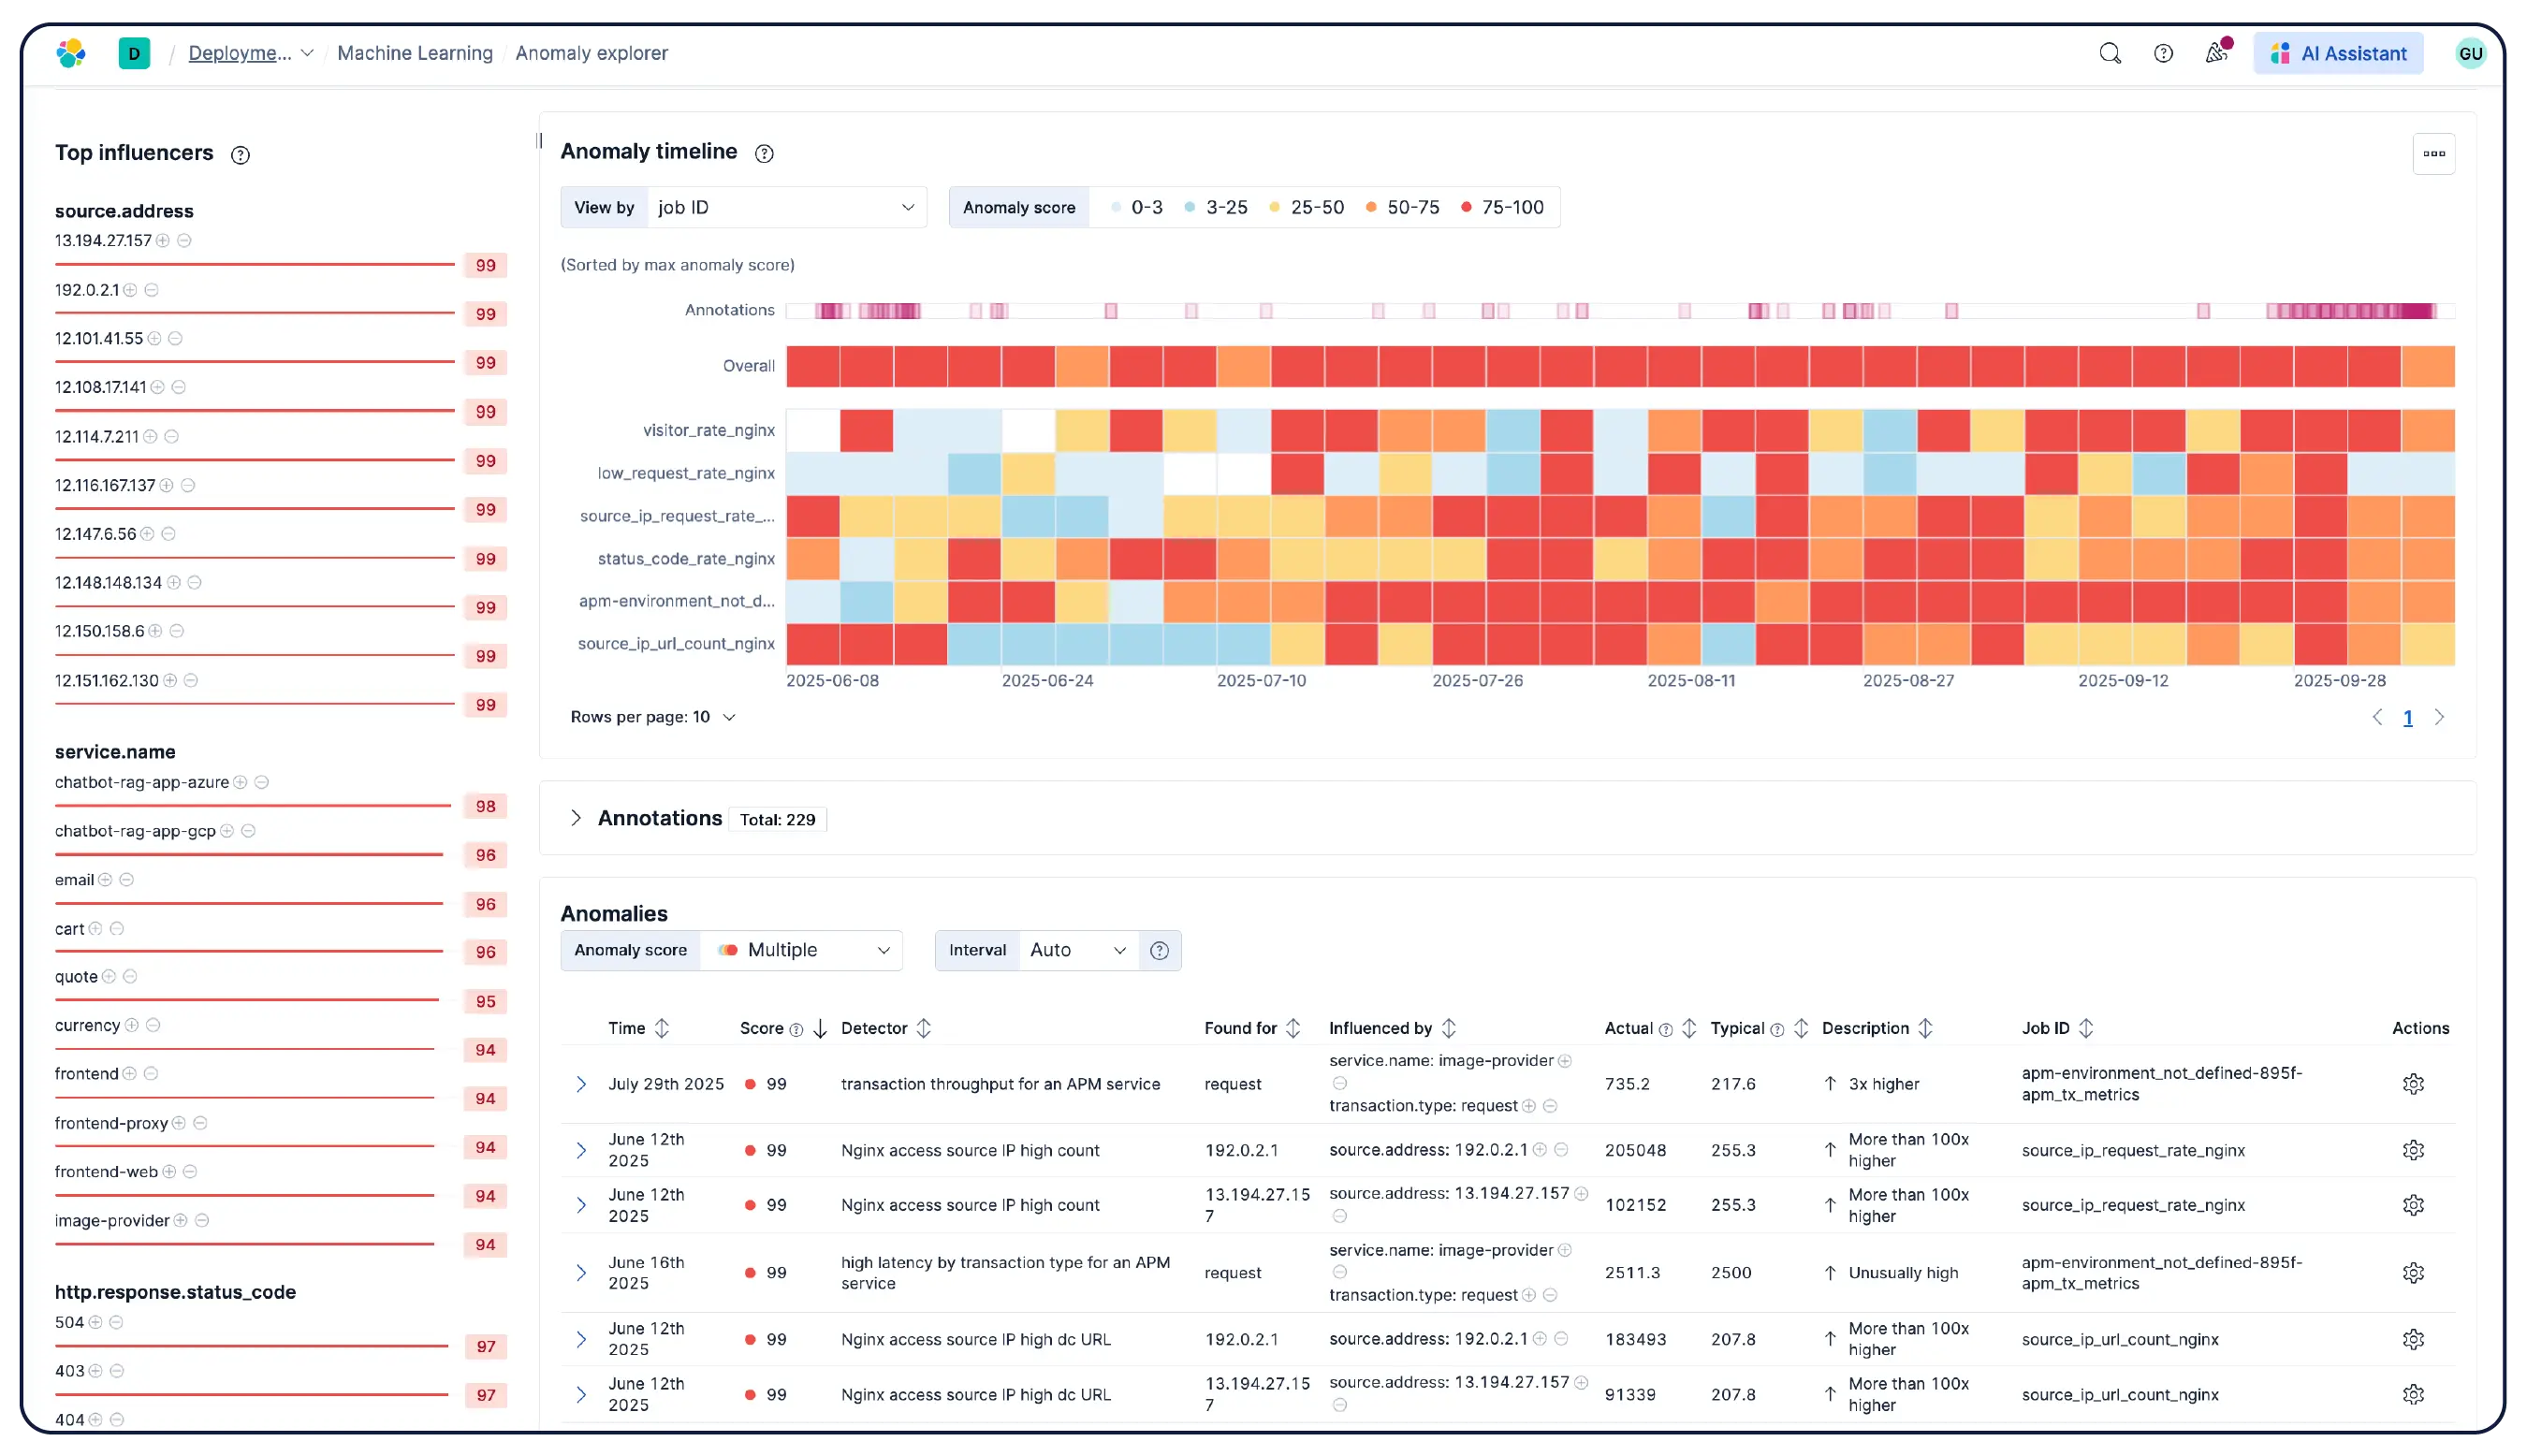
Elastic Observability 可从主机、容器、云服务和 Kubernetes 集群收集指标、日志和跟踪信息,并将它们关联到 Elasticsearch 中,以便团队能够在一个平台上集中调查各种信号。Elastic 提供跨云、本地部署、Kubernetes、无服务器环境和主机的可见性,拥有 550 多个开箱即用的集成和原生 OpenTelemetry 支持。Elastic Agent 通过 Fleet 集中处理数据收集,无需为每个主机配置代理。基于机器学习的异常检测功能可自动发现异常的使用模式,并且由于基础设施指标与应用程序跟踪和日志并存,工程师无需离开平台即可直接从警报跳转到相关的上下文。
Elastic 是否支持 Kubernetes 监测?
Elastic 是否支持 Kubernetes 监测?
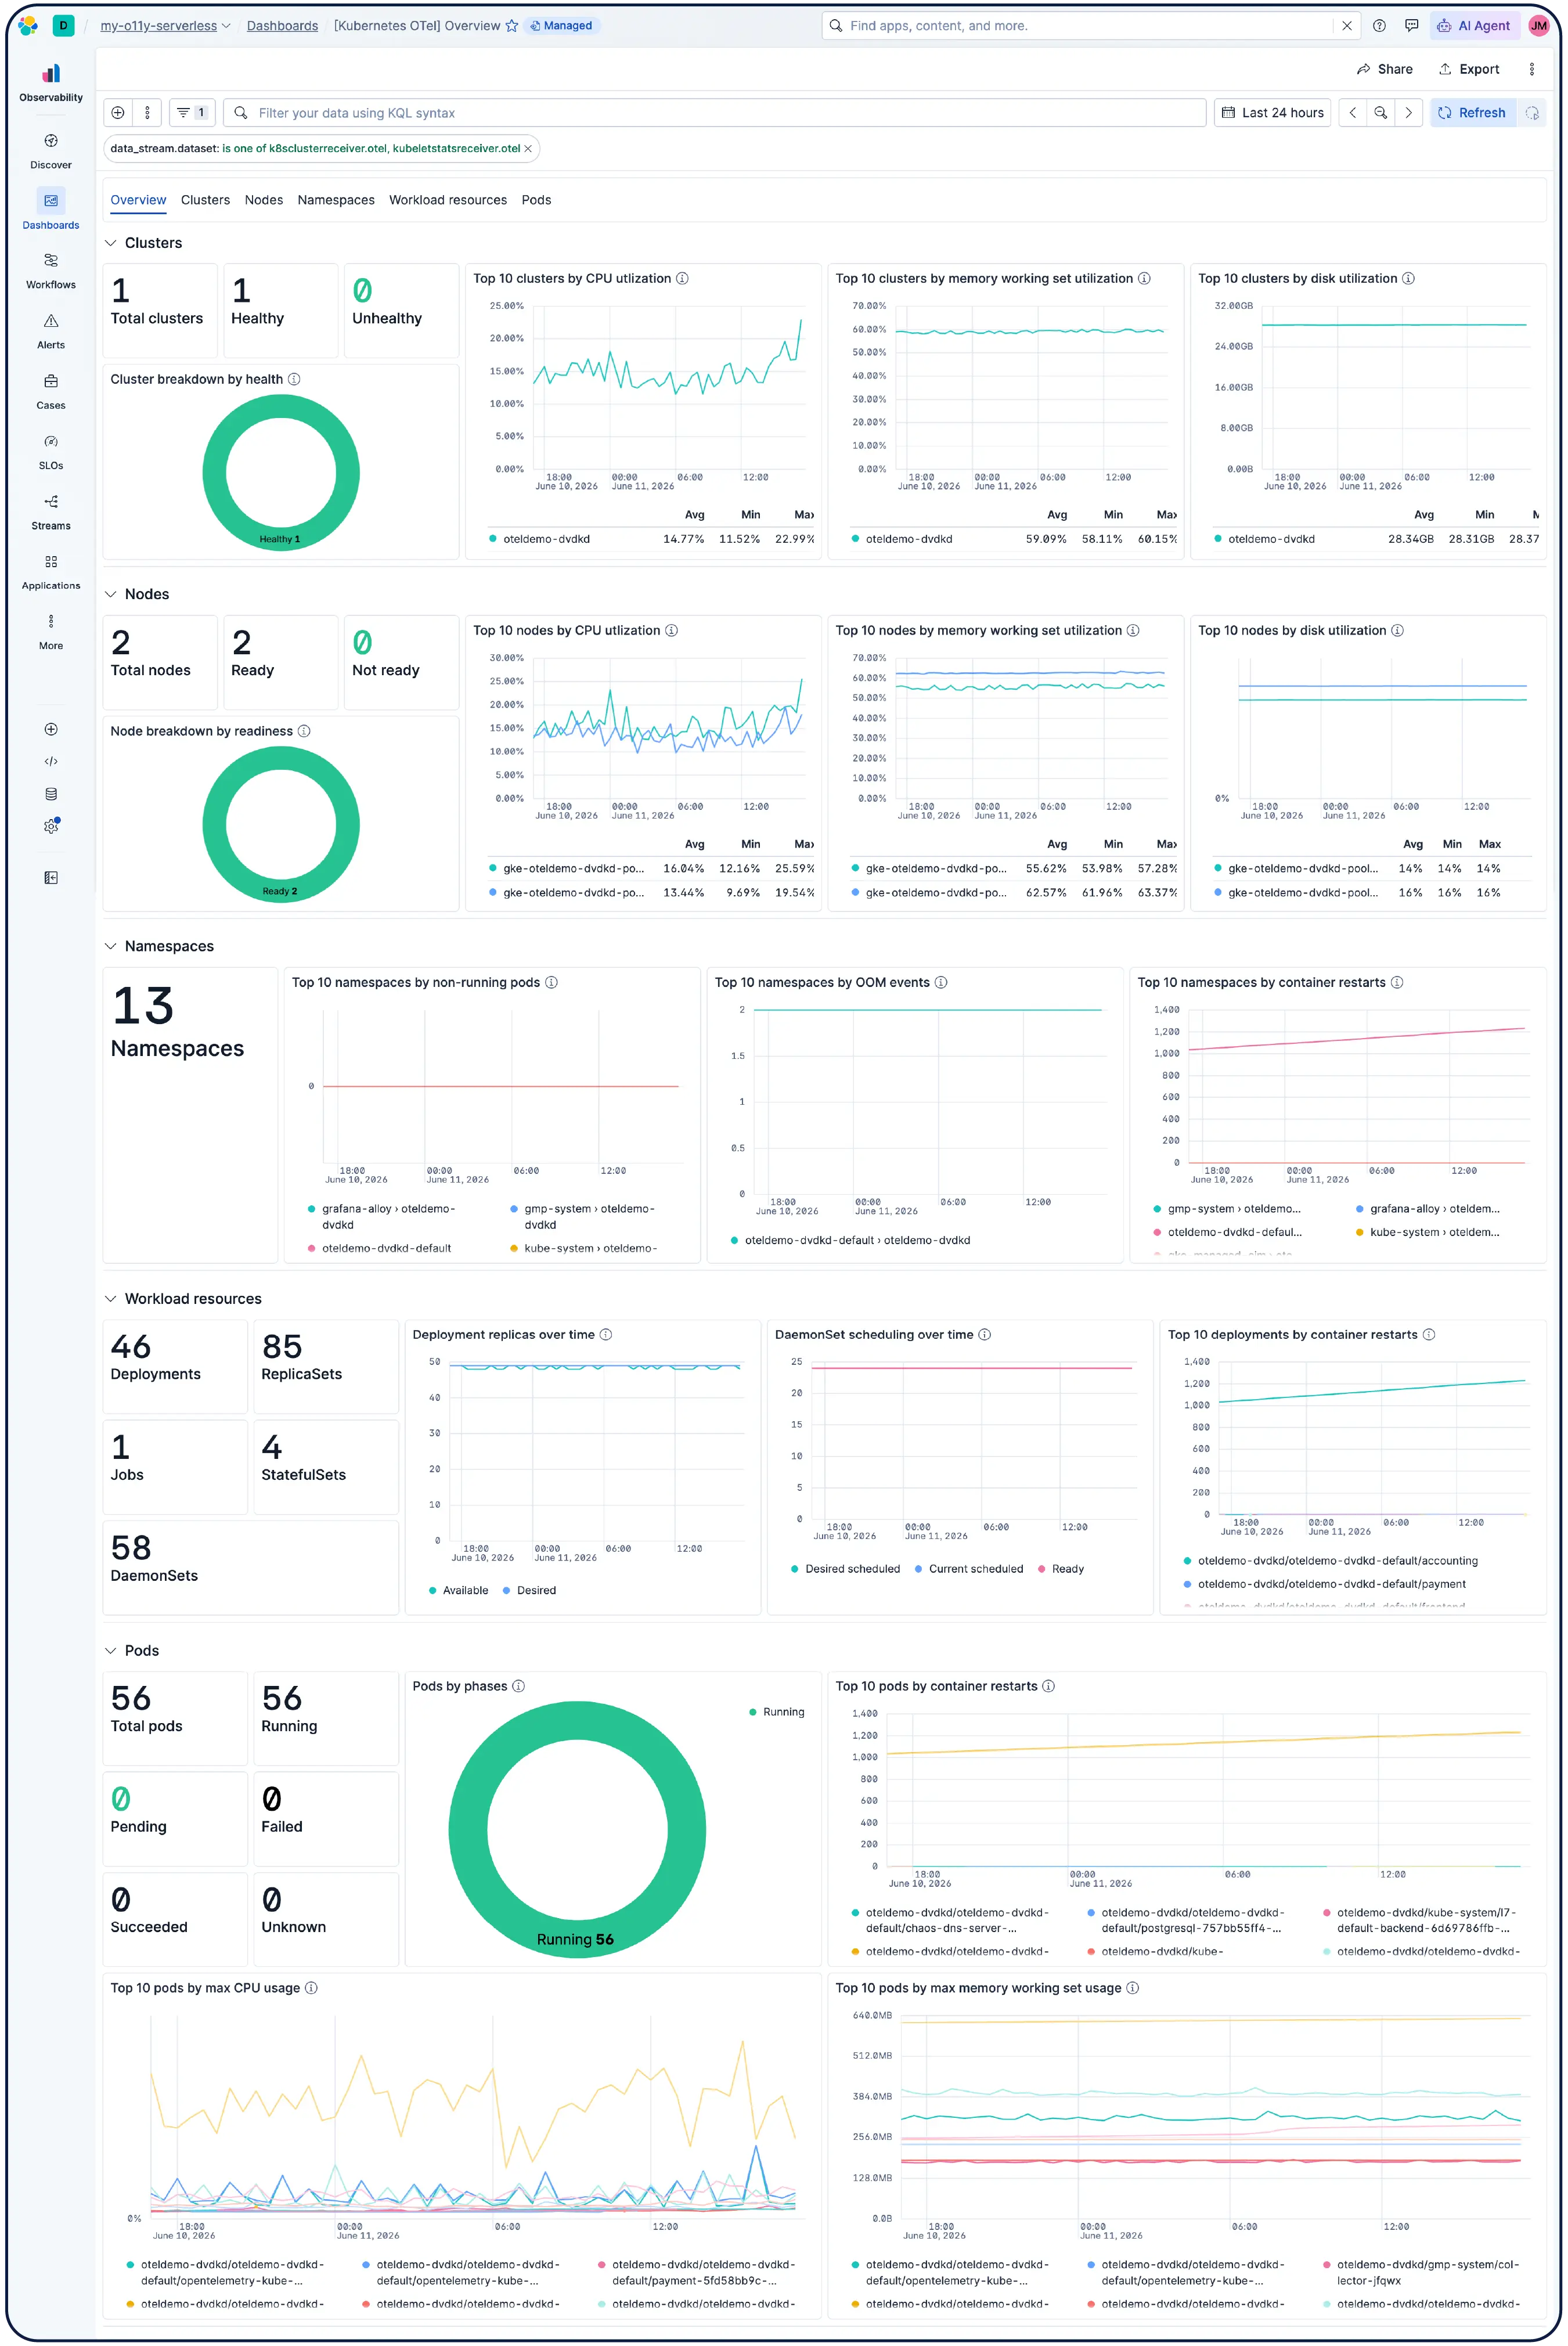
是的。Elastic Observability 专为 监测 Kubernetes 环境而构建,包括 EKS、AKS 和 GKE 上的托管集群,以及自行管理的集群。Elastic 可自动发现动态 Kubernetes 工作负载的变化,并监控运行在任何位置的服务和组件,同时在数据摄取时进行元数据增强,以便您可以筛选、跟踪和识别系统中的通用属性。随着 Pod 的启动和关闭,Elastic 无需手动重新配置即可保持同步。集群资源利用率、Pod 级日志、应用程序跟踪和基础设施指标均从单个部署中收集,并在 Kibana 中进行关联,通过异常检测和日志分类来发现您之前未曾注意到的问题。
Elastic 支持哪些数据格式?
Elastic 支持哪些数据格式?
Elastic Observability 建立在开放标准之上。它原生摄取 OpenTelemetry 协议 (OTLP) ——日志、指标和追踪——无需模式转换或专有翻译。EDOT,即 OpenTelemetry 的 Elastic 分发版,为您提供生产就绪的 OTel 原生生态系统:安装 EDOT 收集器,使用语言 SDK 启用自动插桩,您的数据将以原封不动的 OTel 模式流入 Elasticsearch。原生支持 Prometheus 指标 和 PromQL,并且超过 450 个一键式集成涵盖云服务提供商、数据库、消息队列、网络设备和应用程序框架。Elastic Agent 和 Beats 处理几乎所有常见来源的结构化和非结构化日志格式。
Elastic 如何降低基础设施监测成本?
Elastic 如何降低基础设施监测成本?
Elastic 从存储和架构层面同时降低了可观测性成本。Logsdb 索引模式可通过优化数据排序、利用合成源消除重复数据以及改进压缩,最多可减少 65% 的日志存储需求。对于指标数据,时序数据流 (TSDS) 使用列式存储和时间序列专用编解码器(例如差分增量编码、游程编码和异或编码),从而在 Kubernetes、AWS 和 Nginx 等集成场景中,最多可减少 70% 的指标磁盘空间占用。对于使用 Elastic Cloud Serverless 的团队,云原生对象存储作为主数据存储系统,所有数据均以对象存储的经济性进行保存,无需分层管理或容量规划。
Elastic 的指标定价与竞争对手相比如何?
Elastic 的指标定价与竞争对手相比如何?
Elastic Observability 采用基于使用量的计费模式,不收取主机费用,也不按峰值流量计费。Datadog 的按主机计费模式则根据当月节点峰值数量对自动扩展事件进行计费,而非按平均使用量计费。自定义指标需要额外付费,最高可达平均账单的 52%。Elastic 的计费模式意味着临时性工作负载和高基数 Prometheus 环境不会在月底产生意外费用。